Navigating the mixspace : theoretical and
practical levelbalancing technique in
multitrack music mixtures
Wilson, AD and Fazenda, BM
Title
Navigating the mixspace : theoretical and practical levelbalancing
technique in multitrack music mixtures
Authors
Wilson, AD and Fazenda, BM
Type
Book Section
URL
This version is available at: http://usir.salford.ac.uk/36950/
Published Date
2015
USIR is a digital collection of the research output of the University of Salford. Where copyright
permits, full text material held in the repository is made freely available online and can be read,
downloaded and copied for noncommercial private study or research purposes. Please check the
manuscript for any further copyright restrictions.
NAVIGATING THE MIX-SPACE: THEORETICAL AND PRACTICAL
LEVEL-BALANCING TECHNIQUE IN MULTITRACK MUSIC MIXTURES
Alex Wilson
Acoustics Research Centre
School of Computing, Science and Engineering University of Salford
Bruno M. Fazenda
Acoustics Research Centre
School of Computing, Science and Engineering University of Salford
ABSTRACT
The mixing of audio signals has been at the foundation of audio production since the advent of electrical recording in the 1920’s, yet the mathematical and psychological bases for this activity are relatively under-studied. This paper in-vestigates how the process of mixing music is conducted. We introduce a method of transformation from a “ gain-space” to a “mix-space”, using a novel representation of the individual track gains. An experiment is conducted in order to obtain time-series data of mix engineers explo-ration of this space as they adjust levels within a multi-track session to create their desired mixture. It is observed that, while the exploration of the space is influenced by the initial configuration of track gains, there is agreement be-tween individuals on the appropriate gain settings required to create a balanced mixture. Implications for the design of intelligent music production systems are discussed.
1. INTRODUCTION
The task of the mix engineer can be seen as one of solving an optimisation problem [1], with potentially thousands of variables once one considers the individual level, pan po-sition, equalisation, dynamic range processing, reverbera-tion and other parameters, applied in any order, to many individual audio components.
The objective function to be optimised varies depending on implementation. Conceptually, one should maximise ‘Quality’, an often-debated concept in the case of music production. In this context, borrowing from ISO 9000 [2], we can consider ‘Quality’ to be the degree to which the inherent characteristics of a mix fulfil certain requirements. These requirements may be defined by the mix engineer, the artist, the producer or some other interested party. In a commercial sense, we consider the requirement to be that the mix is enjoyed by a large amount of people.
This paper considers how the mix process could be rep-resented in a highly simplified case, investigates how high-quality outcomes are achieved by human mixers and offers insights into how such results could be achieved by intelli-gent music production systems.
Copyright: c2015 Alex Wilson et al. This is an open-access article distributed
under the terms of theCreative Commons Attribution 3.0 Unported License, which permits unrestricted use, distribution, and reproduction in any medium, provided
the original author and source are credited.
2. BACKGROUND
For many decades the mixing console has retained a recog-nisable form, based on a number of replicated channel strips. Audio signals are routed to individual channels where typ-ical processing includes volume control, pan control and basic equalisation. Channels can be grouped together so that the entire group can be processed further, allowing for complex cross-channel interactions.
One of the most fundamental and important tasks in music mixing is the choice of relative volume levels of instru-ments, known as level-balancing. Due to its ubiquity and relative simplicity, level-balancing using fader control is a common approach to the study of mixing. It has been indi-cated that balance preferences can be specific to genre [3] and, for expert mixers, can be highly consistent [4].
As research in the area has continued, a variety of as-sumptions regarding mixing behaviours have been put for-ward and tested. A number of automated fader control systems have used the assumption that equal perceptual loudness of tracks leads to greater inter-channel intelligi-bility [5, 6]. This particular practice was investigated in a study of “best-practice” concepts [7], which included pan-ning bass-heavy content centrally, setting the vocal level slightly louder than the rest of the music or the use of cer-tain instrument-specific reverberation parameters. A num-ber of these practices were tested using subjective evalua-tion and the equal-loudness condievalua-tion did not necessarily lead to preferred mixes [7].
Much of these “best-practice” techniques may be anecdo-tal, based on the experience of a small number of profes-sionals who have each produced a large number of mixes (see [8, 9] for reviews). Due to the proliferation of the Dig-ital Audio Workstation (DAW) and the sharing of software and audio via the internet, it has now become possible to reverse this paradigm, and study the actions of a large num-ber of mixers on a small numnum-ber of music productions. This allows both quantitative and qualitative study of mix-ing practice, meanmix-ing the dimensions of mixmix-ing and the variation along these dimensions can be investigated.
3. THEORY
When considering a realistic mixing task the number of variables becomes very large. An equaliser alone may have dozens of parameters, such as the center frequency, gain, bandwidth and filter type of a number of independent bands, leading to a large number of combinations. There are meth-ods to reduce the number of variables in these situations. In [11], the combination of track gains and simple equal-isation variables was reduced to a 2D map by means of a self-organising map, where the simple equalisation pa-rameter was the first principal component of a larger EQ system, showing further dimensionality reduction. While these approaches can create approximations of the mix-space, the true representation is difficult to conceive for all but the most simple mixing tasks.
3.1 Defining the “mix-space”
We introduce a new definition for “mix-space”. Fig. 1 shows a trivial example of just two tracks. When mixing, the gains of the two tracks,g1andg2, are adjusted. Here
it can be seen that, using polar coordinates, the angle φ
provides most information about the mix, as it is the pro-portional blend ofg1andg2. Any other point on the line at
angleφwould represent the same balance of instruments, thusr is a scaling factor, corresponding to the combined mix volume. As the gains are normalised to [0,1], φ is bound from 0 toπ/2radians.
For a system of n audio signals, x1(t), . . . , xn(t), we
[image:3.595.383.474.49.146.2]can define ann-dimensionalgain-spacewith time-varying gains g1(t), . . . , gn(t). As the n gains are adjusted this gain-spaceis explored. Consider the case when allngains are increased or decreased by an equal amount. While there is a clear displacement in the gain-space, there is no change to the overall mix, only a change in volume. Ac-knowledging this, and by extending the concept shown in Fig. 1, the hyperspherical co-ordinates of a point in the gain-space are used to transform to the mix-space. This co-ordinate system, written as(r, φ1, φ2, . . . , φn−1), is
de-fined by Eqn. 1.
r=pgn2+gn−12+· · ·+g22+g12 (1a)
φ1= arccos
g1 p
gn2+gn−12+· · ·+g12
(1b)
φ2= arccos
g2 p
gn2+gn−12+· · ·+g12
(1c)
.. .
φn−2= arccos
gn−2 p
g2
n+gn−12+gn−22
(1d)
φn−1=
arccos√ gn−1 g2
n+gn−12
gn≥0
2π−arccos√ gn−1 g2
n+gn−12
gn<0
(1e)
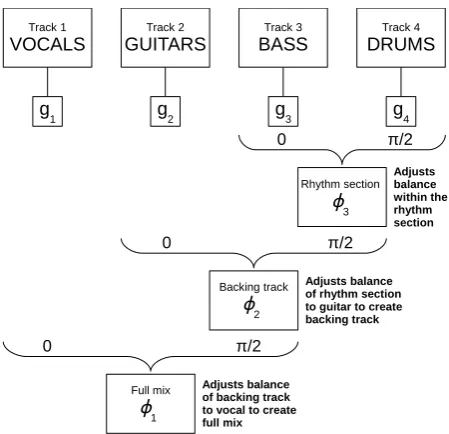
Consider a system of four tracks, as shown in Fig. 2. Here,φ3denotes the balance of the drum and bass tracks,
to form the rhythmic foundation of the mix. φ2 describes
the projection of this balance onto the guitar dimension,
φ
r
[image:3.595.314.539.210.427.2]g1 g2
Figure 1: The point represents a balance of two instru-ments, controlled by gainsg1andg2. Any other point on
the line at angle φwould represent the same balance of instruments, thusris a scaling factor.
Track 1
VOCALS GUITARSTrack 2 BASSTrack 3 DRUMSTrack 4
Rhythm section
φ3
Backing track
φ2
Full mix
φ1
Adjusts balance within the rhythm section
Adjusts balance of rhythm section to guitar to create backing track
Adjusts balance of backing track to vocal to create full mix
g1 g2 g3 g4
0 π/2
0 π/2
0 π/2
Figure 2: Schematic representation of a four-track mixing task and the semantic description of the threeφterms.
and thus, the complete musical backing track. φ1 then
describes the balance between this backing track and the vocal. Using this notation, φ1 has been studied in
iso-lation in previous studies [3, 4]. For a system with four tracks only threeφterms must be determined to construct the mix-space. Convention typically dictates thatφn−1
de-scribes an equatorial plane and ranges over[0,2π)and that all other angles range from[0, π], however since all gains are positive, each angle ranges over[0, π/2], as in Fig. 1.
Sinceris a scaling factor, when the values of allφterms are held constant, there is a constant difference in the rela-tive gains of each track, when expressed in decibels. This can be illustrated by convertingφterms back to gain terms, which can be achieved using Eqn. 2.
g1=rcos(φ1) (2a)
g2=rsin(φ1) cos(φ2) (2b)
g3=rsin(φ1) sin(φ2) cos(φ3) (2c)
.. .
gn−1=rsin(φ1)· · ·sin(φn−2) cos(φn−1) (2d)
[image:3.595.74.289.550.710.2]3.2 Characteristics of the mix-space
With a mix-space having been defined, what characteristics does the space have? How does the act of mixing explore this space? We now discuss three scenarios - beginning at a ‘source’, exploring the ‘mix-space’ and arriving at a ‘sink’
3.2.1 The ‘source’
In a real-world context, when a mixer downloads a mul-titrack session and first loads the files into a DAW, each mixer will initially hear the same mix, a linear sum of the raw tracks1. While each of these raw tracks can be pre-sented in various ways if we presume each track is recorded with high signal-to-noise ratio (as would have been more important when using analogue equipment) then, with all faders set to 0dB, the perceived loudness of those tracks with reduced dynamic range (such as synthesisers, electric bass and distorted electric guitars) would be higher than that of more dynamic instruments.
Much like the final mixes, this initial ‘mix’ can be rep-resented as a point in some high-dimensional, or feature-reduced, space. It is rather unlikely that a mixer would open the session, hear this mix and consider it ideal, there-fore, changes will most likely be made in order to move away from this location in the space. For this reason, this position in the mix-space is referred to as a ‘source’.
In practice, the session, as it has been received by the mix engineer, may be an “unmixed sum” or may be a rough mix, as assembled by the producer or recording engineer. In a real-world scenario, the work may be received as a DAW session, where tracks have been roughly mixed. Al-ternatively, where multitrack content is made available on-line, such as in mix competitions, the unprocessed audio tracks are usually provided without a DAW session file. The latter approach is assumed in this study, in order for mix engineers to have full creative control over the mixing process. If mixers were to make unique changes to the ini-tial configuration then that source can be considered to be radiating omni-directionally in the mix-space. However, it is possible that, for a given session, there may be some changes which will seem apparent to most mixers, for ex-ample, a single instrument which is louder than all others requiring attenuation. For such sessions, the source may be unidirectional, or if a number of likely outcomes exist, there may exist a number of paths from the source.
3.2.2 Navigating the mix-space
The path from thesourceto the final mix could be repre-sented as a series of vectors in the mix-space, henceforth named ‘mix-velocity’, and defined in Eqn. 3, for the three dimensions shown in Fig. 2.
1Here it is significant that a DAW typically defaults to faders at 0dB,
while a separate mixing console may default to all faders at -∞dB. This allows an experimenter to ensure that all mixers begin by hearing the same ‘mix’. This has been referred to in previous studies as an ‘unmixed sum’ or a ‘linear sum’. While the term ‘unmixed’ can be misleading, it does reflect the fact that the artistic process of mixing has not yet begun.
ut=φ(1,t)−φ(1,t−1) (3a)
vt=φ(2,t)−φ(2,t−1) (3b)
wt=φ(3,t)−φ(3,t−1) (3c)
If all mixers begin at the samesourcethen a number of questions can be raised in relation to movement through themix-space.
• Moving away from thesource, at what point do mix engineers diverge, if at all?
• How do mix engineers arrive at their final mixes? What paths through themix-spacedo they take?
• Do mix engineers eventually converge towards an ideal mix?
3.2.3 The ‘sink’
Complementary to the concept of asourcein themix-space, a ‘sink’ would represent a configuration of the input tracks which produces a high-quality mix that is apparent to a sizeable portion of mix engineers and to which they would mix towards. As the concept of quality in mixes is still rel-atively unknown there are a number of open questions in the field which can be addressed using this framework.
• Is there a single sink, i.e. one ideal mix for each mul-titrack session? In this case the highest mix-quality would be achieved at this point.
• Are there multiple sinks, i.e. given enough avail-able mixes, are these mixes clustered such that one can observe a number of possible alternate mixes of a given multitrack session? These multiple sinks would represent mixes that are all of high mix-quality but audibly different.
4. EXPERIMENT
To the authors’ knowledge, there is a lack of appropriate data available to directly test the theory presented in Sec-tion 3. In order to examine how mix engineers navigate the mix-space a simple experiment was conducted. In this instance the mixing exercise is to balance the level of four tracks, using only a volume fader for each track. Impor-tantly, the participants will all begin with a predetermined balance, in order to examine the source directivity. This ex-periment aims to answer the following research questions:
Q1. Can the source be considered omni-directional or are there distinct paths away from the source?
Q2. Is there an ideal balance (single sink)?
Q3. Are there a number of optimal balances (multiple sinks)?
Previous studies have indicated that perceptions of quality and preference in music mixtures are related to subjec-tive and objecsubjec-tive measures of the signal, with distortion, punch, clarity, harshness and fullness being particularly important [12, 13]. By using only track gain and no pan-ning, equalisation or dynamics processing, most of these parameters can be controlled.
4.1 Stimuli
The multitrack audio sessions used in this experiment have been made available under a creative commons license2 3. These files are also indexed in a number of databases of multitrack audio content4 5 Three songs were used for this experiment, which consisted of vocals, guitar, bass and drums, as per Fig. 2, and as such the interpretations ofφn
from here on are those in Fig. 2.
The four tracks used from “Borrowed Heart” are raw tracks, where no additional processing has been performed apart from that which was applied when the tracks were recorded6. The tracks from “Sister Cities” also
repre-sent the four main instruments but were processed using equalisation and dynamic range compression. These can be referred to as ‘stems’, as the 11 drum tracks have been mixed down, the two bass tracks (a DI signal and ampli-fier signal) have been mixed together, the guitar track is a blend of a close and distant microphone signals and the vo-cal has undergone parallel compression, equalisation and subtle amounts of modulation and delay. In the case of “Heartbeats”, the tracks used are complete ‘mix stems’, in that the song was mixed and bounced down to four tracks consisting of ‘all vocals’, ‘all music’ (guitars and synthe-sisers), ‘all bass’ and ‘all drums’. For testing, the audio was further prepared as follows:
• 30-second sections were chosen, so that participants would be able to create a static mix, where the de-sired final gains for each track are not time-varying.
• Within each song, each 30-second track was nor-malised according to loudness. In this case, loudness is defined by BS.1770-3, with modifications to in-crease the measurements suitability to single instru-ments, rather than full-bandwidth mixes [14]. This allows the relative loudness of instruments to be de-termined directly from the mix-space coordinates.
• For each song, two source positions were selected. Theφterms were selected using a random number generator, with two constraints: to ensure the two sources are sufficiently different, the pair of sources must be separated by unit Euclidean distance in the mix-space and to ensure the sources are not mixes where any track is muted, the values were chosen from the rangeπ/8to3π/8(see Fig. 2).
2http://weathervanemusic.org/shakingthrough 3http://www.cambridge-mt.com/ms-mtk.htm 4http://multitrack.eecs.qmul.ac.uk/ 5http://medleydb.weebly.com/
6
[image:5.595.309.539.47.234.2]https://s3.amazonaws.com/tracksheets/Hezekiah+Jones+-+Tracksheet.xlsx
Figure 3: GUI of mixing test. The faders are unmarked and all begin at the same central value, which prevents par-ticipants from relying on fader position to dictate their mix.
4.2 Test panel
In total, 8 participants (2 female, 6 male) took part in the mixing experiment. As staff and students within Acous-tics, Digital Media and Audio Engineering at University of Salford, each of these participants had prior experience of mixing audio signals. The mean age of participants was 25 years and none reported hearing difficulties.
4.3 Procedure
Rather than use loudspeakers in a typical control room, the test set-up used a more neutral reproduction. The experi-ment was conducted in a semi-anechoic chamber at Uni-versity of Salford, where the background noise level was negligible. Audio was reproduced using a pair of Sennheiser HD800 headphones, connected to the test computer by a Focusrite 2i4 USB interface. Due to the nature of the task, each participant adjusted the playback volume as required. Reproduction was monaural, presented equally to both ears. While the choice between loudspeakers and headphones is often debated [15], in this case, particularly as repro-duction was mono, headphones were considered to be the choice with greater potential for reproducibility.
The experimental interface was designed using Pure Data, an open source, visual programming language. The GUI used by participants is shown in Fig. 3. Each participant listens to the audio clip in full at least once, then the audio is looped while mixing takes place and fader movement is recorded. The participant then clicks ‘stop mix’ and the next session is loaded. For each session the user is asked to create their preferred mix by adjusting the faders.
−25 −20 −15 −10 −5 0
Vocals Guitar Bass Drums
Relative
Loudness
[image:6.595.321.533.55.399.2](LU)
Figure 4: Normalised gain levels of each track, evaluated over all final mix positions.
format. As shown in Fig. 3, the true instrument levels were hidden from participants by displaying arbitrary fader con-trols. The range of the faders was limited to±20dB from the source, to prevent solo-ing any instrument, due to the uniqueness of the mix-space breaking down at boundaries.
5. RESULTS AND DISCUSSION
For each participant, song and source, the recorded time-series data was downsampled to an interval of 0.1 seconds, then transformed from gain to mix domains using Eqn. 1. From this data the vectors representing mix-velocity, de-scribed in Section 3.2.2, were obtained using Eqn. 3.
5.1 Instrument levels
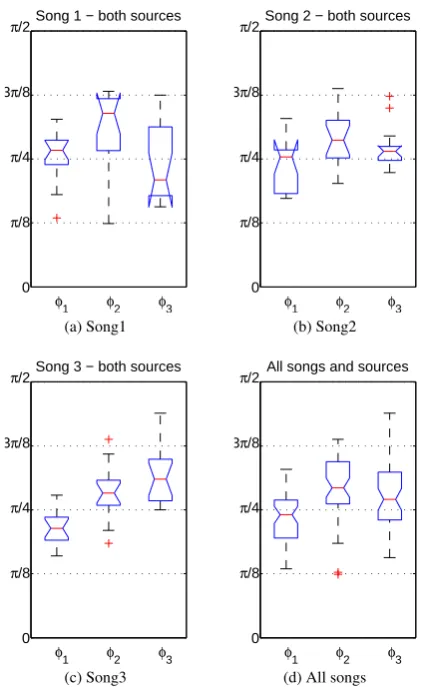
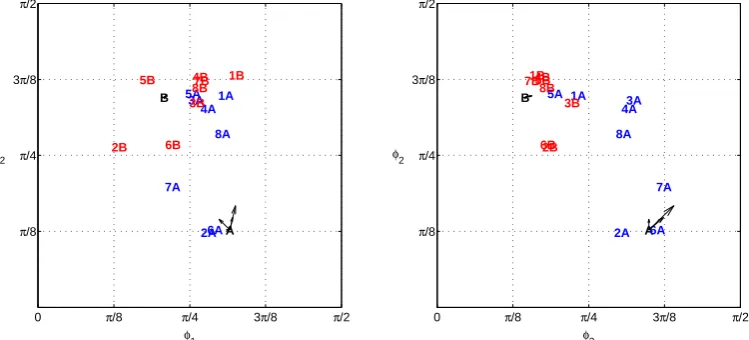
Since the experiment is concerned with relative loudness levels between instruments and not the absolute gain val-ues which were recorded, normalised gains can be calcu-lated from Eqn. 2, withr= 1. When all songs, sources and participants are considered, the distribution of normalised gains at the final mix positions is shown in Fig. 4, ex-pressed in LU. In Fig. 4 and 5 the boxplots show the median at the central position and the box covers the in-terquartile range. The whiskers extend to extreme points not considered outliers and outliers are marked with a cross. Two medians are significantly different at the 5% level if their notched intervals do not overlap. Fig. 4 shows good agreement with previous studies, particularly a level of ≈ −3LU for vocals [7, 10] and ≈ −10LU for bass (see Fig. 1 of [10]). Fig. 6 also shows the final posi-tions of all mixes of each song, where mix ‘1A’ is the mix produced by mixer 1, starting at source A, etc. This indi-cates a clustering of mixes based on the source position. Fig. 5d shows the box-plot of eachφvalue when data for all songs, sources and participants is combined. Since the audio tracks were loudness-normalised, the median value can be used to determine the preferred balance of tracks in terms of relative loudness, using Eqn 4. The results are shown in Table 1. Had the experiment been performed in a more conventional control room with studio monitors, less variance might have been observed [15].
0
π/8
π/4 3π/8
π/2
φ1 φ2 φ3
Song 1 − both sources
(a) Song1
Song 2 − both sources
0
π/8
π/4 3π/8
π/2
φ1 φ2 φ3
(b) Song2
Song 3 − both sources
0
π/8
π/4 3π/8
π/2
φ1 φ2 φ3
(c) Song3
0
π/8
π/4 3π/8
π/2
φ1 φ2 φ3
All songs and sources
(d) All songs
Figure 5: Boxplots showing the distribution ofφterms at final mix positions. While balances vary with song, vo-cal/backing balance and guitar/rhythm balance are more consistent than the bass/drums balance.
vocals/backing=20×log10
cos(φ1)/
sin(φ1)
(4a)
guitar/rhythm=20×log10cos(φ2)/
sin(φ2)
(4b)
bass/drums=20×log10cos(φ3)/
sin(φ3)
(4c)
Balance Song 1 Song 2 Song 3 All
vocals/backing -0.95 -0.23 +1.98 +0.54 guitar/rhythm -5.15 -2.04 -1.78 -2.38 bass/drums +2.27 -0.83 -3.35 -1.12
Table 1: Median level-balances (in loudness units) from Fig. 5, between sets of instruments defined by Fig. 2.
5.2 Source-directivity
Movement away from the source is characterised by the first non-zero element of the mix-velocity triple u, v, w
[image:6.595.100.243.55.211.2]A
B 1A
2A 3A
4A 5A
6A 7A
8A
1B
2B
3B 4B 5B
6B 7B 8B
φ2
φ1
0 π/8 π/4 3π/8 π/2
π/8 π/4 3π/8 π/2
A
B 1A
2A 3A 4A 5A
6A 7A 8A
1B
2B 3B 4B 5B
6B 7B
8B
φ2
φ3
0 π/8 π/4 3π/8 π/2
π/8 π/4 3π/8 π/2
(a) Song 1 - the central cluster of mixes contains mixes originating at both sources.
A
B
1A
2A 3A
4A 5A
6A 7A
8A
1B 2B 3B4B
5B
6B 7B
8B
φ2
φ1
0 π/8 π/4 3π/8 π/2
π/8 π/4 3π/8 π/2
A
B
1A
2A 3A
4A 5A
6A 7A
8A
1B 2B 3B 4B
5B
6B7B 8B
φ2
φ3
0 π/8 π/4 3π/8 π/2
π/8 π/4 3π/8 π/2
(b) Song 2 -7Ais the only mix in this study which has more nearest neighbours from the other source.
A B
1A 2A
3A 4A
5A 6A
7A 8A
1B 2B
3B
4B 5B
6B 7B
8B
φ2
φ1
0 π/8 π/4 3π/8 π/2
π/8 π/4 3π/8 π/2
A
B
1A 2A
3A 4A 5A 6A
7A 8A
1B 2B 3B
4B 5B
6B 7B
8B
φ2
φ3
0 π/8 π/4 3π/8 π/2
π/8 π/4 3π/8 π/2
[image:7.595.113.488.50.220.2](c) Song 3 - distinct cluster of mixes formed of those which started from source A
Figure 6: Positions of sources and final mixes in the mix-space. Source-directivity is indicated by added vectors.
the source positions within the mix-space, marked ‘A’ and ‘B’. The initial vectors are also shown, indicating the direc-tion and step size of the first changes to the mix. None of the sources can be considered omnidirectional, as certain mix-decisions are more likely than others. This directivity indicates that the source position has an immediate influ-ence on mixing decisions.
5.3 Mix-space navigation
Fig. 7 shows the probability density function (PDF) of
φn,twhen averaged over the eight mixers depicted in Fig.
[image:7.595.112.489.440.627.2]0 0.02 0.04 0.06 0.08 0.1
PDF of φ1
probability
0 π/8 π/4 3π/8 π/2
A B A B 0 0.02 0.04 0.06 0.08 0.1
PDF of φ2
probability
0 π/8 π/4 3π/8 π/2
A B 0 0.02 0.04 0.06 0.08 0.1
PDF of φ3
probability
0 π/8 π/4 3π/8 π/2
A B (a) Song1 0 0.02 0.04 0.06 0.08 0.1
PDF of φ1
probability
0 π/8 π/4 3π/8 π/2
A B A B 0 0.02 0.04 0.06 0.08 0.1
PDF of φ2
probability
0 π/8 π/4 3π/8 π/2
A B 0 0.02 0.04 0.06 0.08 0.1
PDF of φ3
probability
0 π/8 π/4 3π/8 π/2
A B (b) Song2 0 0.02 0.04 0.06 0.08 0.1
PDF of φ1
probability
0 π/8 π/4 3π/8 π/2
A B A B 0 0.02 0.04 0.06 0.08 0.1
PDF of φ2
probability
0 π/8 π/4 3π/8 π/2
A B 0 0.02 0.04 0.06 0.08 0.1
PDF of φ3
probability
0 π/8 π/4 3π/8 π/2
A B
[image:8.595.56.541.60.314.2](c) Song3
Figure 7: Estimated probability density functions ofφterms, for each of the three songs, averaged over all mixers. Sources positions are highlighted with AandB. As the functions often differ it can be seen that exploration of the mix-space is dependant on initial conditions.
which the participants spent most time listening to and it is seen that all distributions are multi-modal. There are peaks close to the initial positions, the final positions and other interim positions that were evaluated during the mix-ing process. There are a number of different approaches to multitrack mixing of pop and rock music, one of which is to start with one instrument (such as drums or vocals) and build the mix around this by introducing additional el-ements. Some participants were observed mixing in this fashion, shown in Fig. 7, where peaks at extreme values of
φn show that instruments were attenuated as much as the
constraints of the experiment would allow.
For Song 1, φ1 is well balanced and centered close to
π/4. This indicates that mixers tended to listen in states where the relative loudness of the vocal and backing track were similar. A similar pattern is observed for Song 2, whereφ3, shows that the level of drum and bass tend to
be adjusted such that the tracks have similar loudness (Ta-ble 1 shows the median loudness difference within final mixes was <1dB). The distributions ofφ2 indicates that
the guitar was often set to be of lower loudness than the rhythm section, as also shown in Table 1.
There are notable differences due to the source. The dis-tributions for Song 2 suggest that exploration depended on the initial source configuration, with Source A leading to louder vocals and louder guitar than Source B. However, for Song 2, the distributions of φ terms are similar for both source positions, simply offset. This suggests that, while different regions of the mix-space were explored, they were explored in a similar fashion.
Overall, for Song 3, the distributions in Fig. 7, the
me-dian balances in Fig. 5c and the clustering of final positions shown in Fig. 6c indicate that mixers were more consistent with this song than others. This may be due to the tracks representing processed stems of a full mix, where the inter-channel balances in these stems, subject to dynamic range compression as well as the relative level of reverberation and other effects, may have provided clues as to how the groups were balanced in that final mix from which stems were obtained. This further suggests that the more prior work that has been put into the mix, the less likely subse-quent mixers are to explore the entire mix-space.
Since this experiment gathered data for only three songs, the results should be considered as specific rather than gen-eral. It is not known at this time how many songs would need to be studied to be able to generalise to mixing as a whole, however, these three songs are considered to be typical, due to their conventional instrumentation.
5.4 Application of results
In automatic fader control, rather than aiming for equal loudness across all instruments, the preferred balances be-tween semantic pairings of instruments, shown in Fig. 5d, could be used as the target for optimisation. This would require the unsupervised clustering of audio tracks into semantically-linked instrument groups, a task which is cur-rently an active area of research [16–18].
experiment outlined in this paper could be used to train an intelligent mixing system to produce a number of al-ternate mixes which the user could select from, in order to further train the system. Further information regarding mixing style can be found from the data. For example, the probability density function of mix-velocity could differ-entiate between mixers who mixed using either careful ad-justment of the faders towards a clear goal or by alternating large displacements with fine-tuning. Knowing the distri-bution of step size used by human mixers will aid optimi-sation of search strategies in intelligent mixing systems.
6. CONCLUSIONS
For a level-balancing task, a mix-space has been defined using the gains of each track. A number of features of the space have been presented and an experiment was per-formed in order to investigate how mix engineers explore this space for a four track mixture of modern popular music.
From these early results it has been observed that each source has a directivity that is not equal in all directions, i.e. that not all possible first decisions in the mix process are equally likely. For each song there are varying degrees of clustering of final mixes and it is seen that the final mix is dependant on the initial conditions. The exploration of the space is also dependant on the initial conditions. This experiment has indicated a certain level of agreement be-tween participants regarding the ideal balances bebe-tween groups of instruments, although this varies according to the song in question.
Ultimately, the theory presented here could be expanded to include other mix parameters. Since panning, equali-sation and dynamic range compression/expansion are each an extension to the track gain (either channel-dependant, frequency-dependant or signal-dependant), it should be pos-sible to add these parameters to the existing framework.
7. REFERENCES
[1] M. Terrell, A. Simpson, and M. Sandler, “The Math-ematics of Mixing,”Journal of the Audio Engineering Society, vol. 62, no. 1, 2014.
[2] “ISO 9000:2005 Quality management systems – Fun-damentals and vocabulary,” 2009, http://www.iso.org/ iso/catalogue detail?csnumber=42180.
[3] R. King, B. Leonard, and G. Sikora, “Consistency of balance preferences in three musical genres,” inAudio
Engineering Society Convention 133, San Francisco,
USA, October 2012.
[4] ——, “Variance in level preference of balance engi-neers: A study of mixing preference and variance over time,” inAudio Engineering Society Convention 129. San Francisco, USA: Audio Engineering Society, Nov 2010.
[5] E. Perez-Gonzalez and J. Reiss, “Automatic gain and fader control for live mixing,” in IEEE Workshop on Applications of Signal Processing to Audio and
Acous-tics, 2009. WASPAA’09. IEEE, 2009, pp. 1–4.
[6] S. Mansbridge, S. Finn, and J. D. Reiss, “Imple-mentation and evaluation of autonomous multi-track fader control,” inAudio Engineering Society Conven-tion 132, Budapest, Hungary, April 2012.
[7] P. Pestana and J. D. Reiss, “Intelligent Audio Produc-tion Strategies Informed by Best Practices,” in AES 53rd International Conference: Semantic Audio, Lon-don, UK, January 2014, pp. 1–9.
[8] J. Reiss and B. De Man, “A semantic approach to au-tonomous mixing,”Journal on the Art of Record Pro-duction, vol. Issue 8, Dec. 2013.
[9] E. Deruty, F. Pachet, and P. Roy, “Human-Made Rock Mixes Feature Tight Relations Between Spectrum and Loudness,”Journal of the Audio Engineering Society, vol. 62, no. 10, pp. 643–653, 2014.
[10] B. De Man, B. Leonard, R. King, and J. Reiss, “An analysis and evaluation of audio features for multitrack music mixtures,” inISMIR, Taipei, Taiwan, October 2014, pp. 137–142.
[11] M. Cartwright, B. Pardo, and J. Reiss, “Mixploration: rethinking the audio mixer interface,” inInternational Conference on Intelligent User Interfaces, Haifa, Is-rael, February 2014.
[12] A. Wilson and B. Fazenda, “Perception & evaluation of audio quality in music production,” inProc. of the 16th Int. Conference on Digital Audio Effects (DAFx-13), Maynooth, Ireland, 2013, pp. 1–6.
[13] ——, “Characterisation of distortion profiles in rela-tion to audio quality,” inProc. of the 17th Int. Con-ference on Digital Audio Effects (DAFx-14), Erlangen, Germany, 2014, pp. 1–6.
[14] P. D. Pestana, J. D. Reiss, and A. Barbosa, “Loudness measurement of multitrack audio content using modifi-cations of itu-r bs. 1770,” inAudio Engineering Society Convention 134, Rome, Italy, May 2013.
[15] R. L. King, B. Leonard, and G. Sikora, “Loudspeak-ers and headphones: The effects of playback systems on listening test subjects,” in Proc. of the 2013 Int. Congress on Acoustics, Montr´eal, Canada, June 2013.
[16] S. Essid, G. Richard, and B. David, “Musical instru-ment recognition by pairwise classification strategies,”
Audio, Speech, and Language Processing, IEEE Trans-actions on, vol. 14, no. 4, pp. 1401–1412, 2006.
[17] V. Arora and L. Behera, “Musical source clustering and identification in polyphonic audio,”IEEE/ACM Trans.
Audio, Speech and Lang. Proc., vol. 22, no. 6, pp.
1003–1012, Jun. 2014.