International Journal of Emerging Technology and Advanced Engineering
Website: www.ijetae.com (ISSN 2250-2459,ISO 9001:2008 Certified Journal, Volume 5, Issue 4, April 2015)
192
Simulation and Validation of Spread Spectrum Technique in
In-Orbit Testing of the Satellite Transponder
Gyanendra Kumar Mishra
1, Anil Mishra
2, Sarala Singh
3 1M.Tech student J.N.C.T, Rewa, (M.P.), India
2,3Asst. Prof., Dept. of E&C, J.N.C.T, Rewa, (M.P.), India
Abstract--In order to evaluate the integrity of a satellite transponder, it is necessary to measure its characteristics (i.e. frequency response) and the characteristics of its high power amplifier (HPA), such as sensitivity and saturated output power. Since these properties are subject to aging and the satellite itself suffers from the vibration shocks during launch hence performance of these components have to be monitored to guarantee that they still meet the initial specifications. Satellite in-orbit testing is a very necessary task in order to be able to predict possible malfunctioning of the transponders.
Keywords-- Conventional Systems, Spread Spectrum Signal, Concepts, Principle, Pseudo noise modulation, Methodology, Results & Discussions, Conclusion, References.
I. INTRODUCTION
The core part of a satellite is the transponder, which receives signals from a ground station and retransmits them to the users. The signals can be FM analog video or quadrature phase shift keying (QPSK) modulated digital video broadcast-satellite (DVB-S) signals or any other kind of data used in point-to-multipoint applications.
Fig.1 Signal Chain Of A Satellite Transponder
There are two main applications for transponder in-orbit testing which are beginning-of-life and in-service testing.
The use of a spread spectrum measurement system allows measuring with very low spectral density signals without interfering on the neighboring satellite or on the transponder occupying payload.
Here the transmission power of the measurement signal can be about 30dB less than that in the conventional systems case and hence the satellite transmitted measurement signal is below the noise level and does not influence the other user signal(i.e. DTH). Since the measurements are less disturbing for the commercial transponder operation, hence costs are reduced.
The integrity of a satellite transponder is measured by its characteristics (frequency response, for example) and the characteristics of its high power amplifier (HPA), such as sensitivity and saturated output power. After the launch, these properties have to be measured in a beginning-of-life test, and since they are subject to aging, they have to be monitored regularly throughout the operation of the system to guarantee that they still meet the initial specifications.
There are two main applications for transponder in-orbit testing which are beginning-of-Life and in-service testing. A signal that passes through a satellite transponder is first received and amplified in a low noise amplifier (LNA) at the satellite receive antenna and then frequency converted in the receiver. Each modulated carrier has its own high power amplifier (HPA).
The HPA is usually a traveling wave tube amplifier (TWTA). As the HPA usually operates in its nonlinear saturation region, it can only amplify a single signal in order to avoid distortion of the output signal due to inter modulation products. The amplifier output is then band pass filtered (OMUX Filter) again in order to prevent the transmission of broadband noise from the HPA and is then combined with the other amplified signals in the transmit antenna.
International Journal of Emerging Technology and Advanced Engineering
Website: www.ijetae.com (ISSN 2250-2459,ISO 9001:2008 Certified Journal, Volume 5, Issue 4, April 2015)
193
The group delay τg is determined by differentiating the measured phase [Φ] with respect to frequency and is given by
τg = -(1/2π)dΦ/df
This is the basic relationship between the phase and group delay of an electromagnetic signal.
Conventional Systems:
Fig.1.1 Interference Due To Conventional Measurement Systems During IOT
The conventional system needs a positive and sufficient signal-to-noise ratio to measure amplitude and phase. Therefore the payload on the satellite transponder has to be switched off, as the measurement signal would disturb the video or data signal. This is an important loss of efficiency in operation of the satellite.
Another drawback of the conventional systems measurement is its inaccuracy due to amplitude-phase conversion (AM-PM) in the case of a high level measurement signal fed through a filter into a nonlinear amplifier. furthermore, the conventional system using frequency modulated signal has a high spectral density, which may under certain circumstances, lead to interference with the adjacent satellite system and can degrade the quality of the other user signal.
1.2. System With Spread Spectrum Signal:
The application of spread spectrum signals helps to overcome most of the problems occurring with conventional systems. In spread-spectrum system once the measurement carrier is modulated with a pseudo noise(PN) signal, the required signal level is much lower compared with the conventional measurement system. The measurement can also be performed without switching off the transponder payload.
As a PN signal has a very sharp autocorrelation at zero delay, it can be detected by correlation of the returned measurement signal with the known PN sequence.
Fig.1.2 Spread Spectrum In-Orbit Test Measurement
Using spread spectrum measurement technique of an occupied transponder, the channel frequency response is measured under real operation conditions where as the conventional measurement system may not achieve this realistic conditions, for instance, the filters might not be heated up uniformly by the conventional measurement signal since it used to be a narrow band frequency modulated carrier with a different spectral density. As a result of the low power level of the measurement signal, the disturbance of the other channel is minimized in beginning-of- life tests as well as during in-service testing.
II. CONCEPTS
International Journal of Emerging Technology and Advanced Engineering
Website: www.ijetae.com (ISSN 2250-2459,ISO 9001:2008 Certified Journal, Volume 5, Issue 4, April 2015)
194
2.1. Principle:
Spread spectrum communication is a technique of expanding the bandwidth of a signal, transmitting that expanded signal and remapping the received spread spectrum signal into the original information signal.
In a spread spectrum system, the transmitted waveform occupies a bandwidth far exceeding that of input/output base band signal. The transmitted waveform bandwidth is not greatly dependent upon the input/output base band signal, but is primarily determined by an auxiliary signal which is known in advance to the transmitter and all intended receivers.
The ratio of the transmitted spread bandwidth to the information bandwidth is known as “processing gain” which is the figure of merit and conveys a rough estimate of the performance of the system.
For satellite applications, spread spectrum technique yields conceptually a simple solution to the requirement of lowering the radio frequency interference of one user by another.
2.2. Pseudo noise modulation:
A sequence of ones and zeros with certain statistical properties that is known in the transmitter and receiver but that looks like a random sequence is called a pseudo noise sequence. Once a measurement signal is phase modulated with a PN sequence, it is possible to detect the measurement signal from a noisy environment, even with negative carrier to noise (C/N) Values. This is because the PN sequence has a single, unambiguous peak in its autocorrelation function. By demodulating the received superposition of measurement signal and noise with the known PN sequence, it is possible to lock on the measurement signal even if it is 30 dB below the noise level.
PN Sequences are generated using feedback shift registers. They are categorized depending on their length and statistical properties. An infinite length PN sequence has a triangular autocorrelation function.
Triangular-shaped autocorrelation functions are optimal for signal detection. Hence a finite PN sequence is optimized with regard to its autocorrelation function being as close to a triangular shape as possible.
Fig.2.2 Observed Auto Correlation Peak During Simulation
Maximum length PN sequences are PN sequences with one main autocorrelation peak and the side peaks suppressed. They ensure a high processing gain when they are used for the transmission of a measurement signal because the probability of the Delay lock loop (used for the demodulation) locking on a side lobe instead of the main peak is minimized. Once a clean carrier measurement signal is modulated with a PN sequence, its spectrum will no longer be a single peak but a spreaded sin(x)/x-like spectrum. The power of the carrier wave is spread over a lager frequency region. The width of the PN modulated signal in the frequency region depends on the chip rate and the larger the chip rate the wider the spectrum of the modulated signal.
III. METHODOLOGY
International Journal of Emerging Technology and Advanced Engineering
Website: www.ijetae.com (ISSN 2250-2459,ISO 9001:2008 Certified Journal, Volume 5, Issue 4, April 2015)
[image:4.612.50.301.117.315.2]195
Fig.3 Illustrating the Concept
Let the transmitted signal be x (t), then the returned signal r (t) may be
Modeled as:
r(t) = αx(t - D) + w(t)
Where, w (t) is assumed to be the additive noise during the transmission.
Is the attenuation factor (<1).
D is the delay which is the time taken for the signal to travel from the transmitter to the target and back to the receiver.
A common method of estimating the time delay D is to compute the cross-correlation function of the received signal with the transmitted signal x (t). i.e.
Rrx(τ) = E{r(t)x(t+τ)}
= E{[αx(t-D)+w(t)][x(t+ τ)]} = E{αx(t-D)x(t+ τ)+w(t)x(t+ τ)} Hence,
Rrx(τ) = αRxx(τ-D)+Rwx(τ)
Note, „E‟ is the expectation operator. Therefore, the cross correlation is equal to the sum of the
scaled autocorrelation function of the transmitted signal and the cross correlation function between x(t) and the contaminated noise signal w(t). If we now assume that the noise signal w (t) and the transmitted signal x (t) are uncorrelated then,
Rwx(τ) = 0
Hence the cross-correlation function between the transmitted signal and the received signal may be written as:
Rrx(τ) = αRxx(τ-D)
[image:4.612.319.590.198.321.2]Therefore if we plot it will only have one peak value that will occur at τ = D.
Fig.3.1 Shifted Correlation Peak
IV. RESULTS &DISCUSSIONS
Simulink is used for the simulations and the feasibility of the technique has been verified. Simulations performed in sequential manure and the applicability of the technique is verified.
1.) A simple spread spectrum model was constructed and the property of the autocorrelation peak at zero delay is verified.
[image:4.612.325.585.449.640.2]International Journal of Emerging Technology and Advanced Engineering
Website: www.ijetae.com (ISSN 2250-2459,ISO 9001:2008 Certified Journal, Volume 5, Issue 4, April 2015)
[image:5.612.48.306.131.272.2]196
Figure 4.1 Autocorrelation Peak at Zero Delay
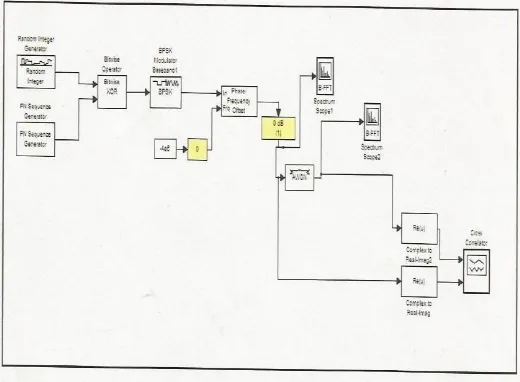
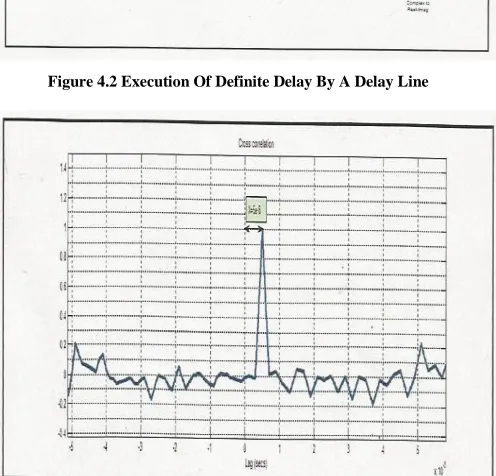
[image:5.612.273.576.256.708.2]2.) Some amount of known delay (40 samples) is introduced in the model and the corresponding shift has been observed which shows the applicability of the technique for the delay measurement.
[image:5.612.325.588.272.496.2]Figure 4.2 Execution Of Definite Delay By A Delay Line
Figure 4.3 Observed Shift In The Autocorrelation Peak
Here spreading bandwidth=1MHz Shift in the output peak=5×10^-6 Secs
Calculated dealy=1×10^6×8×5×10^-6=40 Samples Hence result shows the accuracy of the technique.
3.) Delay performance of a raised cosine transmit filter has also been verified. Here sampling time for the PN sequence generator was taken as 5MHz.A delay of 10 sample was introduced through the filter and the shift noticed was 2×10^-6 that comes out to be 10 samples (2×5×10^6×2×10^-6), which is the correctly measured delay.
Fig.4.4 Spread spectrum system with raised cosine filter
[image:5.612.49.300.349.477.2] [image:5.612.49.297.452.690.2]International Journal of Emerging Technology and Advanced Engineering
Website: www.ijetae.com (ISSN 2250-2459,ISO 9001:2008 Certified Journal, Volume 5, Issue 4, April 2015)
197
4.) Overall accuracy of the system has been verified by observing bit error rate degradation of an operating data signal with measurement signal.
Fig.4.6 A typical signal transmission system
Fig.4.7 Inclusion of Spread spectrum system
The observed bit error rate with the inclusion of the spread spectrum system is 6.6×10^-7 for a definite time period that shows the applicability of the spread spectrum measurement system for the in-service characterization of the transponder without much intruding the data signal.
5.) Finally a band pass filter was taken and analyzed with the system mentioned above and a good in band phase response is observed.
International Journal of Emerging Technology and Advanced Engineering
Website: www.ijetae.com (ISSN 2250-2459,ISO 9001:2008 Certified Journal, Volume 5, Issue 4, April 2015)
198
V. CONCLUSION
Study of Conventional in-orbit measurement system and Spread spectrum measurement system is performed. Spread spectrum measurement system is modeled in Simulink and performance of the system is analyzed. Based on simulation results following conclusion has been made :
The applicability of the technique has been verified through basic modeling in simulink.
Intrusion of low bit error rate shows the feasibility of the spread spectrum technique for the in-service characterization of the satellite transponder.
Characterization of a band pass filter was sought, for which group delay response has been drawn that shows good agreement with the ideal response of the filter but at the band edges smearing out of the response has been observed that requires post processing work, for the response to be consistent and can be taken as a topic for future study.
The validation of Spread spectrum technique has been checked in in-orbit testing of satellite transponder. This technique is valid for satellite communication and this is also applied for other communication like cellular and mobile communication
VI. FUTURE SCOPE OF THE WORK
This method can also be extended for the determination of antenna patterns, gain transfer characteristics, gain to noise temperature (G/T) etc which needs further study of the topic.
REFERENCES
[1] T.K. Ostmann And G.Harles “A New Spread Spectrum Measurement Method For The Satellite Transponder In-Orbit Testing,” Microwave Journal, August2007.
[2] J.K. Holmes, Coherent Spread-Spectrum Systems, Krieger Publishing Co.,FL1960.
[3] R.C. Dixon, Spread Spectrum System With Commercial Applications, Wiley Sons,NT,1994.
[4] Brij N. Agarwal ,Geosynchronous Spacecraft System.
[5] C. Emmert, V. Riginos, and J. Potukuchi, "In-Orbit Measurements of the SBS Satellite," presented at the The AIAA 9th Communications Satellite Systems Conference, San Diego, California, March 7-11, 1982, Conference Record, pp. 167-173.
[6] I. Dostis, C. Mahle, V. Riginos, and I. Atohoun, "In-Orbit Testing of Communications Satellites," COMSAT Technical Review, Vol.7, No. 1, Spring 1977, pp. 197-226
[7] K. Fullett, B. Kasstan, W. Kelley, V. Riginos, P-H. Shen, S. Teller, Y. Tharaud, "The EUTELSAT In-Orbit Test System," COMSAT Technical Review, Vol. 23, Fall 1993.