International Journal of Emerging Technology and Advanced Engineering
Website: www.ijetae.com (ISSN 2250-2459, ISO 9001:2008 Certified Journal, Volume 9, Issue 11, November 2019)
51
Design Problems on the Building Construction Sites by Using
Frequency Analysis
Vijay Singh Rawat
1,
Daniel Dibaba Awayo
21School of Civil Engineering & Architecture, Adama Science and technology university, Adama, Ethiopia
2
School of Civil Engineering & Architecture, Addis Ababa Science and technology university, Ethiopia
Abstract— In the construction industry, construction defects and failures can occur during the design phases of a project, or after a structure is substantially complete. A design defect is typically the result of the design professional’s failure to produce a complete, accurate and well-coordinated set of design and construction documents.
This research assesses and investigates the design-related problems in the building construction projects of Assosa University. The aims of the research are to examine factors leading to design-related problems and to plan effectively at the design phase by creating awareness and paying enough attention to minimize the problems and carry out works appropriately during the construction phase. Ten different factors each causing construction defects and design-related problems. Then all factors were analyzed according to their frequency of response and average index.
Therefore, it is possible to eliminate extra costs incurred to make corrective actions to amend the defective design a descriptive discussion was made to each collected data. It was found that all identified factors in each category would cause corresponding problems with varying degrees of importance. Comparatively, some factors have been found to have a higher degree of importance with a relatively higher average index value. After analysis of data and result discussions, the focuses of this study have been established as a framework for the development of constructability principles and presented in-depth in the distinct chapter of the research. Finally, a conclusion has been drawn on the basis of results and findings achieved so far. Then sets of recommendations and actions to be taken by each responsible sector were presented.
Keywords—design-related-problems, constructability principles, design deficiencies, poor workmanship
I. INTRODUCTION
The construction industry in Ethiopia as in any other countries is one of the driving forces of the nation‘s economy. Many other sectors and industries are dependent on the performance of construction industries. Construction projects represent a unique set of activities that must take place to produce a unique product. The successful completion of a construction project requires a thorough understanding of all stages and phases of the project and can be enhanced through the integration of design during each stage of construction.
Accordingly, this research investigates the most prevailing problems related to the design of the building at the construction sites of Assosa University. The major triggering causes and factors contributing to the problems in the construction industry are defects associated with design, workmanship, material, and maintenance. This study is expected to find out design related problems that are encountered on the specified construction sites. The research aims to investigate workmanship quality performance of construction projects referring to a number of defects occurred for the newly completed building. Based on a combination of literature review and questionnaire surveys, this paper explores the factors contribute to poor workmanship and possible measures to minimize the problem, and also the relationship between measures identified with the factors.
II. METHODOLOGICAL APPROACH OF THE STUDY
In pursuance of the aim and objectives, this chapter discusses in broader the research methodology adopted in the study. It presents the methodological approach of the research that entails the research approach. It comprises limitations of the research, the detail sections that describe how data were collected, the questionnaire survey was made, interviews were conducted and a detailed process of how the analysis of the data was made.
A. Approach
This research is mainly a quantitative type of research by which the objective of measurement of the problem is to investigate facts and tries to establish relationships using statistical tools. The research used two methods of data analysis, descriptive and statistical analysis. There are different methods of statistical analysis used for analyzing quantitative data. The analysis method used in this research was the average index method and excel sheet. The details of the analysis methods have been presented in the section follows.
International Journal of Emerging Technology and Advanced Engineering
Website: www.ijetae.com (ISSN 2250-2459, ISO 9001:2008 Certified Journal, Volume 9, Issue 11, November 2019)
52
Accordingly, the research targeted to look into all the companies located in the study area. All data collection methods were specific and targeted to the problem identified, assessment of design-related problems.
B. Data collection
The data collection approach adopted for conducting this research includes both primary and secondary sources. The questionnaire, interview, and desk study provide the primary data for this research while the secondary data sources include journals, internet sources, as well as reviewing related archival documents. These different methods of data collection have been used in order that the data or information obtained from one can be supplemented by the others whereby the collected data will give multiple pieces of evidence and facts.
C. Analysis
This research followed mainly two methods of data analysis, quantitative and descriptive analysis. A descriptive method has been used for the analysis of the data which provides a general overview of the results in order that some kind of interpretations and discussions can be made on the results. Data and opinions found from the interview and desk study have been interpreted and discussions were made based on the descriptive type of data analysis. The statistical method of data analysis was used for questionnaire analysis.
For the purpose of analysis of data collected through the closed questionnaire, statistical packages for social science (SPSS), version 7.5 has been used. The questionnaire data were inputted into the SPSS program. An Excel sheet has been used for computing the frequency analysis and average index that had been further used as input data for the SPSS model. In analyzing data, the importance attached to each question has been considered as the response values as the rate of importance that causes design-related problems and construction defects in the building construction industry. The assumed values are as described below based on their importance on causing the problems
Note: in the questionnaire form, ‗high‘ designated by the
scale ‗5‘ refers to ‗very important‘ in causing the problem and ‗low‘ designated by the scale ‗1‘ refers to ‗not important‘ in causing the problem.
1= not important 2= less important 3= moderately important 4= important
5= very important
For summarizing of the collected data and to determine the number of responses belonging to each category, frequency tables and charts have been used.
The data collected from the closed questionnaire on the causes of designed-related problems and construction defects were tabulated based on the number of responses for each category of the degree of importance. Based on the frequency analysis the average index was then calculated to determine the ranking of each of the causes of design-related problems and construction defects.The average index is calculated as follows:
Average Index = ∑aixi / ∑xi
Where a=constant expressing the weight given to i
x=variable expressing the frequency of response for i=1, 2,3,4,5
Based on the assumed values stated earlier,
x1=frequency of the ―not important‖ and corresponding to a1=1, x2=frequency of the ―less important‖ and corresponding to a2=2, x3=frequency of the ―moderately important‖ and corresponding to a3=3, x4=frequency of the ―important‖ and corresponding to a4=4, and x5=frequency of the ―very important‖ and corresponding to as=5.
In ordered to determine the degree of importance of the causes of design-related problems and construction defects in this study, the classification of the rating scales proposed by Abd.Majid (1997) has been used. The classifications of the rating scales are as follows:
Classifications Rating Scales
Not important 0.00 < Average Index < 0.50 Less Important 0.50 < Average Index < 1.50 Moderately Important 1.50 < Average Index < 2.50
Important 2.50 < Average Index < 3.50 Very Important 3.50 < Average Index < 5.00
III. QUESTIONNAIRE ANALYSIS AND RESULT
10 well-recognized causes of design-related problems were identified and provided in the questionnaire form. Determining the degree of importance of each cause was sought as it leads to the main objectives of this survey.
International Journal of Emerging Technology and Advanced Engineering
Website: www.ijetae.com (ISSN 2250-2459, ISO 9001:2008 Certified Journal, Volume 9, Issue 11, November 2019)
[image:3.612.64.315.137.492.2]53
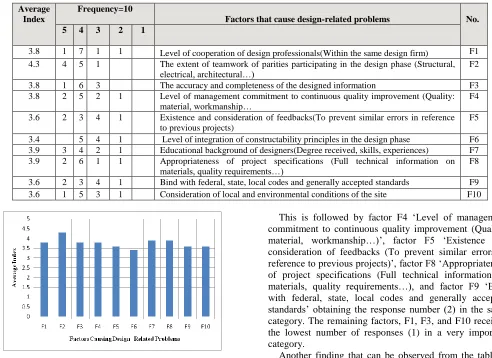
Table 1:
Contractors’ response distribution and average index
No. Factors that cause design-related problems
Frequency=10 Average
Index
1 2 3 4 5
F1 Level of cooperation of design professionals(Within the same design firm)
1 1 7 1 3.8
F2 The extent of teamwork of parities participating in the design phase (Structural, electrical, architectural…)
1 5 4 4.3
F3 The accuracy and completeness of the designed information
3 6 1 3.8
F4 Level of management commitment to continuous quality improvement (Quality: material, workmanship…
1 2 5 2 3.8
F5 Existence and consideration of feedbacks(To prevent similar errors in reference to previous projects)
1 4 3 2 3.6
F6 Level of integration of constructability principles in the design phase
1 4 5 3.4
F7 Educational background of designers(Degree received, skills, experiences)
1 2 4 3 3.9
F8 Appropriateness of project specifications (Full technical information on materials, quality requirements…)
1 1 6 2 3.9
F9 Bind with federal, state, local codes and generally accepted standards
1 4 3 2 3.6
F10 Consideration of local and environmental conditions of the site
[image:3.612.56.548.142.500.2]1 3 5 1 3.6
Figure 1: Bar chart representing Contractors’ response distribution and average index
Table 6 presents the response of the contractors expressed as frequencies and the average index for each of the factors that cause design-related problems. It can be seen for each factor that the combined number of responses in the important and very important columns is 5 and greater, which is more than half of the respondents. This indicates that the majority of the respondents consider factors F1 to F10 to be either important or very important. Factor F2 ‗Extent of teamwork of parities participating in the design phase (Structural, electrical, architectural…)‘ have the highest number of responses (4) in the very important column. The factor F7 ‗Educational background of designers (Degree received, skills, experiences…)‘ obtained the second-highest number of responses (3) in the same category.
This is followed by factor F4 ‗Level of management commitment to continuous quality improvement (Quality: material, workmanship…)‘, factor F5 ‗Existence and consideration of feedbacks (To prevent similar errors in reference to previous projects)‘, factor F8 ‗Appropriateness of project specifications (Full technical information on materials, quality requirements…), and factor F9 ‗Bind with federal, state, local codes and generally accepted standards‘ obtaining the response number (2) in the same category. The remaining factors, F1, F3, and F10 received the lowest number of responses (1) in a very important category.
International Journal of Emerging Technology and Advanced Engineering
Website: www.ijetae.com (ISSN 2250-2459, ISO 9001:2008 Certified Journal, Volume 9, Issue 11, November 2019)
[image:4.612.65.545.139.577.2]54
Table 2:
Consultants’ response distribution and average index
No. Factors that cause design-related problems
Frequency=2 Average
Index
1 2 3 4 5
F1 Level of cooperation of design professionals(Within the same design firm)
1 1 3.5
F2 The extent of teamwork of parities participating in the design phase (Structural, electrical, architectural…)
1 1 4.5
F3 The accuracy and completeness of the designed information
2 4
F4 Level of management commitment to continuous quality improvement (Quality: material, workmanship…)
1 1 4.5
F5 Existence and consideration of feedbacks(To prevent similar errors in reference to previous projects)
1 1
4
F6 Level of integration of constructability principles in the design phase
1 1 4.5
F7 Educational background of designers(Degree received, skills, experiences)
2 4
F8 Appropriateness of project specifications (Full technical information on materials, quality requirements…)
1 1 4.5
F9 Bind with federal, state, local codes and generally accepted standards
1 1
3.5
F10 Consideration of local and environmental conditions of the site
1 1
3.5
Figure 2: Bar chart representing Contractors’ response distribution and average index
Table 7 presents the response of consultants expressed as frequencies and the average index for each of the factors that cause design-related problems. It can also be seen here that for each factor the combined number of responses in the important and very important column is 1 and greater, which is half or more than half of the respondents.
This indicates that the majority of the respondents consider factors F1 to F10 to be either important or very important. Except for the factors F1, F3, and F7, all the factors received a half number of responses (1) in the very important column.
This reveals that the respondents strongly agree by the prescribed factors in causing the design-related problems if not appropriately addressed and managed. We can see in the above table the factor F9 ‗Bind with federal, state, local codes and generally accepted standards‘ and factor F10 ‗Consideration of local and environmental conditions of the site‘ received half number of responses in the less important column. It can be understood here that half of the consultants have a low opinion on those factors in causing the design-related problems.
Referring to the average index column it can be seen that the average indexes of all the factors are equals to 3.5 and above.
[image:4.612.68.320.148.564.2]International Journal of Emerging Technology and Advanced Engineering
Website: www.ijetae.com (ISSN 2250-2459, ISO 9001:2008 Certified Journal, Volume 9, Issue 11, November 2019)
[image:5.612.71.422.140.521.2]55
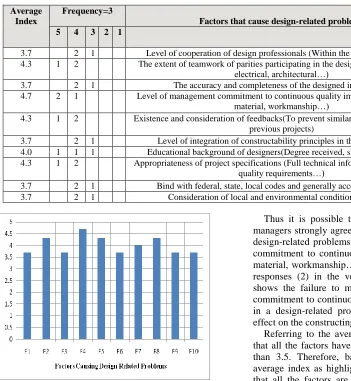
Table 3:
Project managers’ response distribution and average index
No. Factors that cause design-related problems
Frequency=3 Average
Index
1 2 3 4 5
F1 Level of cooperation of design professionals (Within the same design firm)
1 2 3.7
F2 The extent of teamwork of parities participating in the design phase (Structural,
electrical, architectural…) 2
1 4.3
F3 The accuracy and completeness of the designed information
1 2 3.7
F4 Level of management commitment to continuous quality improvement (Quality:
material, workmanship…) 1
2 4.7
F5 Existence and consideration of feedbacks(To prevent similar errors in reference to
previous projects) 2
1 4.3
F6 Level of integration of constructability principles in the design phase
1 2 3.7
F7 Educational background of designers(Degree received, skills, experiences)
1 1 1 4.0
F8 Appropriateness of project specifications (Full technical information on materials,
quality requirements…) 2
1 4.3
F9 Bind with federal, state, local codes and generally accepted standards
1 2 3.7
F10 Consideration of local and environmental conditions of the site
1 2 3.7
Figure 3: Bar chart representing Contractors’ response distribution and average index
Table 8 presents the response of project managers expressed as frequencies and average index for each factor that causes design-related problems. It can be seen in the table that for each factor the combined number of responses in the important and very important column is 2 and above, which is more than half of the respondents.
Thus it is possible to say the majority of the project managers strongly agree with all the factors in causing the design-related problems. Factor F4 ‗Level of management commitment to continuous quality improvement (Quality: material, workmanship…)‘ received the highest number of responses (2) in the very important column. The result shows the failure to meet a good level of management commitment to continuous quality improvement will result in a design-related problem that further has an adverse effect on the constructing party.
International Journal of Emerging Technology and Advanced Engineering
Website: www.ijetae.com (ISSN 2250-2459, ISO 9001:2008 Certified Journal, Volume 9, Issue 11, November 2019)
[image:6.612.54.326.136.567.2]56
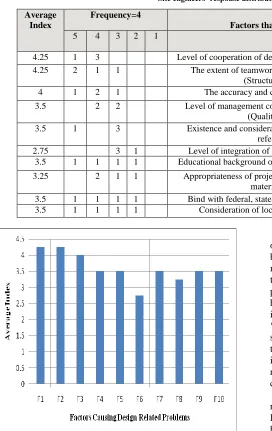
Table 4:
Site engineers’ response distribution and average index
No. Factors that cause design-related problems
Frequency=4 Average
Index
1 2 3 4 5
F1 Level of cooperation of design professionals (Within the same design firm) 3
1 4.25
F2 The extent of teamwork of parities participating in the design phase
(Structural, electrical, architectural…) 1
1 2 4.25
F3 The accuracy and completeness of the designed information
1 2 1 4
F4 Level of management commitment to continuous quality improvement
(Quality: material, workmanship…) 2
2 3.5
F5 Existence and consideration of feedbacks(To prevent similar errors in
reference to previous projects) 3
1 3.5
F6 Level of integration of constructability principles in the design phase
1 3 2.75
F7 Educational background of designers(Degree received, skills, experiences) 1
1 1 1 3.5
F8 Appropriateness of project specifications (Full technical information on
materials, quality requirements…) 1
1 2 3.25
F9 Bind with federal, state, local codes and generally accepted standards
1 1 1 1 3.5
F10 Consideration of local and environmental conditions of the site
1 1 1 1 3.5
Figure 4: Bar chart representing Contractors’ response distribution and average index
Table 9 presents the response of site engineers‘ expressed as frequencies and average index for each factor that causes design-related problems. It can be seen in the table that for each factor except factor F5 ‗Existence and consideration of feedbacks (To prevent similar errors in reference to previous projects)‘ the combined number of responses in the important and very important column is equals to 2 and above.
Since about half of the respondents admit the importance of the factors in causing the problem, one needs to strictly bind to the factors during the design phase in order to minimize the design-related problems that occur thereby. In the table above factor F1 ‗Level of cooperation of design professionals (Within the same design firm)‘ received the highest combined number of response (full response) in the important and very important column (4), while factor F5 ‗Existence and consideration of feedbacks (To prevent similar errors in reference to previous projects)‘ received the lowest combined number of response (1) in the important and very important column. These show the respondents have less opinion with the factor F5 as the cause for design-related problems.
International Journal of Emerging Technology and Advanced Engineering
Website: www.ijetae.com (ISSN 2250-2459, ISO 9001:2008 Certified Journal, Volume 9, Issue 11, November 2019)
57
Comparatively factor F1 ‗Level of cooperation of design professionals (Within the same design firm)‘ and factor F2 ‗Extent of teamwork of parities participating in the design phase (Structural, electrical, architectural…)‘ have the
[image:7.612.56.548.205.627.2]highest average index (4.25) showing that both factors have the highest degree of importance in causing the design-related problems and therefore needs more consideration in the design phase of the project.
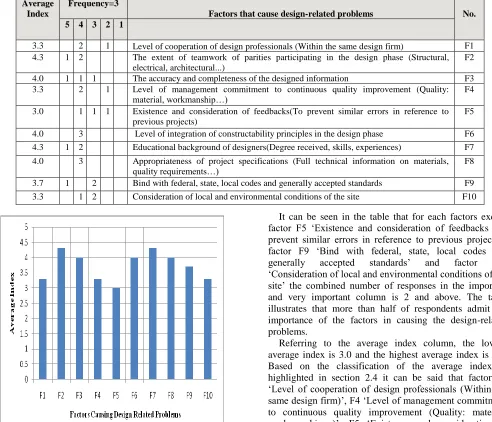
Table 5:
Office engineers’ response distribution and average index
No. Factors that cause design-related problems
Frequency=3 Average
Index
1 2 3 4 5
F1 Level of cooperation of design professionals (Within the same design firm)
1 2 3.3
F2 The extent of teamwork of parities participating in the design phase (Structural, electrical, architectural...)
2 1 4.3
F3 The accuracy and completeness of the designed information
1 1 1 4.0
F4 Level of management commitment to continuous quality improvement (Quality: material, workmanship…)
1 2 3.3
F5 Existence and consideration of feedbacks(To prevent similar errors in reference to previous projects)
1 1 1 3.0
F6 Level of integration of constructability principles in the design phase
3 4.0
F7 Educational background of designers(Degree received, skills, experiences)
2 1 4.3
F8 Appropriateness of project specifications (Full technical information on materials, quality requirements…)
3 4.0
F9 Bind with federal, state, local codes and generally accepted standards
2 1 3.7
F10 Consideration of local and environmental conditions of the site
2 1 3.3
Figure 5: Bar chart representing Contractors’ response distribution and average index
Table 10 presents the response of office engineers‘ expressed as frequencies and average index for each factor that causes design-related problems.
It can be seen in the table that for each factors except factor F5 ‗Existence and consideration of feedbacks (To prevent similar errors in reference to previous projects)‘, factor F9 ‗Bind with federal, state, local codes and
generally accepted standards‘ and factor F10
‗Consideration of local and environmental conditions of the site‘ the combined number of responses in the important and very important column is 2 and above. The table illustrates that more than half of respondents admit the importance of the factors in causing the design-related problems.
International Journal of Emerging Technology and Advanced Engineering
Website: www.ijetae.com (ISSN 2250-2459, ISO 9001:2008 Certified Journal, Volume 9, Issue 11, November 2019)
58
Comparatively the factors F2 ‗Extent of teamwork of parities participating in the design phase (Structural, electrical, architectural…)‘ and factor F7 ‗Educational background of designers (Degree received, skills, and experiences)‘ have the highest average index (4.3) showing that, according to the office engineers both the factors have a higher degree of importance in causing the design-related problems and thus needs strict attention during the design phase of the project.
Note: supervisors‘ frequency of response is the same with
the consultants‘ frequency of response and it is not necessary to describe here in distinct section as it has been already interpreted in the section under the type of company.
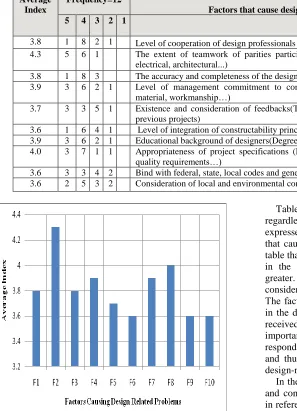
Table 6:
All respondents’ response distribution and average index
No. Factors that cause design-related problems
Frequency=12 Average
Index
1 2 3 4 5
F1 Level of cooperation of design professionals (Within the same design firm)
1 2 8 1 3.8
F2 The extent of teamwork of parities participating in the design phase (Structural, electrical, architectural...)
1 6 5 4.3
F3 The accuracy and completeness of the designed information
3 8 1 3.8
F4 Level of management commitment to continuous quality improvement (Quality: material, workmanship…)
1 2 6 3 3.9
F5 Existence and consideration of feedbacks(To prevent similar errors in reference to previous projects)
1 5 3 3 3.7
F6 Level of integration of constructability principles in the design phase
1 4 6 1 3.6
F7 Educational background of designers(Degree received, skills, experiences)
1 2 6 3 3.9
F8 Appropriateness of project specifications (Full technical information on materials, quality requirements…)
1 1 7 3 4.0
F9 Bind with federal, state, local codes and generally accepted standards
2 4 3 3 3.6
F10 Consideration of local and environmental conditions of the site
2 3 5 2 3.6
Figure 6: Bar chart representing Contractors’ response distribution and average index
Table 11 illustrates the response of all the respondents regardless of the type of company and specialization expressed as frequencies and average index for each factor that causes design-related problems. It can be seen in the table that for each factor the combined number of responses in the important and very important column is 6 and greater. This shows more than half of the respondents consider factor F1-F10 either important or very important. The factor F1‘Extent of teamwork of parities participating in the design phase (Structural, electrical, architectural...)‘ received the highest number of responses (5) in the very important column. This reveals, according to all respondents factor F1 has a higher degree of importance and thus considered as the major contributing factor for design-related problems.
[image:8.612.59.356.261.672.2]International Journal of Emerging Technology and Advanced Engineering
Website: www.ijetae.com (ISSN 2250-2459, ISO 9001:2008 Certified Journal, Volume 9, Issue 11, November 2019)
59
It is clear that the respondents have a comparatively low opinion for these factors in causing the design-related problems in reference to other factors.
Referring to the average index column it can be seen that the average index of all factors is greater than 3.5. Based on the classification of the average index as highlighted in section 2.4 all the factors are towards the very important side. Here also factor F2 ‗Extent of teamwork of parities participating in the design phase (Structural, electrical, architectural...)‘ is found to have the highest value of the average index (4.3). Factor F8 ‗Appropriateness of project specifications (Full technical information on materials, quality requirements…)‘ received the next highest average index (4.0). From the above result, it can be concluded that each factor that is identified as a cause of design-related problems have found to have a higher degree of importance and thus designing parties need to consider each factor in the design phase of the project so as to control and minimize the problems that possibly occur in the design stage of the project
REFERENCES
[1] ASCE (1990) Quality in the Constructed Project, Manual of Professional Practice, American Society of Construction Engineers, New York.
[2] ASCE (2000) Manuals and Reports of Engineering Practice. Quality in the Constructed Projects: A Guide for Owners, Designers, and Constructors. 2nd edition, No.73.
[3] Austin, S.A., Baldwin A.N. Li, B. and Waskett, P. (2000). Improving Building Design through Integrated Planning and Control. Engineering, Construction and Architectural Management, Vol. 1.9, No. 3, PP 249-258
[4] Australian Construction Industry Forum (2003) Improving Project Documentation, a Guide to Improve Current Practice, retrieved on
April 6, 2008 from
(www.acif.com.au/dwn/AGuidetoImproveCurrentPractice.pdf). [5] Center for Innovative and Construction Engineering (CICE) (1997)
task force and other studies in the UK.
[6] CII (1986). Constructability – A Primer. Publication 3-1 Austin, Texas: Construction Industry Institute.
[7] CII (1992). Constructability Implementation Guide, Special Publication. Austin, Texas: Construction Industry Institute. [8] CIRIA (1983). Build ability: An Assessment. Special Publication 26:
CIRIA
[9] CIRIA (1987), Quality Assurance in Construction: The Present Position, Special Publication 49, CIRIA Press, London.
[10] Construction Industry Institute (1986) Constructability, A primer Austin Texas
[11] Construction Industry Institute (CII) (1987a) Guidelines for Implementing a Constructability Program. CII, Austin, Texas. [12] Construction Industry Institute Australia (CII Australia) (1996)
Constructability Manual. CII Australia.
[13] Fisher, et. al, and Rajan, N. (2000). ―Automated Constructability Analysis 122(1), 36-43
[14] Forguson, I. (1989). Build ability in Practice. London: Mitchell‘s Professional Library.
[15] Griffith, A and Sidwell, T. (1995). Constructability in Building and Engineering Projects. London: Mac Millan Press Ltd.
[16] Jergeas, P.E., John Vander Put. (2001). Benefits of Constructability on Construction Projects. Journal of Construction Engineering and Management, ASCE, Vol. 127, No. 4, 281-290.
[17] Journal of Management In Engineering / March/April 1999 / 43
[18] Kirby, J. G., Furry, D.A. and Hiks, D.K. (1988). Improvements in Design Review Management. Journal of Construction Engineering and Management, ASCE, Vol. 114, No. 1, pp69-82
[19] Lutz, J.D., Hancher, D.H. and East, E.W. (1990). Framework for Design Quality-Review Data-Base System. Journal of Management in Engineering ASCE, Vol. 6, No. 3, pp 296-311
[20] Madelsohn, M. (1997). The Constructability Review Process: A Constructor‘s perspective. Journal of Management in Engineering. ASCE. 13(3): 17-19
[21] O‘Connor.J.T.F. Hugo, et al. (1991) ―Improving building specifications for constructability, ―Journal of Construction Engineering and Management 117(2): 242. 258.
[22] Peurifoy, Robert L., Schexnayder, Clifford J., and Shapira, Aviad, Construction Planning, Equipment, and Methods, 7th edition, New York, McGraw-Hill, 2006.
[23] Public Procurement Agency (1997EC). Public procurement guideline of the Federal Government of Ethiopia
[24] Public Procurement Agency (2006). Standard RFP for the procurement of consultancy services
[25] Rosli Mohammad Zin (2002). Constructability Improvement of Project Design, Department of Civil Engineering, UTM, Johor, PH.D. Research.