JOURNAL OFCLINICALMICROBIOLOGY,
0095-1137/00/$04.00⫹0 June 2000, p. 2150–2155 Vol. 38, No. 6
Copyright © 2000, American Society for Microbiology. All Rights Reserved.
A Multicenter Study Evaluation of the Digene Hybrid Capture II
Signal Amplification Technique for Detection of Hepatitis B
Virus DNA in Serum Samples and Testing
of EUROHEP Standards
HUBERT G. M. NIESTERS,1* MEL KRAJDEN,2LYNDA CORK,2MARIADEMEDINA,3MARY HILL,3 EDWIN FRIES,1ANDALBERT D. M. E. OSTERHAUS1
Department of Virology, University Hospital Rotterdam, Rotterdam, The Netherlands1; Toronto Medical Laboratories, The Toronto Hospital, Toronto, Ontario, Canada2; and Center for Liver Diseases,
University of Miami School of Medicine, Miami, Florida3
Received 30 September 1999/Returned for modification 28 December 1999/Accepted 10 March 2000
We have evaluated the new Digene Hybrid Capture II HBV DNA Test (HCII HBV), which is a 96-well microtiter plate-based signal amplification assay. This test uses hybrid capture technology that specifically
detects RNA-DNA hybrids. HCII HBV is able to quantify hepatitis B virus (HBV) DNA at between 1.4ⴛ105
and 1.7ⴛ109HBV copies per ml in a standard format. By using a modified sample preparation method, which
allows the input of 30-fold more serum for an ultrasensitive format, the sensitivity of the assay can be increased reproducibly to approximately 8,000 copies of HBV per ml. By using a combination of these two formats, the assay can quantify over a total range of 6 logs. In our multicenter evaluation study, the mean laboratory-to-laboratory coefficients of variation were 22, 7, and 12% at the three sites, respectively, with a combined specificity of 98.4%. The linearities of both the standard test and the ultrasensitive test were excellent, with Spearman correlation coefficients of 0.997 and 0.999, respectively. Furthermore, the intra-assay reproducibility for the standard assay gave coefficients of variation of from 13 to 33, 9 to 21, and 3 to 8% at the three sites, respectively. HCII HBV was shown to be genotype independent when the EUROHEP standards for genotypes A and D were used. This assay allows the accurate measurement of HBV DNA levels in serum and can be clinically used for the monitoring of responses to antiviral agents for patients chronically infected with HBV.
It has been estimated that worldwide approximately 300 million individuals are chronic carriers of hepatitis B virus (HBV). The measurement of HBV DNA levels in serum has become an important tool for the identification of individuals with high levels of viral replication who might benefit from antiviral therapy, monitoring of patients on therapy, and pre-diction of whether antiviral therapy will be successful. With the introduction of new antiviral agents like lamivudine [(⫺)-2⬘,3⬘ -dideoxy-3⬘-thiacytidine], close monitoring of patients has be-come increasingly important due to the occurrence of antiviral agent-resistant strains or the presence of flares after with-drawal from antiviral therapy (8, 16).
Several molecular approaches, either commercially available or homemade tests, have been used in the last few years to quantify serum HBV DNA levels more accurately. Unfortu-nately, these assays generate highly divergent results due to a lack of standardization and differences in the dynamic ranges of the assays (4, 10, 12, 13, 19, 23).
Here, we describe the results obtained with a second-gener-ation microplate assay, the Digene Hybrid Capture II HBV DNA Test (HCII HBV), which is a signal amplification-based assay. By using a high-speed centrifugation step, the assay’s analytical sensitivity can be increased 30-fold, giving a lower detection limit of approximately 8,000 HBV copies/ml. We evaluated the sensitivity, specificity, linear range, reproducibil-ity, and precision of the test at three different laboratories. In
addition, by using the EUROHEP HBV standards of HBV genotypesadanday, quantification was shown to be genotype independent. HCII HBV was also compared to the previous generation tube-based assay, the Hybrid Capture System (HCS) HBV DNA assay.
MATERIALS AND METHODS
Clinical samples.Specimens used for the multicenter evaluation were well-characterized samples obtained from a commercial manufacturer (Boston Bio-medica Incorporated, West Bridgewater, Mass.). These samples were represen-tative of clinical specimens. The samples and dilutions for the multicenter evaluation were prepared centrally (Digene Corporation, Gaithersburg, Md.). The samples were serially diluted twofold in human HBV-negative serum, in-cluding negativity for hepatitis B surface antigen, (HBsAg), anti-hepatitis C virus antibodies, human immunodeficiency virus type 1 and 2 antibodies, anti-hepatitis B core antigen antibodies, and anti-HBsAg antibodies (Boston Bio-medica Incorporated). Selection of samples for the multicenter study was based on the presence HBsAg and/or hepatitis B e antigen positivity. All samples were tested at Digene Corporation prior to distribution to the centers. The values obtained were depicted as expected number of HBV copies per milliliter.
An additional 89 clinical samples for the correlation between HCII HBV and the HCS tube-based assay were obtained from the Virology Department of the University Hospital Rotterdam. With the exception of the EUROHEP stan-dards, which are plasma samples, only serum samples were used. Samples that required dilution, including the EUROHEP standards, were diluted in known HBV DNA-negative serum. All aliquots were stored frozen at⫺20°C or lower within 2 h of collection.
EUROHEP standards.For an evaluation of the genotype detection charac-teristics of the assay, an international reference plasma preparation was obtained from the EUROHEP Pathobiology Group (W. H. Gerlich, University of Gies-sen, GiesGies-sen, Germany). These standards contained well-characterized levels of HBV DNA of serotypesad(genotype A) anday(genotype D). On the basis of extensive testing, these samples contain 2.7⫻109and 2.6⫻109HBV molecules per ml, respectively (7). These two EUROHEP reference panels have already been used for standardization of the test kits and in quality control trials (19). The plasma with genotype A will probably be the basis of the World Health Organization reference sample.
* Corresponding author. Mailing address: Department of Virology, University Hospital Rotterdam, Dr. Molewaterplein 40, 3015 GD Rot-terdam, The Netherlands. Phone: 31-10-463.3431. Fax: 31-10-463.3441. E-mail: [email protected].
2150
on May 15, 2020 by guest
http://jcm.asm.org/
HCS-based tube assay.The HCS tube-based assays were performed according to the instructions of the manufacturer. Briefly, 50-l serum samples, controls, and standards or calibrators with HBV DNA at concentrations ranging from 5 to 2,000 pg/ml (equivalent to 1.42⫻106to 5.6⫻108HBV copies per ml) were each prepared in separate 2-ml reaction tubes, together with 25l of sample diluent and 25l of sample preparation reagent. The tubes were incubated for 20 min at 65°C for lysis of the viral particles. The sample preparation reagent contained proteinase K. After incubation, 50l of a sodium hydroxide solution (the DNA denaturation reagent) was added for 30 min at 65°C. Once the probe mixture was prepared, 50l of the probe mixture was added to the denatured HBV DNA, followed by incubation for another 60 min at 65°C. The probe contains full-length HBV RNA of two different genotypes (genotypes A and D). During this hybridization step, RNA-DNA hybrids were formed. These were subsequently detected by transferring the solution into a capture tube coated with anti-RNA-DNA antibodies. RNA-anti-RNA-DNA hybrid capture was performed at room tempera-ture on a rotary shaker. The immobilized hybrid was reacted with an anti-RNA-DNA hybrid antibody conjugated to alkaline phosphatase and was detected with the chemiluminescent substrate LumiPhos 530. The concentration of the HBV DNA was subsequently calculated from the external standard-calibration curve with the manufacturer’s software. Processing of 60 samples required approxi-mately 6 h.
HCII HBV.HCII HBV was performed according to the manufacturer’s in-struction. Briefly, 30-l serum samples, controls, and standards or calibrators with HBV DNA at concentrations ranging from 0.5 to 6,000 pg/ml (equivalent to 1.42⫻105to 1.7⫻109HBV copies per ml) were incubated with 30l of sodium hydroxide solution (denaturation reagent) for 30 min at 65°C in a 96-well mi-croplate. No extra sample preparation step was needed. After preparation of the probe mixture, 30l of RNA probe was added to each well and the plate was incubated for 1 h at 65°C. The RNA probes were identical to those used in the
first-generation HCS tube-based assay. To capture the RNA-DNA hybrids, 75l of each solution in the microplate was transferred to the corresponding well of the anti-RNA-DNA hybrid antibody-coated capture microplate, and the plate was subsequently shaken at room temperature for 1 h. The hybrid was reacted with an anti-hybrid antibody conjugated to alkaline phosphatase and detected with the chemiluminescent substrate CDP-star with Emerald II. The testing process for 96 samples (including controls) required approximately 3.5 h.
In the ultrasensitive format of the assay, 1 ml of serum sample and controls along with 50l of precipitation buffer was centrifuged at 33,000⫻gat 4°C in a Hereaus Stratos Biofuge or Jouan high-speed tabletop centrifuge for 110 min. This procedure yields a 30-fold increase in sensitivity and enhances the lower detection limit of the assay to approximately 8,000 HBV copies/ml.
Statistics.x-yscatter diagrams and the correlation coefficients (r2) or Spear-man correlation (r) as well as linear regression analysis were prepared or calculated by using the statistical functions of SPSS, version 8.0, software. In order to compare to what extent the data obtained with the first- and second-generation assays were in agreement, the data were also analyzed as described by Bland and Altman (2), which is based on a comparison of the differences be-tween measurements for the same sample by plotting the differences against the average.
RESULTS
Correlation between HCII HBV and HCS tube-based assay.
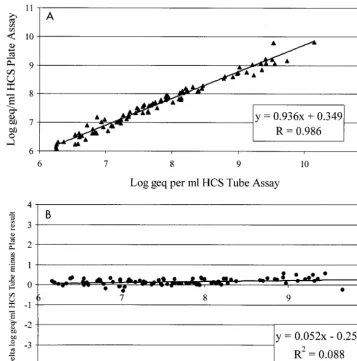
The correlation between the HCII HBV and the HCS tube-based assay was determined with 89 positive clinical samples with loads of more than 1.5⫻106copies of HBV DNA per ml FIG. 1. (A) Correlation of HCS tube-based assay with HCII HBV. The calculated log10DNA concentrations were calculated for a set of 89 randomly selected clinical samples. Linear regression analysis showed a Spearman correlation of 0.986. (B) Comparison of HCS tube-based assay and HCII HBV as described by Bland and Altman (2). Only data for samples that were positive and above the detection level of the HCS tube-based assay are included. geq, genome equivalents.
VOL. 38, 2000 DETECTION OF HBV IN SERUM 2151
on May 15, 2020 by guest
http://jcm.asm.org/
[image:2.612.124.481.73.433.2]prepared by both methods (Fig. 1A). If the samples contained HBV DNA at levels above the dynamic range of the assays, they were diluted in HBV DNA-negative serum. The slope, intercept, and Spearman correlation coefficient (r⫽0.986) of the log-transformed calculated DNA concentrations were de-termined by linear regression analysis.
The correlation between the two assays was also calculated by the method of Bland Altman (2) by plotting the differences against the average (Fig. 1B). The correlation coefficient (r2) was 0.088, and the highPvalue (P⫽0.296) indicates that the differences observed were independent from the average. However, the viral loads obtained by the HCS tube-based assay were on average 0.25 log higher than those obtained by HCII HBV.
Linear range of HCII HBV.The linearities of the standard
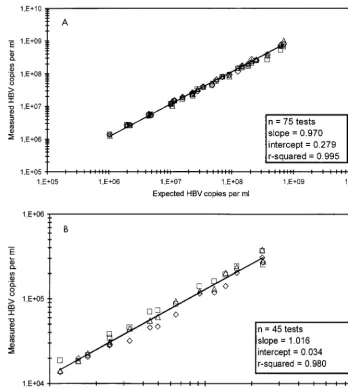
and ultrasensitive formats were determined. For the standard format of the assessment test, five serum samples which were serially twofold diluted were used. The quantities in the dilu-tions ranged from 1.4⫻106to 8.5⫻108HBV DNA copies per ml (Fig. 2A). For the ultrasensitive format of the assessment
test, three serially twofold diluted serum samples were used. The quantities in the dilutions ranged from 1.5⫻104to 3.5⫻ 105 HBV copies per ml (Fig. 2B). The calculated log
10 con-centration for each replicate was compared to the expected log10input concentration. Regression analysis showed that the linear range of concentrations of the ultrasensitive assay for-mat and the standard assay forfor-mat were close to the expected concentrations because the slopes approached 1.0 (1.016 and 0.97, respectively) and the intercepts approached zero (0.034 and 0.279, respectively).
Specificity.The analytical specificity of the assay in the
stan-dard format was determined by testing 15 HBsAg-negative specimens at the three different sites multiple times, giving a total of 63 datum points. One sample gave a value above the mean for calibrator 2 that resulted in a false-positive result. Repeat testing of this sample identified it as negative, indicat-ing that the false-positive result was more likely due to a technical error. This resulted in an overall specificity of 98.4%. The specificity of the assay in the ultrasensitive format was not FIG. 2. (A) Linear range of HCII HBV determined in the standard format. Five twofold serial dilutions were made from five different patients. Each sample was analyzed three times at the three different sites. The data for each site are marked with a different symbol. Linear regression was performed for input DNA concentrations. (B) Linear range of HCII HBV determined in the ultrasensitive format. Five twofold serial dilutions were made from three different patients. Each sample was analyzed three times at the three different sites. The data for each site are marked with a different symbol. Linear regression was performed for input DNA concentrations.
2152 NIESTERS ET AL. J. CLIN. MICROBIOL.
on May 15, 2020 by guest
http://jcm.asm.org/
[image:3.612.125.474.70.461.2]determined in this multicenter evaluation. Testing at one lab-oratory resulted in an overall specificity of 99%.
Interlaboratory variation. To determine the variability of
the method when used by the different laboratories, 10 samples were tested at the three different evaluation sites on 3 different days by the same operator at each site. The mean percent coefficients of variation (CVs) for the three sites were 22, 7, and 12%, respectively, and the overall mean CV for the com-bined results was less than 14% (Fig. 3).
Intralaboratory variation. To determine the variability of
the method within a given laboratory, three samples were tested at each laboratory by one assay by using six replicates per sample. The CVs for the three sites ranged from 13 to 33, 9 to 21, and 3 to 8%, respectively (Table 1). The overall mean CV for the combined sites was less than 13%.
Correlation between concentrations by HCII HBV and
con-centrations in EUROHEP standards. In order to determine
whether the microplate assay was HBV genotype independent, serial dilutions from the EUROHEP standards of genotypes A and D were made and analyzed in the standard format of HCII HBV. The differences between the expected HBV DNA con-centration and the measured HBV DNA concon-centration were 0.05 log10for genotype A and 0.11 log10for genotype D, indi-cating that the difference between the two EUROHEP stan-dards was well within the intra-assay variability. From this analysis it could furthermore be concluded that the detection limit of the standard assay was 190,000 copies of HBV DNA (Fig. 4A). The detection limit of the assay in the ultrasensitive format was determined by using half-log serial dilutions of the EUROHEP standards and was shown to be approximately 8,000 copies of HBV DNA per ml for both genotypes A and D (Fig. 4B).
DISCUSSION
In the present paper, we have demonstrated that the ana-lytical sensitivity of HCII HBV was approximately 10-fold higher than that of the HCS tube-based assay, with a detection limit of 200,000 copies of HBV DNA per ml. A simple high-speed centrifugation step further increased the sensitivity of HCII HBV down to 8,000 copies per ml. This step did not
interfere with the binding of the RNA probe to the HBV DNA or the capture of the RNA-DNA hybrid to the 96-well capture plate and led to a more than 300-fold higher sensitivity than that obtained with the HCS tube-based assay. The detection limit thus obtained is more in the range of the detection limits of standard target amplification assays, like PCR. A great prac-tical advantage of these two formats is that within a single plate the HBV DNA loads in samples with HBV DNA load differ-ences of more than 6 logs can be simultaneously determined. Current commercially available PCR-based techniques can de-tect as few as 1,000 copies per ml if the EUROHEP panel is used as a standard, which is a narrower range of detection (11). This indicates that with the new technology, the differences between standard hybridization assays, also called signal am-plification assays and target amam-plification assays, like PCR or nucleic acid sequence-based amplification (NASBA), are greatly reduced.
[image:4.612.126.473.72.273.2]Minor differences have been observed between the HCS tube-based assay and HCII HBV. The results obtained by HCII HBV were, on average, 0.25 log lower than those ob-tained by the HCS tube-based Assay. This difference might be obtained due to a slightly modified sample preparation step. The HCS tube-based assay uses a proteinase K digestion step, whereas HCII HBV does not. Since in HBV DNA the poly-merase protein is covalently attached to the DNA, a proteinase K digestion step in the sample preparation procedure of the HCS tube-based assay might explain the observed difference (7).
TABLE 1. Intratest reproducibility of HCII HBVa
Sample no.
Site 1 Site 2 Site 3
Avgano. of
HBV DNA copies/ml
% CV
Avg no. of HBV DNA copies/ml
% CV
Avg no. of HBV DNA copies/ml
% CV
1 1.8⫻107 33 1.4⫻107 9 1.5⫻107 4 2 1.6⫻108 16 8.1⫻107 21 1.5⫻108 3 3 3.6⫻108 13 3.7⫻108 8 3.7⫻108 8
aThe average of six replicates for each HBV-positive sample was determined
[image:4.612.315.551.633.711.2]for the standard test, and the CV was calculated.
FIG. 3. Combined results of interlaboratory variation for quantitation of HBV DNA in 10 samples with viral loads of between 8.7⫻106and 4.4⫻108HBV DNA copies per ml. Each sample was tested singly on 3 consecutive days at each of the three sites. The data from the individual sites are depicted with different symbols.
VOL. 38, 2000 DETECTION OF HBV IN SERUM 2153
on May 15, 2020 by guest
http://jcm.asm.org/
The lack of standardization has been a problem for nucleic acid detection assays, although in theory, molecular biology-based assays are ideal for standardization purposes (3, 6). With standard hybridization-based assays, sensitivity is generally the biggest problem. Although the basic PCR assay can be exquis-itely sensitive, the first international quality control program for HBV has shown great differences in sensitivity and speci-ficity among results from different laboratories (19). This phe-nomenon is not specific for HBV DNA detection assays but applies to target amplification-based assays in general (6, 22). The lack of standardization has contributed to these differ-ences in sensitivity. From the data obtained with the two EUROHEP reference samples for genotypes A and D (7), it has also become clear that HCII HBV is not genotype depen-dent. This is in contrast to the Abbott Genostics assay, which is widely used in clinical studies worldwide. By that assay geno-type differences can lead to a 35-fold differences in output signals (23). Furthermore, the EUROHEP standard could be used to determine the sensitivity of the assay.
HCII HBV proved to be reproducible, with an overall CV of less then 13% and a maximum CV of 33%. This indicates that the results of tests with a single sample will typically vary by a
factor 2. When the three different laboratories tested the same samples in a test of linearity for both the standard and the ultrasensitive formats, the results that were obtained did not differ by more than a factor of 2. This implies that results from different laboratories may be compared if the results are within these limits. Additional sample volume in the preparation step, as has also been shown for signal and target amplification-based assays targeted at human immunodeficiency virus type 1 (5, 20) or hepatitis C virus (14), will probably further increase the sensitivity of the test.
Determination of the serum HBV DNA level has been shown to be useful for monitoring of the effect of antiviral treatment and for patient management. Furthermore, the emergence of resistance to antiviral drugs can be determined by the detection of increases in viral loads during treatment (9, 15, 21). Typically, signal amplification-based assays are less sensitive, which may not allow the detection of early elevations in viral loads until they reach 106 HBV DNA copies per ml (23). Standard antiviral treatment with nucleoside analogues will reduce HBV DNA levels within a few weeks to a level not detectable by these assays (9). HCII HBV increases the sensi-tivity approximately 300-fold. Limited information is available FIG. 4. (A) Genotype-specific linear range of HCII HBV determined in the standard format. Serial dilutions were made from EUROHEP standards of genotypes A (}) and D (䊐). Each sample was analyzed at least three times. Linear regression was performed for input DNA concentrations. (B) Genotype-specific linear range
of HCII HBV determined in the ultrasensitive format. Serial dilutions were made from EUROHEP standards of genotypes A (}) and D (䊐). Each sample was analyzed
at least three times. Linear regression was performed for input DNA concentrations, geq, genome equivalents.
2154 NIESTERS ET AL. J. CLIN. MICROBIOL.
on May 15, 2020 by guest
http://jcm.asm.org/
on what levels will be reached during antiviral treatment or what HBV DNA levels are present in asymptomatic carriers. Only Niitsuma et al. (17) found that an HBV DNA level of approximately 10,000 HBV DNA copies per ml should be reached after successful antiviral treatment. Below this level, no hepatitis occurred in their study group. This is a detection level just above the cutoff of the ultrasensitive format of HCII HBV.
In summary, the performance characteristics of HCII HBV indicate that this assay is a reliable tool for the accurate mea-surement of HBV DNA levels in serum and therefore could be used to monitor the effects of antiviral therapy. In its ultrasen-sitive format, the assay has a sensitivity which is just above the range of the currently available PCR-based assays (1, 11, 18).
REFERENCES
1.Abe, A., K. Inoue, T. Tanaka, J. Kato, N. Kajiyama, R. Kawaguchi, S. Tanaka, M. Yoshiba, and M. Kohara.1999. Quantitation of hepatitis B virus genomic DNA by real-time detection PCR. J. Clin. Microbiol.37:2899–2903. 2.Bland, J. M., and D. G. Altman.1995. Comparing methods of measurement: why plotting difference against standard method is misleading. Lancet346: 1085–1087.
3.Bresters, D., H. T. Cuypers, H. W. Reesink, E. P. Mauser-Bunschoten, H. M. van den Berg, W. P. Schaasberg, J. C. Wilber, M. S. Urdea, P. Neuwald, and P. N. Lelie.1994. Comparison of quantitative cDNA-PCR with the branched DNA hybridization assay for monitoring plasma hepatitis C virus RNA levels in haemophilia patients participating in a controlled interferon trial. J. Med. Virol.43:262–268.
4.Butterworth, L. A., S. L. Prior, P. J. Buda, J. L. Faoagali, and W. G. Cooksley.1996. Comparison of four methods for quantitative measurement of hepatitis B viral DNA. J. Hepatol.24:686–691.
5.Collins, M. L., B. Irvine, D. Tyner, E. Fine, C. Zayati, C. Chang, T. Horn, D. Ahle, J. Detmer, L. P. Shen, J. Kolberg, S. Bushnell, M. S. Urdea, and D. D. Ho.1997. A branched DNA signal amplification assay for quantification of nucleic acid targets below 100 molecules/ml. Nucleic Acids Res.25:2979– 2984.
6.Damen, M., H. T. Cuypers, H. L. Zaaijer, H. W. Reesink, W. P. Schaasberg, W. H. Gerlich, H. G. Niesters, and P. N. Lelie.1996. International collabo-rative study on the second EUROHEP HCV-RNA reference panel. J. Virol. Methods58:175–185.
7.Heermann, K. H., W. H. Gerlich, M. Chudy, S. Schaefer, R. Thomssen, and The Eurohep Pathobiology Group.1999. Quantitative detection of hepatitis B virus DNA in two international reference plasma preparations. J. Clin. Microbiol.37:68–73.
8.Honkoop, P., R. A. de Man, R. A. Heijtink, and S. W. Schalm.1995. Hepatitis B reactivation after lamivudine. Lancet346:1156–1157.
9.Honkoop, P., H. G. Niesters, R. A. de Man, A. D. Osterhaus, and S. W.
Schalm.1997. Lamivudine resistance in immunocompetent chronic hepatitis B. Incidence and patterns. J. Hepatol.26:1393–1395.
10. Janssen, H. L., Y. A. Schoenmaker-Weber, H. Kruining, S. W. Schalm, and R. A. Heijtink.1993. Quantitative assessment of hepatitis B virus DNA in chronic hepatitis B: comparison of two solution hybridization assays. J. Med. Virol.40:307–312.
11. Kessler, H. H., K. Pierer, E. Dragon, H. Lackner, B. Santner, D. Stunzner, E. Stelzl, B. Waitzl, and E. Marth.1998. Evaluation of a new assay for HBV DNA quantitation in patients with chronic hepatitis B. Clin. Diagn. Virol.9: 37–43.
12. Krajden, M., J. Minor, L. Cork, and L. Comanor.1998. Multi-measurement method comparison of three commercial hepatitis B virus DNA quantifica-tion assays. J. Viral Hepatol.5:415–422.
13. Lai, V. C. H., R. Guan, M. L. Wood, S. K. Lo, M. F. Yuen, and C. L. Lai.1999. Nucleic acid-based cross-linking assay for detection and quantification of hepatitis B virus DNA. J. Clin. Microbiol.37:161–164.
14. McHutchison, J. G., L. M. Blatt, R. Ponnudurai, K. Goodarzi, J. Russell, and A. Conrad.1999. Ultracentrifugation and concentration of a large vol-ume of serum for HCV RNA during treatment may predict sustained and relapse response in chronic HCV infection. J. Med. Virol.57:351–355. 15. Melegari, M., P. P. Scaglioni, and J. R. Wands.1998. Hepatitis B virus
mutants associated with 3TC and famciclovir administration are replication defective. Hepatology27:628–633.
16. Niesters, H. G., P. Honkoop, E. B. Haagsma, R. A. de Man, S. W. Schalm, and A. D. Osterhaus.1998. Identification of more than one mutation in the hepatitis B virus polymerase gene arising during prolonged lamivudine treat-ment. J. Infect. Dis.177:1382–1385.
17. Niitsuma, H., M. Ishii, M. Miura, K. Kobayashi, and T. Toyota.1997. Low level hepatitis B viremia detected by polymerase chain reaction accompanies the absence of HBe antigenemia and hepatitis in hepatitis B virus carriers. Am. J. Gastroenterol.92:119–123.
18. Noborg, U., A. Gusdal, E. K. Pisa, A. Hedrum, and M. Lindh.1999. Auto-mated quantitative analysis of hepatitis B virus DNA by using the Cobas Amplicor HBV Monitor test. J. Clin. Microbiol.37:2793–2797.
19. Quint, W. G. V., R. A. Heijtink, J. Schirm, W. H. Gerlich, and H. G. M. Niesters.1995. Reliability of methods for hepatitis B virus DNA detection. J. Clin. Microbiol.33:225–228.
20. Sun, R., J. Ku, H. Jayakar, J. C. Kuo, D. Brambilla, S. Herman, M. Rosen-straus, and J. Spadoro.1998. Ultrasensitive reverse transcription-PCR assay for quantitation of human immunodeficiency virus type 1 RNA in plasma. J. Clin. Microbiol.36:2964–2969.
21. Wolters, L. M., H. G. M. Niesters, R. A. de Man, and S. W. Schalm.1999. Antiviral treatment for human immunodeficiency virus patients co-infected with hepatitis B virus: combined effect for both infections, an obtainable goal? Antivir. Res.42:71–76.
22. Zaaijer, H. L., H. T. Cuypers, H. W. Reesink, I. N. Winkel, G. Gerken, and P. N. Lelie.1993. Reliability of polymerase chain reaction for detection of hepatitis C virus. Lancet341:722–724.
23. Zaaijer, H. L., F. ter Borg, H. T. Cuypers, M. C. Hermus, and P. N. Lelie. 1994. Comparison of methods for detection of hepatitis B virus DNA. J. Clin. Microbiol.32:2088–2091.
VOL. 38, 2000 DETECTION OF HBV IN SERUM 2155