Munich Personal RePEc Archive
Alcohol and corruption
Kodila-Tedika, Oasis and Kalonda-Kanyama, Isaac and
Azia-Dimbu, Florentin
17 July 2012
Online at
https://mpra.ub.uni-muenchen.de/45718/
Alcohol and corruption
Oasis Kodila-TedikaDepartment of Economics University of Kinshasa, B.P. 832 KIN XI, Kinshasa, Democratic Republic of Congo.
Institute of African Economics Email: [email protected]
Florentin Azia-Dimbu
Department of Psychologie and Education
Université Pédagogique Nationale/Kinshasa, Democratic Republic of Congo. [email protected]
Isaac Kalonda-Kanyama
Department of Economics and Econometrics, University of Johannesburg, South Africa. Department of Economics, University of Kinshasa, Democratic Republic of Congo.
Abstract
This study aims at testing the relationship between alcohol and
corruption. Using cross-sectional data, we find the nexus to be positive.
It follows that the depth of drinking alcohol has a significant positive
correlation with the level of corruption.
Keywords: corruption; alcohol; drinkers; institutions
1. INTRODUCTION
There is little doubt that alcohol consumption is associated with many social problems.
Not only is alcohol consumption and its adverse outcomes a concern for an individual‟s close
partners and relatives, but it is also a cause of serious public health problems in accordance
with alerts of national and international health organizations. For example, maternal alcohol
consumption during pregnancy can result in fetal alcohol syndrome in children, and parental
drinking is correlated with child abuse and impacts a child's environment in many social,
psychological and economic ways (Gmel & Rehm, 2003). On the other hand, according to the
Worth Health Organization (2011), the harmful use of alcohol results in 2.5 million deaths
each year. In addition, 320 young people between the age of 15 and 29 die from alcohol
related causes, resulting in 9% of all deaths in that age group.
The relationship between alcohol and health is well documented as well. Abusive
alcohol consumption is shown to be the cause of several health conditions such
asneuropsychiatric disorders (Samokhvalov et al., 2010), gastrointestinal diseases, cancer
(Baan et al., 2007; Hamajima et al., 2002), cardiovascular diseases (Rehm et al., 2010) and
diabetes mellitus (Baliunas et al., 2009a). In addition to the fact that abusive use of alcohol is
an important cause of road accidents, research has also found that alcohol consumption is
strongly associated with violent crime (Bushman, 1997; Graham and West, 2001) and with a
substantial number of domestic violence accidents (Maffli and Zumbrunn, 2003; Gmel et
Rehm, 2003 ; White and Chen, 2002 ; Obot, 2000; Jewkes, Levin and Penn-Kekana 2002;
Koenig et al., 2003); although the relationship between alcohol and domestic violence is
complex.
More interestingly, the impact of alcohol has been investigated with macroeconomic
variables. Researchers have suggested that alcohol consumption expenditures account for a
substantial part of the annual Gross Domestic Product of industrialized countries (Klingemann
& Gmel, 2001). Baklien and Samarasinghe (2001) conducted a study in 11 districts in Sri
Lanka, examining the link between alcohol and poverty and found that 7% of men said that
their alcohol expenditure was greater than their income. On the other hand, heavy drinking at
the workplace may potentially lower productivity. Trapenciere (2000) estimated that drinking
and alcoholism have reduced labor productivity by about 10%. In addition, there is ample
evidence that people with alcohol dependence and problem drinkers have higher rates of
sickness and absenteeism than other employees (Klingemann & Gmel, 2001). Furthermore,
between heavy drinking or alcohol abuse and unemployment. Here, a causal association may
go in either direction, heavy drinking may lead to unemployment, as suggested by Mustonen,
Paakkaned and Simpura (1994) and Mullahy & Sindelar (1996). However, loss of work may
also result in increased drinking, which may lead to heavy drinking, as indicated by Gallant
(1993), Dooley & Prause (1998) and Claussen (1999). Other links between alcohol
consumption and work related issues are documented by Hughes and Bellis (2000) and
Stallones and Xiang (2003).
Although many research papers have focused on the impact of alcohol consumption,
none has addressed its impact on corruption1. While only anecdotal evidence point to the
possible link between alcohol consumption and corruption (Ramirez Torres, 1990), no paper,
to the best of our knowledge has systematically provided empirical evidence of such an effect.
Our aim in this paper is to feel this gap in the literature. This intuition motivating the
hypothetical nexus is that, alcohol can weaken the conscience (Hull, 1981), hamper the
smooth processing of data (Steele and Josephs, 1988) and disturb cognitive functioning.
Hence, a drunk is less sensible to norms, to his/her personal expectations as well as to his/her
deviation from personal codes of honor and societal norms. Consequently, a drunk is highly
susceptible to adopt of certain code of conduct that is antagonistic to his/her normal state in
the absence of drunkenness (Rathus, 1991). In light of the above, it is therefore logical to
justify a premise for a corruption-alcohol nexus. This is because, in general terms, corruption
is an abnormal and socially-repugnant behavior. Accordingly, once alcohol has taken control
of someone, this person could easily become a candidate of corruption owing to a substantial
decrease in the victim‟s sense of appreciation. Moreover, alcohol could be a stimulating agent for those already deeply embroiled in the scourge. Consistent with Remirez Torres (1990),
those who lack the courage to engage in the act could use alcohol as a stimulant. This paper
therefore assesses the relevance of the above.
The rest of the paper is organized as follows. Section 2 presents the anecdotal
evidence. The methodological approach is covered in Section 3 while results are presented in
Section 4. The last section concludes.
2. ANECDOTAL EVIDENCE
This section presents some evidence on alcohol consumption and corruption.
1
Source: World Health Organization (2011)
A large variation exists in adult per capita consumption (Figure 1). The highest
consumption levels can be found in the developed world, mostly in the Northern Hemisphere,
but also in Argentina, Australia and New Zealand. Medium consumption levels can be found
in southern Africa, with Namibia and South Africa having the highest levels, and in North and
South America. Low consumption levels can be found in the countries of North Africa and
sub-Saharan Africa, the Eastern Mediterranean region, and southern Asia and the Indian
Ocean. These regions represent large populations of the Islamic faith, which have very high
rates of abstention (World Health Organization, 2011).
In terms of consumption, according to the same report, the world average consumption
of pure alcohol was 6,13 liters per capita of more than 15 years (calculated on an average
from 2003 till 2005). The countries which consume most are Russia, the United Kingdom,
France, Germany and the Eastern Europe with more than 12,5 liters of pure alcohol a year per
person. Just behind, we find the rest of Europe, Argentina and Australia, with more than 10
liters.
The WHO notes generally that the consumption is stable since the beginning of 1990s to
the rich countries but that it increases strongly in developing countries, in Asia and in Africa.
She also worries about the increase at the young people generally. On 82 countries having
agreed to answer, 80 % would have noted such an evolution.
Obviously, the tendency varies strongly across countries. The consumption of the
liters, takes a nose dive, if we compare with the 1960s, when they consumed about 25 liters of
pure alcohol a year.
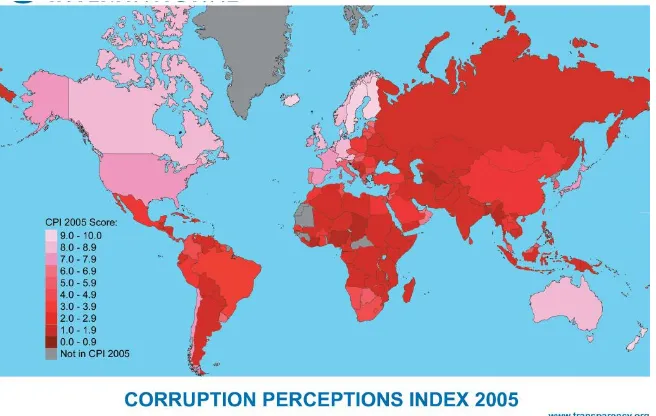
The second graph below brings to light the perception of the corruption in the planet. A
low score (red) indicates a high degree of corruption. The index assumes values between 0
(corruption) and 10 (no corruption). It is clear that the countries of the southern hemisphere
and the Asian countries are the most corrupt, with regard to this indicator. Contrary to the
previous graph, this one is concentrated. It is more the block of regions that is the most
[image:6.595.136.464.274.482.2]concern.
Figure 2. Corruption perception in world
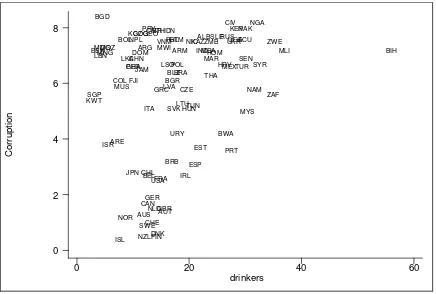
It is not obvious, from the previous figures, to establish a relationship between
corruption and alcohol consumption. We plot the two variables in Figure 3. We represent the
number of drinkers on the horizontal axis and the corruption perception index (CPI) on the
vertical axis. The data is for 2005 and comes from World Health Organization (2011) and
Transparency International for CPI. From the graph, the reversed index assumes values
between 0 (no corruption) and 10 (extreme corruption).
It appears that countries with a low number of drinkers have lower CPI while countries with a
higher number of drinkers have higher levels of CPI. However, Figure 3 also depicts the fact
that some of the countries that have less drinkers have a lower CPI as well. Our aim in this
Figure 3. Alcohol and corruption Co rr u p tio n drinkers
0 20 40 60
0 2 4 6 8 ALB ARG ARM AUS AUT BGD BRB BEL BLZ BEN BOL BIH BWA BRA BGR CMR CAN CHL CHN COL COG CIV HRV CZE DNK DOM ECU EST ETH FJI FIN FRA GEO GER GHA GRC GTM HUN ISL IND IDN IRL ISR ITA JAM JPN KAZ KEN KWT KGZ LVA LSO LTU MDG MWI MYS MLI MUS MEX MNG MAR MOZ NAM NPL NLD NZL NIC NGA NOR PAK PRY PER PHL POL PRT MDAROM RUS SEN SLE SGP SVK ZAF ESP LKA SWECHE SYR THA TUN TUR UGA UKR ARE GBR USA URY
VNM ZMB ZWE
LBN
3 EMPIRICAL MODEL
We estimate the following empirical model:
(1)
where is the corruption index for country i. To measure corruption, we use the reversed
Transparency International‟s Perception of Corruption Index (CPI) for the year 2005. The reversed index assumes values between 0 (no corruption) and 10 (extreme corruption). The
CPI has often been used in empirical research on corruption (see the studies mentioned in
section 1). is adult per capita consumption among drinkers, both sexes, 2005 (15+
years; in liters of pure alcohol). The source of this variable is the report of the World Health
Organization 2011. Z =(z1,…zk)‟ is the vector of control variables, and is the error term
that is assumed to be normally and independently distributed. Finally, is the intercept,
captures the effect of adult per capita consumption among drinkers while = ( ) is
the parameter vector for the control variables. Our parameter of interest is thus .
As control variables, we include openness to trade (or KOF index of economic
globalization for the year 2005 from the literature (Dreher, 2006; Dreher et al., 2008) for the
Penn World Tables 6.3); intelligence quotient for the year 2001 (from Lynn et al., 2002);
democracy for the year 2005 (from Cheibub et al., 2010); average years of schooling (% of
population aged 25 and over or % of population aged 15 and over) form Barro and Lee
(2010); legal origin and geographical location to account for recent debates in the corruption
literature (Asongu, 2012; Okada and Samreth, 2012). Following the trend in the literature,
legal origin is captured by distinguishing between the English, French, German, Scandinavian
and socialist legal heritages.
We perform our analysis on the empirical model specified in equation (1) above using
essentially ordinary least square (OLS) estimates. To correct for likely heteroskedasticity, we
present white-corrected standard errors.
4 EMPIRICAL RESULTS
Table 1 presents the results of equation (1). The control variables display the
expected signs and are statistically significant in several cases. The variable of interest is
positive and statistically significant in all cases. What indicates certain robustness with the
change of the variables. The coefficients of the „drinker variable‟ are statistically
significant at the 1% level in columns (1) and (2).
The first column does not include our determinants. The variable accounts for 5% of
the HIV/Aids prevalence rate in Africa. In the second column, introducing geographical
localization variables in the model increases its explanatory power by 38% (R-squared
was 0.05 and is now 0.38); they are thus critical determinants of the epidemic. But, all the
variables of the geographical localization (with positive sign) are not significant. Only
Europe is significant, with a negative sign. In column (3), contrary to Potrafke (2012),
that intelligence (Intelligence quotient) and education (Average years of schooling) have a
positive influence on corruption, but Intelligence quotient are significant. Per capita
income is statistically significant at the 1% level in column and has the expected negative
sign. Higher income is thus associated with less corruption. The democracy variable has
the expected negative sign but does not turn out to be statistically significant. The KOF
index of economic globalization is statistically significant at the 1% level and has the
expected negative sign. Globalization thus reduces corruption.
In column (4), we only control for the variables of geographical location and legal
corruption; this effect is statistically significant at different levels. The coefficients of the
British legal origin, French legal and Socialist legal origin variable is statistically
significant at the 1% level, while the Scandinavian legal origin variable does not turn out
to be statistically significant.
Tableau 1. Main results
(1) (2) (3) (4)
Drinker 0,057***
(0,019) 0,060*** (0,017) 0,035* (0,020) 0,032** (0,012)
Africa 0,845
(0,529)
3,624** (1,553)
America 2,460
(1,634)
Asia 0,827
(0,568)
2,946* (1,578)
Europe -1,981***
(0,624)
0,373 (1,602)
Oceania 4,832*
(0,567)
LegalOrigin (UK) 1,931***
(0,550)
LegalOrigin (French) 2,821***
(0,492)
LegalOrigin (Socialist) 4,473***
(0,391)
LegalOrigin (Scandinavian) -0,360
(0,342) Intelligence quotient 0,050**
(0,022)
Log GDP per capita
-1,849*** (0,289)
Democracy -0,243
(0,388) KOF index of economic globalization -0,033* (0,019) Average years of schooling 0,040
(0,087)
Constant 4,589***
(0,489) 4,832*** (0,567) 19,156* (1,909) 4,832*** (0,567)
Adj. R² 0,05 0,38 0,66 0,63
Obs. 102 102 89 101
Notes: Absolute value of t-statistics in brackets; * significant at 10%; ** significant at 5%;*** significant at 1%
5 CONCLUSION
This study has assessed the link between alcohol and the corruption, or more exactly the
nexus between drinkers and corruption. Based on the results, we have been able to establish a
positive nexus between the investigated variables. It follows that the depth of drinking alcohol
While the intuition motivating a positive nexus between alcohol and corruption has
already been substantially documented in the introduction, it is interesting to discuss the
ethical implications of the relationship. Firstly, a drunken person may substantially take
alcohol before engaging in a corruption practice so as to use to his/her drunken state (at the
time of the act) as an alibi of unconsciousness if the matter is taken to court. Secondly,
drinkers may engage in corrupt activities because they are poor. Thirdly, corruption is based
on interpersonal trust as those who engage in the activity must trust that no party involved
will take the matter to the police. Fourthly, in situations where police officers and judges are
also alcoholic, reporting of corrupt practices may be settled in „alcohol parlors‟. These ethical explanations are consistent with recent institutional literature (Andrés and Asongu, 2013;
Asongu, 2013).
Two main caveats are interesting to highlight here: the possibility of reverse-causality
that is not addressed in the estimation specifications and, the interpretations of the estimated
nexuses as correlations (not causalities) because of the cross-sectional character of the study.
REFERENCES
Andrés, A. R., and Asongu, S. A., (2013). “Fighting software piracy: which governance tools matter in
Africa”, Journal of Business Ethics
Asongu, S. A., (2012). “On the effect of foreign aid on corruption”, Economics Bulletin, 32(3):
2174-2180.
Asongu, S. A., (2013). “Software piracy, inequality and the poor: evidence from Africa”, Journal of
Economic Studies: Forthcoming.
Baan R et al. on behalf of the WHO International Agency for Research on Cancer Monograph Working Group, 2007, Carcinogenicity of alcoholic beverages. Lancet Oncology, 8:292–293.
Baklien B, Samarasinghe D., 2001, Alcohol and poverty in Sri Lanka. FORUT (Solidaritetsaksjon for utvikling [Campaign for development and solidarity]).
Baliunas D et al. (2009a). Alcohol consumption and risk of incident human immunodeficiency virus infection: a meta-analysis. International Journal of Public Health, 55:159–166 [Epub 2009 Dec 1].
Barro, R.J., Lee, J.-W., 2010. A new data set of educational attainment in the world. 1950-2010.
NBER Working Paper 15902.
Bushman BJ., 1997, Effects of alcohol on human aggression: Validity of proposed mechanisms. In: Galanter M, ed. Recent developments in alcoholism. New York, Plenum Press, 227-244.
Cheibub, J., Gandhi, J., Vreeland, J.R., 2010, Democracy and dictatorship revisited. Public Choice
143, 67-101.
Costes, JM, Martineau H., 2002, Drugs and dependence - Indicators and trends in 2002. Tendances, 19. Paris, Observatoire Français des Drogues et des Toxicomanies [French Monitoring Centre of Drugs and Drug Addiction].
Dooley, D, Prause J., 1998, Underemployment and alcohol misuse in the National Longitudinal Survey of Youth. Journal of Studies on Alcohol, 59(6):669-680.
Dreher, A., 2006. Does globalization affect growth? Evidence from a new index of globalization.
Applied Economics 38, 1091-1110.
Dreher, A., Gaston, N., Martens, P., 2008. Measuring globalization – Gauging its consequences.
Springer, Berlin.
Gallant, DM., 1993, Unemployment and alcohol consumption. Alcoholism, Clinical and Experimental Research, 17(3):722-723.
Gmel G, Rehm J., 2003, Harmful alcohol use. Alcohol Research and Health, 27(1):52-62.
Graham K, West P., 2001, Alcohol and crime. In: Heather N, Peters TJ, Stockwell T, eds.
International handbook of alcohol dependence and problems. London, John Wiley & Sons, 439-470.
Hamajima N et al., 2002, Collaborative Group on Hormonal Factors in Breast Cancer.Alcohol, tobacco and breast cancer-collaborative reanalysis of individual data from 53 epidemiological studies, including 58,515 women with breast cancer and 95,067 women without the disease.British Journal of Cancer, 87:1234–1245.
Hughes K, Bellis MA., 2000, Alcohol: Some sobering statistics from the NWPHO. North West Public Health Ovservatory (NWPHO).
Hull, J.G. (1981), A self-awareness model of the causes and effects of alcohol consumption, Journal of Abnormal Psychology, 90, 586-600.
Jewkes R, Levin J, Penn-Kekana L., 2002, Risk factors for domestic violence: Findings from a South African cross-sectional study. Social Science and Medicine, 55(9):1603-1617.
Klingemann H, Gmel G, eds., 2001, Mapping the Social Consequences of Alcohol Consumption. Dordrecht, Kluwer Academic Publishers.
Klingemann H, Gmel G, eds., 2001, Mapping the Social Consequences of Alcohol Consumption. Dordrecht, Kluwer Academic Publishers.
Kodila Tedika, O. (2012), Aperçu empirique sur les causes de la corruption, MPRA Paper No. 41484.
Koenig MA et al., 2003, Domestic violence in rural Uganda: Evidence from a community-based study. Bulletin of the World Health Organization, 81(1):53-60.
Lynn, R., Vanhanen, T., 2002, IQ and the wealth of nations. Westport, CT: Praeger Publishers.
Maffli E, Zumbrunn A., 2003, Alcohol and domestic violence in a sample of incidents reported to the police of Zurich City. Substance Use and Misuse, 38(7):881-893.
Mullahy J, Sindelar JL., 1996, Employment, unemployment, and problem drinking. Journal of Health Economics, 15(4):409-434.
Mustonen H, Paakkaned P, Simpura J., 1994, Drinking habits among the employed and unemployed.
Obot IS., 2000, The measurement of drinking patterns and alcohol problems in Nigeria.Journal of Substance Abuse, 12(1-2):169-181.
Okada, K., and Samreth, S., (2012), “The effect of foreign aid on corruption: A quantile regression
approach” Economic Letters, 11: 240-243.
Potrafke, N. 2012, Intelligence and Corruption, Economics Letters, 114(1): 109-112.
Ramirez Torres, F., 1990, Los DelitosEconomicos en los Negocias, Managua, Tolleres de don Bosco.
Rathus, S.A . (1991), Psychologie générale, 2ème éd., Etudes vivantes, Montreal.
Rehm J et al., 2009, Alcohol and global health 1: global burden of disease and injury and economic cost attributable to alcohol use and alcohol-use disorders. Lancet, 373:2223–2233.
Rehm J et al., 2010, The relation between different dimensions of alcohol consumption and burden of disease – an overview. Addiction, 105:817 -843.
Samokhvalov AV et al., 2010, Alcohol consumption, unprovoked seizures and epilepsy: a systematic review and meta-analysis. Epilepsia[Epub ahead of print January 13].
Stallones L, Xiang H., 2003, Alcohol consumption patterns and work-related injuries among Colorado farm residents. American Journal of Preventive Medicine, 25(1):25-30.
Steele, C.M., et Josephs, R.A. (1988), Drinking your troubles away II : An attention-allocation model
of alcohol‟s effect on psychological stress, Journal of Abnormal Psychology, 97, 196-205.
Trapenciere I., 2000, Statistics on alcohol, drugs and crime in Latvia. In: Leifman H &Edgren-Henrichson N, eds. Statistics on alcohol, drugs and crime in the Baltic Sea regions. Helsinki, Nordic Council for Alcohol and Drug Research (NAD).
White HR, Chen P., 2002, Problem drinking and intimate partner violence. Journal of Studies on Alcohol, 63(2):205-214.