Munich Personal RePEc Archive
The effect of microaggregation on
regression results: an application to
Spanish innovation data
López, Alberto
Universidad Complutense de Madrid
January 2011
Online at
https://mpra.ub.uni-muenchen.de/30403/
The e¤ect of microaggregation on regression results: An
application to Spanish innovation data
Alberto Lópezy
Universidad Complutense de Madrid
January 2011
Abstract
Microaggregation is a technique for masking con…dential data by aggregation. The
aim of this paper is to analyze the extent to which microaggregated data can be used
for rigorous empirical research. In doing this, I adopt an empirical perspective. I
use data from the Technological Innovation Panel (PITEC) and compare regression
results using both original and anonymized data. PITEC is a new …rm-level panel
data base for innovative activities of Spanish …rms based on CIS data. I …nd that the
microaggregation procedure used has a slight e¤ect on the coe¢cient estimates and their
estimated standard errors, especially when estimating linear models.
Keywords: Microaggregation; Individual ranking; Bias; Innovation data
JEL Classi…cation: C80; O30
This paper has bene…tted from preliminary joint work with Jordi Jaumandreu. I acknowledge support from projects SEJ2007-66520/ECON and ECO2010-19847. Thanks is due to the INE for access to the data. Errors are mine.
Empre-1. Introduction
Observing con…dentiality is crucial when collecting data and providing individual level
information. On the other hand, researchers require access to individual micro data. The
main method used to satisfy these two needs is the application of masking or anonymization
procedures to data (which are also commonly referred to as disclosure control methods).
These masking procedures modify the original data in a way that re-identi…cation of
indi-vidual respondents (i.e., indiindi-viduals and …rms) is almost impossible (or re-identi…cation may
still be possible but would come at great cost). At this point, a trade-o¤ between quality of
the data for analysis and con…dentiality appears: the higher the degree of anonymization
applied to the data, the lower the quality of the data for empirical analysis.
Literature on this topic has focused on two issues. First, a large body of literature
has focused on disclosure control1. These studies evaluate the validity of the di¤erent
anonymization procedures to avoid disclosure of con…dential information. Second, another
strand of literature, which is less developed, analyzes the e¤ect of anonymization procedures
on estimation. The aim of these studies is to analyze the extent to which anonymized data
can be used instead of the original data and how reliable estimates from anonymized data
would be.
One of the most commonly used anonymization procedures is microaggregation by
in-dividual ranking (IR)2. IR is an anonymization procedure by aggregation for continuous
data consisting of three steps: sorting, grouping and replacement with average values. As
a …rst step, for each variable to be anonymized, the data records are ranked in decreasing
(or increasing) order. Secondly, data records are grouped (usually the group size is 3 or 5).
Finally, each original data value is replaced with its respective group mean. This three-step
procedure is applied to each variable to be anonymized.
Microaggregation by IR is the anonymization procedure chosen by Eurostat, although
1See Willenborg and de Waal (2001) for a review.
2See, e.g., Adam and Wortmann (1989) and Winkler (2004) for detailed reviews of the various
it is used in combination with other disclosure control techniques designed for masking
discrete data (see Eurostat 1996, 1999).
Schmid and Schneeweiss (2009) present a theoretical analysis of the e¤ect of the
microag-gregation by IR on the estimation of linear models. These authors prove the consistency
and the asymptotic normality (under weak assumptions) of the empirical moments
com-puted from microaggregated data by IR. Moreover, they provide a simulation study on the
theoretical results and an empirical example based on real data.
Evidence on the e¤ect of microaggregation by IR on non-linear model estimation is, to
my knowledge, restricted to empirical examples3. Mairesse and Mohnen (2001) compare
the estimation results of a generalized tobit model using original and microaggregated data
that correspond to the French CIS 24. These authors …nd that the estimates are “rather
similar,” whether they use the original or the microaggregated data.
This paper is an empirical example created to illustrate the e¤ect of microaggregation by
IR on estimation results. In doing this, I use data from the Technological Innovation Panel
(PITEC) and compare the results from estimating linear and non-linear models using the
original data and the anonymized version.
The rest of the paper is organized as follows. Section 2 introduces the data used and
de-scribes the anonymization process applied. Section 3 analyzes the e¤ect of the
anonymiza-tion procedure applied at the PITEC on estimaanonymiza-tion results, and hence the extent to which
anonymized data from PITEC can be used for rigorous empirical research. In doing this, I
estimate two linear equations and one non-linear equation, using both the original and the
anonymized data from the PITEC. Finally, Section 4 concludes.
3There exists theoretical evidence on the e¤ect of other anonymization procedures in the presence of
nonlinear estimation techniques. For example, Ronning (2005) analyzes the e¤ect of randomized response with respect to some binary dependent variable on the estimation of the probit model. Hausman et al. (1998) focus on a more general framework under the heading “misclassi…cation”.
2. Data and anonymization procedure
The data used correspond to the Technological Innovation Panel (PITEC). PITEC is a
date base for studying the innovation activities of Spanish …rms over time. The data come
from the Spanish Community Innovation Survey (CIS) and the survey is being carried out
by the INE (The National Statistics Institute).
The PITEC has two main advantages. First, it is designed as a panel survey and contains
a huge amount of information related to the innovation activities of Spanish …rms. This
data base includes information for more than 450 variables and 12,000 …rms, and from 2003
to 2008, for the moment. Second, it is a free available data set. The data base is placed
at the disposal of researchers on the FECYT5 web site. Except for the anonymization of
a set of variables, the …les available on the web site correspond with the “original” …les in
the hands of the INE.
Anonymization procedure applied at the PITEC
The anonymization procedure applied at the PITEC consists mainly of a
microaggre-gation by IR. This method is applied to …ve quantitative variables (turnover, investment,
number of employees, innovation expenditures and number of R&D employees) using two
di¤erent ways for forming groups of observations. First, the data records are divided into
groups according to the …rm’s industry (56 industries corresponding to 2-digit or 3-digit
NACE codes). For each variable and industry, the value of the …ve highest observations are
replaced with its group (of size 5) mean. Second, the rest of the orignal data values are
ranked in decreasing order and replaced with the respective group (of size 3) mean.
Moreover, the …rm-level observations of the rest of the quantitative variables are replaced
with the percentage value with respect to microaggregated variables. For example,
intra-mural R&D expenditure is replaced by the percentage of intraintra-mural R&D expenditure on
total innovation expenditure. Appendix A gives a detailed description of the anonymization
procedure.
3. The e¤ect of the anonymization procedure applied at the PITEC
The aim of this section is to analyze the e¤ect of the anonymization procedure applied
at the PITEC on estimation results. In view of the procedure applied (consisting mainly
of a microaggregation by IR) and the literature reviewed in the introduction, the expected
estimation bias is small.
I present the estimation of two linear equations (a sales equation and a labour productivity
equation) and one non-linear equation (an innovation cooperation equation), using both
the original and the anonymized data from the PITEC. I present three simple empirical
examples and, thus, this paper does not aim to be an in-depth analysis of these issues.
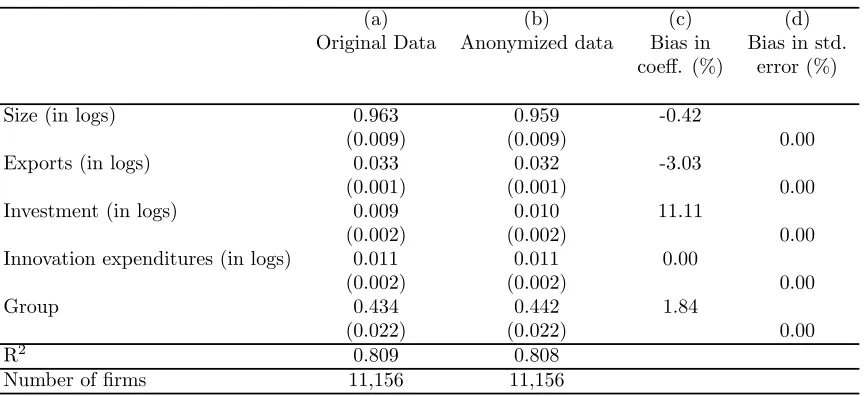
In the …rst equation, sales are assumed to be a linear function of size, exports, investment
in equipment and innovation expenditures. Hence, the sales equation can be expressed as
follows:
log(sales) = 1log(size) + 2log(exports) + 3log(investment) + (1)
4log(innovation expenditures) +u1
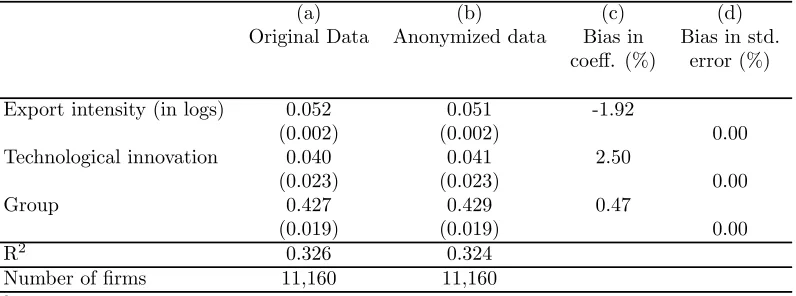
The second equation speci…es labour productivity as a linear function of export intensity
and technological innovation. I express the labour productivity equation as follows:
log(labour productivity) = 1log(export intensity)+ 2technological innovation+u2 (2)
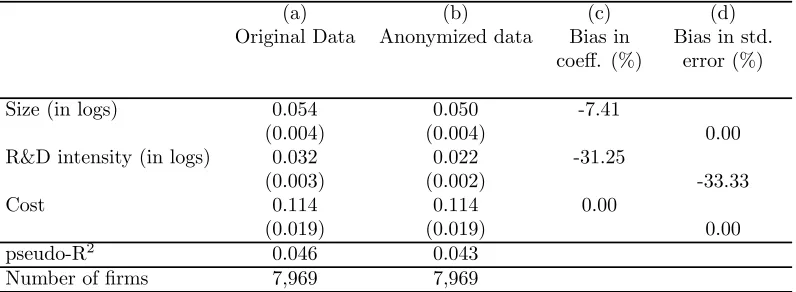
Finally, I estimate the determinants of innovation cooperation by using the standard
probit model. The third equation models the probability of innovation cooperation as a
non-linear function depending on size, R&D intensity and a measure of cost as a hampering
factor for innovation. The innovation cooperation equation can be expressed as follows:
P(innovation cooperation = 1) = ( 1log(size) + 2log(R&D intensity) + (3)
3 cost+u3)
In estimating equations (1), (2) and (3), I also include industry dummies6 and a constant.
Moreover, equations (1) and (2) include a dummy for belonging to a group. Appendix B
gives details on the variables employed.
In this empirical exercise, I use data from the PITEC for the year 2005 and for
manufac-turing and service sectors. This gives a total sample of 11,241 …rms (6,305 manufacmanufac-turing
…rms and 4,936 service …rms). The …nal sample employed to estimate each equation depends
on the data available (i.e., for the estimation of each equation, I drop all the observations
for which the data needed are not available). Moreover, when analyzing cooperation in
innovative activities, I restrict my attention to a subsample of innovating …rms7.
Tables 1, 2 and 3 present the results for the estimation of equations (1), (2) and (3),
respectively. In each table, estimate (column)a presents the results using the original data,
while estimate (column)b shows the estimations using the anonymized data. All estimates
have been rounded to three decimal places. Columnsc and d present aggregation biases in
coe¢cients and standard errors, respectively.
First, I focus on comparing the results using original and anonymized data. I …nd that the
anonymization procedure used has a slight e¤ect on the coe¢cient estimates of equations
(1), (2) and (3) and their estimated standard errors.
Maximum aggregation bias for estimated coe¢cients and standard errors arises in
es-timating a non-linear model (see Table 3), in particular, in the estimation of the e¤ect
of R&D intensity on innovation cooperation. Aggregation bias becomes smaller when
es-timating linear models (see Tables 1 and 2), consistently with results from Schmid and
Schneeweiss (2009). The main lesson that can be drawn from this exercise is that the use
of anonymized data from the PITEC produces reliable results.
Second, I brie‡y comment on the results obtained for the estimation of equations (1),
(2) and (3). I estimate three simple equations explaining sales, labour productivity and
6I include 52 industry dummies. Industry breakdown is de…ned by 2-digit or 3-digit NACE codes. 7Innovating …rms are de…ned as those which report having introduced product or process innovations,
innovation cooperation. However, results are consistent with the existing literature. Firstly,
innovation expenditure has a positive e¤ect on sales. Moreover, …rm size, exports and
investment have the expected positive e¤ect. Secondly, technological innovation and …rm
export intensity are associated with higher labour productivity (see, for example, Crepon et
al. (1998) and Bernard and Jensen (1999), respectively). Thirdly, absorptive capacity of the
…rm (measured by …rm size and R&D intensity) and the importance of cost as a hampering
factor for innovation are signi…cant and positive determinants of innovation cooperation
(see, for example, López (2008) for evidence from Spanish manufacturing …rms).
4. Conclusions
There exist di¤erent techniques for masking con…dential data. These masking procedures
modify the original data in a way that re-identi…cation of individual respondents is almost
impossible and, thus, anonymized data can be used by researchers. At this point, a question
arises as to whether the use of anonymized data produces reliable results.
One of the most commonly used anonymization procedures is microaggregation, and in
particular microaggregation by individual ranking (IR). This paper is an empirical exercise
performed to analyze the extent to which microaggregated data can be used for rigorous
em-pirical research. In doing this, I use data from the Technological Innovation Panel (PITEC)
and compare regression results using both original and anonymized data. In particular, I
present the estimation of two linear equations (a sales equation and a labour productivity
equation) and one non-linear equation (an innovation cooperation equation).
The PITEC is a new …rm-level panel data base for innovative activities of Spanish …rms
based on CIS data. It contains a huge amount of information related to innovation activities.
Moreover, an important feature of this data base is that it is placed at the disposal of
researchers in a microaggregated form. The anonymization procedure applied at the PITEC
consists mainly of a microaggregation by IR.
Results show that the microaggregation procedure used has a slight e¤ect on the
Appendix A: Anonymization procedure
The anonymization procedure used involves four modi…cations:
1. Microaggregation by individual ranking (IR) of …ve quantitative variables (turnover,
investment, number of employees, innovation expenditures and number of R&D employees).
IR procedure used slightly departs from that described in the introduction. In this sense,
IR is applied using two di¤erent procedures for forming groups of observations.
Firstly, the data records are divided into groups according to the …rm’s industry. For each
of the continuous variables mentioned above (and for each industry), the data records are
ranked in decreasing order. Then, the arithmetic mean of the …ve highest observations is
calculated. Finally, the value of each “top …ve” observation is replaced with its cluster mean.
Note that this procedure is applied for each of the variables in question in each industry. If
there are fewer than three …rms with a positive value for the variable in question in a given
industry, this procedure is not applied.
Secondly, for each of the variables in question, the data records are ranked in decreasing
order (without considering the records replaced in the previous procedure). Then, the
observations are grouped by three and the value of each one is replaced with the cluster
arithmetic mean. The last group or the last two groups may have four observations.
In summary, applying IR implies that the available variables are (i) the mean of the …ve
highest observations after ranking the data in decreasing order and according to the …rm’s
sector, or (ii) the mean of three or four consecutive observations after ranking the data in
decreasing order.
2. To replace the …rm-level observations of the rest of the quantitative variables with
the percentage value with respect to the microaggregated value. The variables related to
exports, innovation expenditures and R&D personnel are expressed in percentage values.
Speci…cally, variables related to exports are given as a percentage of sales; intramural R&D
expenditures according to the nature of the spending, the source of funding and spending
by region, R&D expenditures in biotechnology and the amount of research grants are given
supplier is given as a percentage of external R&D expenditure; the expenditure for each
innovation activity and the innovation expenditures by region are given as a percentage of
the total innovation expenditure; R&D personnel by activity, by education and by region,
and the number of research scholars are given as a percentage of total R&D personnel.
3. The …rm’s activity (4-digit NACE Code) is replaced with a 56-industry breakdown
until 2008 and with a 44-industry breakdown from 2008.
4. In order to avoid the disclosure problem, and considering the sample strati…cation, the
data of a given number of …rms has been censored: those …rms belonging to an industry
in which the number of …rms is less than or equal to three, both in the sample and in the
population. Once a …rm is censored in a given year, it will be censored in previous and
Appendix B: De…nitions of Variables
Cost: Sum of the scores of importance of the following obstacles to innovation process
(number between 1 (high) and 4 (not relevant)): Lack of funds within the …rm or group;
Lack of …nance from sources outside the …rm; Innovation costs too high. Rescaled between
0 (not relevant) and 1 (high).
Exports: Firm’s total exports.
Export intensity: Ratio between exports and number of employees.
Group: Dummy variable that takes the value 1 if the …rm belongs to a group.
Innovation cooperation: Variable which takes the value 1 if the …rm cooperates on
in-novation activities with suppliers, customers, competitors, commercial laboratories/R&D
enterprises, universities, or government or private non-pro…t research institutes.
Innovation expenditures: Total amount of expenditure in innovation activities.
Investment: Physical investment.
Labour productivity: Ratio between sales and number of employees.
R&D intensity: Ratio between intramural R&D expenditure and number of employees.
Sales: Firm’s total turnover.
Size: Total number of employees.
Technological innovation: Dummy variable that takes the value 1 if the …rm reports
References
Adam, N. R. and Wortmann, J. C., (1989), “Security-Control Methods for Statistical
Databases: A Comparative Study”, ACM Computing Surveys,21(4), 515-556.
Bernard, A.B. and Jensen, J.B., (1999), “Exceptional exporter performance: cause, e¤ect,
or both?”,Journal of International Economics, 47 (1), 1–26.
Crepon, B., Duguet, E. and Mairesse, J., (1998), “Research and Development,
Innova-tion and Productivity: An Econometric Analysis at the Firm Level”, Economics of
Innovation and New Technology, 7(2), 115-156.
Eurostat (1996), Manual on Disclosure Control Methods, 9E, Statistical O¢ce of the
Eu-ropean Communities, Luxembourg.
Eurostat (1999), “Annex II.9. Micro-Aggregation Process”, in The Second Community
Innovation Survey, Statistical O¢ce of the European Communities, Luxembourg.
Hausman, J.A., Abrevaya, J.and Scott-Morton, F.M., (1998), “Misclassi…cation of the
dependent variable in a discrete-response setting”,Journal of Econometrics,87, 239–
269.
López, A. (2008), “Determinants of R&D cooperation: Evidence from Spanish
manufac-turing …rms”, International Journal of Industrial Organization, 26, 113–136.
Mairesse, J.and Mohnen, P., (2001), “To be or not to be innovative: An exercise in
mea-surement”,STI Review, OECD 27, 103–129.
Ronning, G., (2005), “Randomized response and the binary probit model”, Economics
Letters, 86, 221-228.
Schmid, M. and Schneeweiss, H., (2005). “The e¤ect of microaggregation procedures on
the estimation of linear models: A simulation study”, InEconometrics of Anonymized
Micro Data (W. Pohlmeier, G. Ronning, J. Wagner, eds.), Jahrb…cher ¢r
Schmid, M. and Schneeweiss, H., (2009), “The e¤ect of microaggregation by individual
ranking on the estimation of moments”,Journal of Econometrics, 153, 174 -182.
Willenborg, L. and de Waal, T., (2001), “Elements of Statistical Disclosure Control”,
Springer Lecture Notes in Statistics, vol. 155. Springer, Berlin.
Winkler, W. E., (2004), “Masking and Re-identi…cation Methods for Public-Use
Micro-data: Overview and Research Problems”, In Proc. Privacy in Statistical Databases,
Table 1. Sales equationa,b
Dependent variable: Sales (in logs)
(a) (b) (c) (d)
Original Data Anonymized data Bias in Bias in std. coeff. (%) error (%)
Size (in logs) 0.963 0.959 -0.42
(0.009) (0.009) 0.00
Exports (in logs) 0.033 0.032 -3.03
(0.001) (0.001) 0.00
Investment (in logs) 0.009 0.010 11.11
(0.002) (0.002) 0.00
Innovation expenditures (in logs) 0.011 0.011 0.00
(0.002) (0.002) 0.00
Group 0.434 0.442 1.84
(0.022) (0.022) 0.00
R2 0.809 0.808
Number offirms 11,156 11,156
Table 2. Labour productivity equationa,b
Dependent variable: Sales/Employees (in logs)
(a) (b) (c) (d)
Original Data Anonymized data Bias in Bias in std. coeff. (%) error (%)
Export intensity (in logs) 0.052 0.051 -1.92
(0.002) (0.002) 0.00
Technological innovation 0.040 0.041 2.50
(0.023) (0.023) 0.00
Group 0.427 0.429 0.47
(0.019) (0.019) 0.00
R2 0.326 0.324
Number offirms 11,160 11,160
aRobust standard errors in brackets.
Table 3. Innovation cooperation equationa,b
Dependent variable: Innovation cooperation (dummy variable)
(a) (b) (c) (d)
Original Data Anonymized data Bias in Bias in std. coeff. (%) error (%)
Size (in logs) 0.054 0.050 -7.41
(0.004) (0.004) 0.00
R&D intensity (in logs) 0.032 0.022 -31.25
(0.003) (0.002) -33.33
Cost 0.114 0.114 0.00
(0.019) (0.019) 0.00
pseudo-R2 0.046 0.043
Number offirms 7,969 7,969
aRobust standard errors in brackets. The coefficients are the marginal effect of the independent variable
on the probability of cooperation.