Munich Personal RePEc Archive
Understanding the consequences of
consequentiality: Testing the validity of
stated preferences in the field
Vossler, Christian and Watson, Sharon
University of Tennessee, Knoxville
6 December 2012
Online at
https://mpra.ub.uni-muenchen.de/48109/
Understanding the consequences of consequentiality:
Testing the validity of stated preferences in the field
Christian A. Vosslera,b and Sharon B. Watsona
a
Department of Economics, University of Tennessee, Knoxville, TN 37996 (USA)
b
Howard H. Baker Jr. Center for Public Policy, University of Tennessee, Knoxville, TN 37996 (USA)
Abstract: This study pursues the external validation of stated preference methods by comparing
survey responses from verified voters with the outcome of a parallel public referendum on a
conservation and preservation program to be funded by a local property tax surcharge. The
majority of respondents were unaware of the upcoming referendum, and the experimental design
allows us to control for referenda-related information effects as well as respondents’ perceptions
regarding the consequentiality (i.e. the potential policy impact) of their survey votes. We find the
survey under-predicts “yes” referendum votes at the precinct-level. These differences go away,
however, if we focus only on respondents who perceived their survey vote to be consequential.
Negative hypothetical bias among inconsequential survey respondents is also evident in the
estimation of willingness to pay, and controlling for consequentiality increases construct validity.
Keywords: stated preferences; voting; external validity; consequentiality; field experiment
JEL classification: C93, H41, Q51
1. Introduction
Estimating the values of nonmarket goods such as local parks or reductions in air
pollution is vital for policymaking and judicial decisions. Stated preference (SP) methods are
favored theoretically for their ability to measure total economic value, and are widely used for
estimating preferences over nonmarket goods and goods not yet available in markets. An
abundance of research addresses various aspects of validity regarding SP methods, and while
much of the evidence is supportive, criterion (i.e. external) validity remains the subject of much
debate.
In their seminal paper, Carson and Groves (2007) correctly argue that incentive
compatibility, i.e. the incentive to truthfully reveal preferences, in a SP survey depends on
whether a respondent views her response as “consequential”. Specifically, a survey elicitation is
consequential if the respondent cares about the policies contemplated (i.e. they enter her utility
function) and further views her response as potentially influencing agency action. Building on
this, Vossler et al. (2012) provide sufficient conditions under which both single binary choice
(SBC) and binary discrete choice experiment (DCE) value elicitation mechanisms are incentive
compatible.
The theoretical importance of consequentiality has been echoed by empirical findings. In
a survey of Dutch households on seal protection policies, Bulte et al. (2005) find that including
information on how results would be shared with policy makers decreases estimated willingness
to pay (WTP). Nepal et al. (2009) and Herriges et al. (2010), using respondent self-reports on
perceived policy consequences, reject the null hypothesis of equal WTP distributions among
those who perceived the survey to be consequential and those who did not. Turning to research
“advisory” referenda for publicly-provided private goods (Carson et al., 2004; Landry and List,
2007) and public goods (Vossler and Evans, 2009). The basic finding is that with (induced)
consequentiality, the evidence is favorable with respect to external validity. In a framed field
experiment, Vossler et al. (2012) find that elicited WTP from a SP, DCE elicitation matches that
from financially binding, incentive compatible treatments only for participants who believed
their responses had more than a “weak” chance of influencing policy.
In this study we examine the role consequentiality plays in external validity tests by
comparing a SP mail survey with a parallel, naturally-occurring public referendum. A binding
referendum with a majority vote implementation rule is incentive compatible under standard
assumptions (Farquharson, 1969), making it a suitable criterion. This research provides a bridge
between existing field survey studies (that do not have a criterion to assess external validity) and
controlled external validity studies (that abstract from field conditions) that focus on
consequentiality.1 In particular, this is the first study that compares survey results with a
naturally-occurring public referendum where: (i) the survey proposal is identical to the public
referendum; (ii) the majority of survey respondents are unaware of the upcoming referendum,
which of course better represents typical SP applications; and (iii) information regarding
consequentiality is elicited, which allows us to explore not only possible interactions between
consequentiality and external validity, but between consequentiality and knowledge of the public
referendum.
Evidence from previous studies based on public referenda is somewhat positive,
providing unconditional support of external validity (Vossler and Kerkvliet, 2003; Johnston,
1
2006) or evidence of external validity when “undecided” survey responses are interpreted in
particular ways in the analysis (Carson et al., 1986; Champ and Brown, 1997; Vossler et al.,
2003). One exception is the study by Schläpfer et al. (2004), which finds estimated WTP from
the survey to be statistically higher. The divergent results may be explained by the fact that the
survey and public referendum studied involve different goods and elicitation formats. The study
by Johnston (2006) represents the strongest validity test to date as respondents were aware that
the survey would in fact be used to determine whether a binding referendum would be held.2
Survey respondents in our study are free to form beliefs regarding the survey’s policy impact and
thus, relative to Johnson (2006), our study can be characterized as relaxing control while more
closely capturing the nuance of SP field surveys.
With the exception of Schläpfer et al. (2004) and Johnston (2006), past studies utilizing
comparisons with public referenda have largely relied on the intended votes of respondents who
were (made) aware of the upcoming referendum. Not only does this awareness represent a
departure from typical SP applications, but it may alter beliefs regarding consequentiality as well
as other facets of the elicitation essential for incentive compatibility. To investigate this issue, we
implement the SP survey in two waves. The first wave corresponds with a time period where the
vast majority of respondents are unaware of the referendum. The timing of the second wave
corresponds with public outreach efforts, which are likely to have informed at least some
respondents about the public referendum. 3
2
As discussed by Carson and Groves (2007, p. 189), a survey specifically used to determine whether a proposal is put up for a (binding) vote does not alter the survey’s incentive properties. However, it remains an empirical question whether explicit knowledge of the survey’s intent alters behavior.
3
The particular referendum we study is a proposal to fund conservation and preservation
efforts in Middleborough, Massachusetts through a one-percent property tax surcharge. Survey
participants are asked to vote on a proposal that contains the exact language of the forthcoming
ballot question. Voting records are used to verify which survey respondents voted in the election.
Our analysis focuses on verified voters given that differences in the underlying preferences of
voters and non-voters could confound a comparison between survey responses and actual
referendum votes. The survey instrument, as described in the cover letter, is simply cast as
potentially providing input to the policy decision and makes no mention of the public
referendum.
Comparing SP survey and binding referendum votes on a precinct-by-precinct basis, we
find differences in three of the six voting precincts, unless we restrict our sample to only those
who believed it to be consequential. We find that among inconsequential respondents there is a
negative hypothetical bias, i.e. the survey under-predicts “yes” referendum votes. As the
controlled external validity studies conducted to date find evidence of positive hypothetical bias,
our study provides a missing counterfactual and demonstrates the robustness of using a
consequentiality measure as a conditioning or calibration device. Further, analysis of survey
voting suggests that inclusion of inconsequential respondents introduces considerable noise in
WTP estimation and lowers mean WTP. Overall, our evidence supports the external validity of
consequential SP elicitations, and emphasizes the important role that consequentiality plays in
external validity tests in not only controlled experiment settings but in broader field applications.
2. The Massachusetts Community Preservation Act and Middleborough Referendum
Following nearly two decades of debate, the Massachusetts Community Preservation Act
(CPA) was approved by the state legislature and signed into law in September 2000. The Act
specifies legal requirements and offers intergovernmental financial support to communities that
choose to participate in its provisions for managing future growth, development and
conservation. The Act requires governmental approval of a property tax surcharge of three
percent or less to generate revenues for establishing a fund.
A city or town that adopts the CPA must establish a Community Preservation Committee
as defined in the Act. The Committee is charged with studying the needs, possibilities, and
resources for projects and making recommendations to the legislative body for approval. Thus,
communities enjoy much flexibility in creating and implementing projects and plans that
promote development and preservation goals specific to their localities. Adopting communities
are required to spend or set aside not less than ten percent of the annual revenues in the
Community Preservation Fund for each of the following purposes: open space (including land
for recreational use), historic resources, and community housing.
At a town meeting in May 2010, Middleborough residents voted to place a CPA measure
on its ballot for the November 2010 general election. The measure proposed a property tax
surcharge of one percent on the annual tax levy on real property, which would be assessed
beginning fiscal year 2011 and continue indefinitely. The wording of the measure identified
many targeted areas, specifically that funds would be used to “acquire, create and preserve open
space, acquire, preserve, rehabilitate and restore historic resources, acquire, create and preserve
land for recreational use, acquire, create, preserve and support community housing; and
created….” However, details regarding specific projects were not provided. The proposal
included an exemption for those who own and occupy their homes and qualify for either low
income housing or low- or moderate-income senior housing. In addition, the first $100,000 of
assessed residential property value would be exempt from the surcharge for all households.
The timing of public information activities for the referendum through media coverage
and political advertising were largely limited to the final three weeks prior to the election. The
restriction of information flow and local debate made this ballot initiative well-suited for our
investigation.4 Although residents who followed the Town Meetings were aware that the issue
had been approved to be on the ballot and a brief article appeared in the local newspaper, most
residents were unaware of the upcoming vote until late in the campaign. As the election drew
very close, editorials and articles were submitted and published in the local newspaper, a local
radio station aired a forum led by a representative of the CPA Coalition and other proponents,
and flyers were disseminated at local farmers markets. A temporary website was established
which shared general information on CPA and chronicled many of these activities. Some of this
information has been transferred to the Middleborough’s permanent CPA website.5
3. Study design and data
3.1. Survey Instrument
The survey instrument is deliberately short and accompanied by a cover letter. Similar to
standard SP surveys, the survey focused on the proposal of interest. The cover letter was on
University letterhead, personalized and individually signed. As is a standard practice to
encourage response as well as engender consequentiality, the SP survey stated: “The results and
4
Based on personal communication with community leaders and advocates, it is our understanding that the control and timing of information was deliberate, and intended to limit the influence of opposition groups.
5
conclusions of the research will be shared with policymakers, and made available to community
leaders and interested citizens.” The survey itself began with a primer question asking about
Middleborough spending needs and then asked respondents to vote on the proposal. The wording
of the proposal was exactly as it would appear on the November 2010 Ballot. As a preamble to
the proposal, the survey stated: “We now would like you to consider carefully the following
Proposal. We have found that some would vote for the proposal and others would vote against it.
Both have good reasons why they would vote that way. If you had a chance to vote on this
Proposal, how would you vote?”
The advisory referendum was followed by standard questions probing the respondent
about the reasons underlying her vote. Important to our analysis regarding consequentiality, as
part of the debriefing we included a five-point likert-scale question, “To what extent do you
believe that the indicated votes on the Proposal from you and other survey participants will be
taken into consideration by policy makers?”, where a response of “1” indicates “Not taken into
account” and a “5” indicates “Definitely taken into account”. Throughout the analysis reported in
this paper, we assume that self-reports regarding consequentiality accurately reflect respondent
beliefs. The remainder of the survey solicited opinions on local issues, collected information on
demographics, asked about home ownership and assessed property values, and elicited
information on local activities and community involvement.
3.2. Survey sample
Our sample frame is a list of registered voters obtained from the Town Clerk of
Middleboro prior to the election. From this, we constructed a sample of 2,000 individuals using a
stratified random sampling approach. As we are primarily interested in comparing survey and
voting precinct (6 precincts) and voting history (i.e. whether they voted in neither, either or both
the April 2010 and November 2008 elections). We then randomly sampled from each stratum so
as to have an approximately equal number of voters in each precinct while heavily weighting the
sample towards those who participated in past elections, given they were assumed to be more
likely to vote in the upcoming election. Due to the stratified random sampling scheme, we use
sampling weights to compute aggregate and precinct-level vote proportions from the survey data
and throughout the econometric analysis.6
A total of 1,250 individuals were sent surveys eight weeks prior to the election, and the
remaining 750 were mailed surveys four weeks prior, which corresponded with anticipated local
newspaper coverage and limited referendum outreach efforts. The survey implementation
followed recommended practice (Dillman et al., 2008). Reminder postcards and follow-up
surveys were sent out, and incentives in the form of dollar coins and two-dollar bills were used to
encourage response. The mail survey mode was chosen for its familiarity, accessibility, and
effectiveness. The mail format comes closest to replicating the process of voting in a polling
booth. Recent research cites support for the continued use of mail surveys as postal addresses
provide good coverage for developing the sample frame and response rates can be significantly
higher than those obtained from telephone and web surveys (Dillman et al., 2008).
Respondents were provided with the option of completing the same survey over the
Internet. Nearly ten percent of respondents took advantage of this option. Postmark and Internet
response dates were tracked to determine when participants responded. Returned surveys with
postmark dates after the election were treated as nonrespondents in an effort to ensure that
6
election results did not influence responses. Identification numbers were placed on surveys, and
a database of actual voters was obtained post-election in order to verify which individuals in our
sample voted. As it was possible that an untargeted household member may have completed the
survey, successful matches were based on the survey identification number as well as the limited
demographic information included in both the voter database and survey (age and gender).
Focusing on verified voters, and discarding bad addresses, there are 508 returns yielding a
response rate of 35.6 percent (508/1,426).7 Thirty of the respondents did not indicate a vote on
the proposal but otherwise sufficiently filled out the survey.
3.3. Other data
Other information was gathered on respondents and election voters. Precinct-level
election results were obtained from the Town Clerk of Middleborough. A few respondents did
not indicate their assessed property value, and to the extent possible we obtained assessed values
from a property database located on the Town of Middleborough Assessors’ web site. Finally,
we requested email addresses from those who wished to receive information regarding the study
results. For this (small) sample of 74 respondents, we sent emails asking whether they were
aware that the proposal would appear on the November ballot.8,9 The response rate to the email
inquiry was high at 86% (64/74), and just 11 of 64 (17.2 percent) suggested they were aware of
the public referendum. Breaking the sample in accordance with publicity efforts (three-weeks
prior to the election), just 2 of 35 respondents (5.7 percent) were aware of the referendum prior
7
Excluding bad addresses, 74.8 percent (1,426/1,906) of those sent surveys are verified to have voted in the Election. Among Election non-voters, just 13.8 percent (66/480) responded to the survey. Given the very low response rate for the non-voter sample and the corresponding small sample size, we forego formal comparisons between the voter and non-voter survey samples.
8
We deliberately did not provide this information in the survey, in order for our survey to be more representative of standard SP surveys.
9
to media coverage and 9 of 29 (31.0 percent) otherwise. Although the results of this exploration
are not necessarily representative of the larger respondent samples, this provides suggestive
evidence that: (a) most respondents were unaware of the forthcoming ballot measure when
responding to the survey; and (b) there is a pronounced shift in referendum awareness after the
onset of media coverage.
4. Comparing public referendum and survey votes
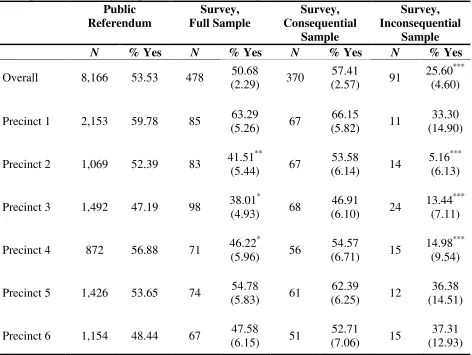
Table 1 presents public referendum and survey results. Middleborough voters approved
the bond measure by a vote of 4,371 (53.53 percent) ‘‘yes’’ to 3,795 (46.47 percent) ‘‘no.’’
Approximately 9.4 percent of election participants failed to cast a “yes” or “no” vote, and this
corresponds closely with the 5.9 percent (30/508) of survey participants who did not indicate a
vote on the proposal but otherwise filled out the survey.10 There is some variation across
precincts, with a range of 47.19 to 59.78 percent “yes” votes, as reported in the second column of
Table 1.
Using the full sample of respondents verified to have voted in the election, 50.68 percent
of participants voted “yes”. Based on a one-sample t-test, this percentage is not statistically
different from the referendum outcome of 53.53 percent (t-statistic = −1.25, p-value = 0.21).
Using precinct-level tests, we reject equality between survey and public referendum voting for
Precinct 2 (t = −2.00, p = 0.05), Precinct 3 (t = −1.86, p = 0.07) and Precinct 4 (t = −1.79, p =
0.08). In all three cases, the survey under-predicts the percentage of “yes” votes cast by roughly
10%.
As economic theory (Carson and Groves, 2007; Vossler et al., 2012) suggests that
consequentiality is needed for incentive compatibility, we explored whether the statistical
10
differences highlighted above may be driven by a violation of this. In particular, based on the
consequentiality question we included in the survey, we divided the respondents into
“inconsequential” and “consequential” samples. Those placed in the former selected the lowest
option, “1 – Not taken into account”, and those in the latter group selected a response option of 2
or higher.11 This division is supported by existing theory, which only suggests a distinction
between those believing a potential link exists between surveys and policy and those believing
otherwise. Of the 461 respondents who answered this question, 91 are in the inconsequential
group. The last four columns of Table 1 report the voting results from the two samples.
Overall, consequential respondents are more likely to have indicated a “yes” vote.
However, there are no statistical differences between consequential sample and referendum
voting percentages either overall or for any precinct. This suggests that, conditional on
consequentiality, our survey demonstrates external validity. Focusing on just the inconsequential
sample, the percentage of “yes” votes is just 25.6 percent, which is statistically different from the
public referendum (t = −6.07, p < 0.01). This suggests that there is a negative hypothetical bias
among this group. Further, we find statistical differences at the precinct level for Precinct 2 (t =
−7.70, p < 0.01), Precinct 3 (t = −4.75, p < 0.01) and Precinct 4 (t = −4.39, p < 0.01). These are
the same precincts for which equality is rejected for the full sample, and further for these
precincts the number of “yes” votes grossly under-predicts referendum “yes” votes by over 30
percent. Thus, the statistical differences observed when analyzing survey votes from the entire
sample appear to be driven by the prevalence of “no” survey votes among inconsequential
respondents.12
11
The complete distribution of responses to the consequentiality question is as follows: “1” (N=91; 19.74%); “2” (N=124; 26.90%); “3” (N=158; 34.27%); “4” (N=49; 10.63%); and “5” (N=39; 8.46%).
12
5. Econometric analysis
5.1. Estimation of willingness to pay
To assess the construct validity of the survey instrument, as well as to further investigate
possible interactions between consequentiality and elicited preferences, we estimate WTP
regressions based on the maximum likelihood estimator of Cameron and James (1987). Unlike
typical SP surveys using a SBC question, identification here is not achieved by randomly varying
possible prices across respondents. However, the ballot measure contains a property tax
surcharge, the amount of which does vary across respondents, and this variation facilitates
estimation of WTP. To obtain an estimate of the tax surcharge, we first use the homeowners’
assessed property value, less $100,000, to calculate their annual property tax based on the 2010
tax rate of $13.05 per $1000 assessed value. This amount is then multiplied by 1% to determine
the tax surcharge upon passage of the referendum. Consistent with the proposal, those identified
as low-income households or low- to middle-income senior households are assumed to have a
surcharge of zero. Estimates of the cost of the proposal to the average homeowner were reported
at $23 per year (Lopes, 2010), and this corresponds closely to the estimated annual tax surcharge
for homeowners in our sample. The range of the estimated tax increase for our sample is $0 to
$53.83.
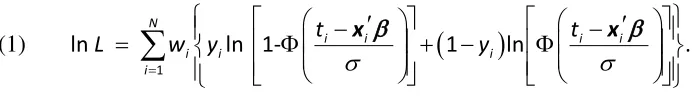
Let WTPi denote respondent i’s willingness to pay for the proposal. WTPi is not directly
observed, but instead can be treated as a censored dependent variable for which we obtain the
signal WTPi ≥ti if participant i votes “yes” to the tax increase, ti, or the signal WTPi <ti if she
votes “no”. Assume WTPi is a linear function of a column vector of covariates,xi, such that
i i i
WTP =x'β +ε , where β is a column vector of unknown parameters and i
ε is a normally
function, assuming the error term has a normal distribution is analogous to assuming a normal
distribution for WTPi. Let yi = 1 denote a “yes” vote and yi = 0 indicate a “no” vote. Further, let
i
w denote the sampling weight. Then, the log-likelihood function is
(1)
(
)
1
ln ln 1- 1 ln .
N
i i i i
i i i
i
t t
L w y y
σ σ
=
− ′ − ′
= Φ + − Φ
[image:15.612.73.419.166.214.2]∑
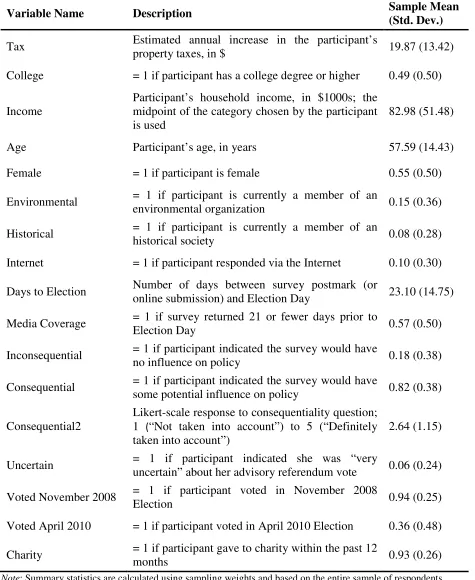
x β x βTable 2 provides descriptions of the variables used in the WTP regressions, which
include respondent characteristics (attainment of a college degree, age, gender), indicators for
membership in environmental and historical organizations, and an indicator variable for Internet
respondents. In addition, we include two controls for referendum awareness: the number of days
between when the survey was returned and the election, and an indicator for surveys returned
within three weeks of the election.13 With our functional form and error distribution assumption,
interpretation of estimated parameters is analogous to that of a standard linear regression model
that treats WTPi as a directly observed (i.e. uncensored) dependent variable. Estimation is carried
out with user-defined maximum likelihood procedures programmed by one of the authors in
Stata.
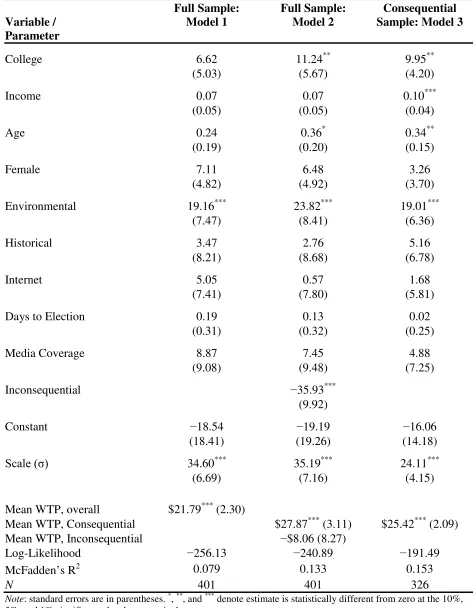
Estimation results from three models, all which include the control variables discussed
above, are presented in Table 3. Model 1 does not include any controls for consequentiality. In
Model 2, we include Inconsequential, which is an indicator variable for inconsequential
respondents.14 In Model 3, we restrict the sample to only include those in the consequential
sample. Reported estimates of mean WTP are calculated at the sample means of covariates.
13
As discussed above, the three-week cutoff coincides with publicity events as well as an observed increase in referendum awareness as evidenced through our email inquiry.
14
Three important results emerge from this analysis. First, the WTP regressions suggest
that inconsequential respondents have a statistically lower stated WTP. Assuming that stated
preferences from this sample do not represent their actual preferences, which is implied by the
earlier voting comparison, this suggests a negative hypothetical bias. The clearest evidence of
this is from Model 2, which yields estimates of mean WTP for consequential and inconsequential
respondents of $27.87 and −$8.06, respectively. Estimated WTP is statistically different across
the two groups, as illustrated from the statistically significant coefficient on Inconsequential. The
inconsequential mean WTP estimate is not statistically different from zero.
Second, controlling for consequentiality improves construct validity. As described by
Carson et al. (2001), construct validity is typically assessed by: explanatory power of the
valuation function; observing whether the probability of wanting the good decreases as price
increases; observing WTP increases with income; and observing whether other factors are
correlated with WTP as suggested by theory or a priori expectations.15 As indicated by
McFadden’s R2, goodness-of-fit nearly doubles when controlling for consequentiality. The scale
parameter is identified by the variation in the tax, and its sign and significance in all models
suggests that the propensity to vote “yes” decreases as the tax (i.e. price) increases. However, as
indicated by the scale parameter (i.e. the standard deviation of WTP), which is 40% larger in
Models 1 and 2 relative to Model 3, considerable “noise” is introduced by including
inconsequential respondents in the regression. Estimation noise is also evident in other estimated
we have available are unfortunately insufficiently correlated with Inconsequential, resulting in weak identification. However, the results from the sample selection models discussed in section 6.2 lend support to our treating the estimation samples as random draws from the population, and we therefore expect our main results to hold under proper instrumental variables estimation. The preferred treatment of self-reported indications of consequentiality in regression models remains an important issue for future work.
15
coefficients. In Model 1, only the covariate Environmental is statistically related to WTP.
Allowing mean WTP to differ across inconsequential and consequential groups in Model 2 leads
to significant coefficients on Environmental, College and Age (albeit marginally in the latter
case). When the sample is restricted to consequential respondents in Model 3, and in addition to
significant coefficients on Environmental, College and Age, the coefficient on Income is now
positive and statistically significant.
Third, there is no discernible effect of awareness of the forthcoming public referendum
on WTP, as the coefficients on the variables Days to Election and Media Coverage are jointly
insignificant in all three models. This is somewhat unexpected, as – even if the respondent
believes the survey to be consequential – knowledge of the referendum could influence the
survey elicitation in ways that would result in a loss of incentive compatibility. As one
possibility, the respondent may believe that the survey was put in place to gather information
from which to devise alternative proposals. This leaves open the possibility that the respondent
would answer untruthfully to the survey referendum if this was perceived by her to increase the
likelihood a more preferable alternative proposal would be put up for a public referendum or
otherwise approved by the policy makers.
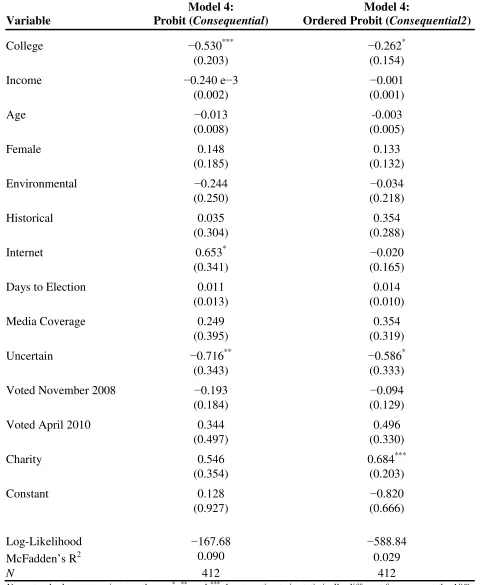
5.2. Drivers of consequentiality
The stark difference in elicited preferences across the consequential and inconsequential
respondent groups naturally begs the question of whether there are identifiable factors, such as
knowledge of the referendum, that are correlated with perceived consequentiality. We explore
this issue through two models, which we present in Table 4. The first, Model 4, is a probit that
(Consequential). As Model 5, we instead estimate an ordered probit model where the likert-scale
measure of consequentiality (Consequential2) is the dependent variable.
The included independent variables capture factors that we hypothesize to influence
beliefs regarding consequentiality. First, as discussed earlier, it is plausible that knowledge of the
upcoming public referendum may decrease perceived consequentiality. At the extreme, a
respondent well aware of the referendum may think that the survey results will simply be used
for academic purposes and not influence the outcome in anyway. As in the WTP regression, we
control for referendum knowledge through the variables Days to Election and Media Coverage.
Second, beliefs that citizens in general can influence policy are likely positively related with a
person’s level of community involvement. To capture this, we include indicators for participation
in the past two elections, as well as an indicator for those who gave to charity within the past 12
months. Third, the strength of beliefs regarding consequentiality may be correlated with
underlying uncertainty. For example, someone who is unsure about various aspects of the
proposal (e.g. payment mechanism) may view the survey as preliminary and potentially less
consequential. We include the indicator variable Uncertain that equals 1 for those who, through a
five-point likert-scale question, indicated they were “very uncertain” about their voting choice.
Finally, beliefs may be tied to socio-economic factors as well as mode-of-administration (i.e.
internet respondents may be more inclined to search for information related to the referendum)
and so we control for this using the same set of variables used to explain variation in WTP.
From the probit model we find that those who have a college degree and those uncertain
about their vote are less likely to believe the survey is consequential.16 Internet respondents are
more likely to believe the survey is consequential. Note that all three effects are fairly
16
pronounced, based on estimated marginal effects: −12.0 percent (College); −21.5 percent
(Uncertain); and 11.1 percent(Internet). The strong partial correlation between uncertainty and
consequentiality is interesting. Many previous studies have hypothesized there to be a
relationship between uncertainty and hypothetical bias, and have found evidence that controlling
for uncertainty helps mitigate the bias (e.g. Champ et al., 1997; Blumenschein et al., 2008).17
Uncertainty in our study is a poor proxy for inconsequentiality, however. If we split the data
based on the uncertainty measure instead of the consequentiality measure, we no longer find the
sharp distinction in voting results nor do we find any statistical relationship between uncertainty
and WTP. Further, including instead the likert-scale certainty level leads to an insignificant
relationship between certainty and consequentiality in the probit (and ordered probit) model.
Turning to the ordered probit model, estimates are generally consistent with the binary
probit in terms of coefficient signs and significance. Both College and Uncertain remain at least
marginally statistically significant. Model fit is lower and standard errors are relatively higher
with the ordered probit, and there overall appears to be little benefit from modeling the intensity
of consequentiality-related beliefs rather than simply whether the respondent believes there to be
any chance of policy influence.
The lack of a statistical relationship between referendum knowledge and
consequentiality is unexpected (note that, for both models, coefficients on Days to Election and
Media Coverage are jointly insignificant). Note that the raw data also suggests that stated beliefs
are largely unaltered by the timing of the survey: 79.8 percent and 81.3 percent of those
responding prior to and after media coverage, respectively, believed the survey to be
consequential. As anecdotal evidence, several respondents – through written comments on the
17
survey, phone calls, and emails –, expressed concern that the survey may inform, send messages,
or provide information to interest groups in ways that may be detrimental to their respective
interests. Proponents were concerned that the survey would draw attention to the actual
referendum and thereby escalate opposition. Both participants and non-respondents expressed
concerns about the source, funding and motive of the survey and particularly the potential for
facilitating outside organization, influence and intrusion in local policy decisions. Thus, this
evidence suggests that survey recipients take a broad view of the relevant policy process in
public goods provision and what may be thought of as an “inconsequential” survey by
researchers apparently is potentially “consequential” to even those respondents aware of the
upcoming referendum.
6. Additional analysis and robustness checks
6.1. WTP regressions based on consequentiality “level”
In the analysis of WTP presented above, we used the stark characterization of
inconsequential and consequential respondents as suggested by theory. To provide some
additional empirical support for this designation, we estimated WTP regressions separately for
each consequential level, as indicated through the likert-scale response to the consequentiality
question. Using our original inconsequential group, all coefficients of the corresponding
regression, including the scale parameter, are jointly equal to zero. Furthermore, mean WTP is
not statistically different from zero. This is not purely due to the small sample size (75
observations). Indeed, if we artificially weight these observations so that they have the same
effective sample size as the full sample, the above two results continue to hold. Further, the
coefficients themselves suggest unrealistic underlying preferences, with most coefficient
WTP regressions based on other consequentiality levels are in contrast well-behaved. In
particular, in each possible case we find significant price effects (i.e. the scale parameter is
positive and statistically significant), and further reject that the set of other model coefficients are
jointly equal to zero. Further, mean WTP, as well as the signs and magnitudes of coefficients are
similar to the presented Model 3 estimates. As such, the overall evidence points to the
respondent group indicating no potential policy influence as driving the differences between
survey and referendum votes, and further introducing considerable noise in the estimation of
WTP from stated preferences.
6.2. Sample self-selection bias
One yet unaddressed question is whether our findings are an artifact of sample selection.
Our response rate is 36 percent, which although is in the ballpark of most SP mail surveys leaves
open this possibility. We have information available on both respondents and non-respondents
that can be used to model the decision to complete and return the survey. In particular, we have
information provided by voting records – age, gender, voting precinct, and participation in the
past two elections – along with whether persons were included in the first or second survey
mailing. With the exception of age and gender, this information is not used to identify WTP and
thus provides an opportunity to identify possible self-selection bias.
Coinciding with Models 1-3, we estimated three Heckman-type selection models using
maximum-likelihood estimation. Note that the number of observations available for the selection
equation is 1457, which includes persons we mailed surveys to that are verified to have voted
and includes those we had incorrect mailing addresses for. All observations corresponding with
persons not included in the relevant WTP regression are treated as nonrespondents. For all three
uncorrelated (Model 1: χ2
=0.97, p=0.33; Model 2: χ2=1.07, p=0.30; Model 3: χ2=0.00, p=0.97),
thus providing evidence of no selection bias. We note that for all three models, the set of
variables used to identify the selection equation are jointly statistically significant. Further, the
selection and non-selection versions of each model are similar in terms of coefficient signs,
magnitudes and statistical significance.18
7. Discussion
A key consideration in recent theoretical and empirical work on stated preference (SP)
methods is whether respondents perceive their decisions to be consequential, i.e. potentially
influencing agency action. Theoretical work suggests consequentiality is essential for incentive
compatibility. Empirical work in this area suggests that simple, survey-based assessments of
consequentiality are integral to the analysis of SP data. In particular, estimated WTP
distributions differ across “consequential” and “inconsequential” respondents in field surveys.
Further, controlled experiment studies have generally found supporting evidence for external
validity as long as some level of consequentiality is induced.
In this study, we use one of the few naturally-occurring yardsticks – the outcome from a
public referendum – to assess the external validity of SP surveys that use a single binary choice
(SBC) question to elicit values for a public good. In doing so, we provide insight as to whether
the consequentiality dichotomy found in existing field survey studies (which have not had a
criterion to assess external validity) goes hand-in-hand with implications from controlled
experiments. In contrast to the handful of studies that compare field surveys with
naturally-occurring referenda, our survey respondents are largely unaware that a public referendum is
18
forthcoming and the survey and referendum elicitations involve identical question formats and
goods. Thus, our design represents a relaxation of control in exchange for SP realism.
Our main result is that consequentiality appears to be vital to external validity. In
particular, we find that votes from survey respondents who perceive the elicitation to be
inconsequential (about 20% of the sample) under-predicts the proportion of “yes” votes in the
actual public referendum. In contrast, there are no statistical differences between the referendum
outcome and survey votes from those believing the elicitation to be consequential. As a
complementary result, our analysis of WTP suggests that failing to control for consequentiality
leads to a negative elicitation bias as well as a decrease in construct validity (i.e. WTP does not
vary in ways suggested by theory).
Coincident with Herriges et al. (2010), controlled consequentiality experiments involving
SBC elicitations, and consistent with economic theory, we find a sharp distinction in elicited
preferences between those who perceive there to be policy consequences and those who do not;
i.e. the strength of (positive) beliefs is not a driver of results. Further, consistent with Nepal et al.
(2009) and Herriges et al. (2010) we find a positive relationship between consequentiality and
WTP. This is suggestive of negative hypothetical bias, which is rarely found in controlled
experiments on hypothetical bias (see List and Gallet, 2001). If future research establishes that
there is generally a positive relationship between consequentiality and WTP, and further that
consequentiality is necessary for external validity in the field, this would have profound
implications for how we should interpret results from previous SP studies (at least those that
involve a SBC elicitation). In particular, this would reverse the common perception that SP
We find that having a college degree and being very uncertain about one’s voting choice
are negatively related to consequentiality. The latter result provides some possible explanation as
to why, in previous work, elicited WTP has been found to be strongly related to uncertainty and
further that controlling for uncertainty has proven useful in equating actual and stated WTP in
field studies. On a final note, we acknowledge that this and related work focused on
consequentiality represents the beginning of possible empirical explorations related to the
theoretical assumptions underlying the incentive compatibility of SP surveys. For example,
another key assumption is that respondents believe that the agency will coerce payment if the
proposal under investigation is implemented. Direct elicitation and/or experimental manipulation
of beliefs regarding this and other facets of the theoretical assumptions will likely reveal
References
Blumenschein, K., Blomquist, G.C., Johannesson, M., Horn, N., Freeman, P. 2008. Eliciting willingness to pay without bias: Evidence from a field experiment. The Economic Journal 118, 114-137.
Bulte, E., Gerking, S., List, J.A., de Zeeuw, A. 2005. The effect of varying the causes of environmental problems on stated WTP values: Evidence from a field study. Journal of Environmental Economics and Management 49, 330-342.
Cameron, T.A., James, M.D. 1987. Efficient estimation methods for use with “closed-ended” contingent valuation survey data. The Review of Economics and Statistics 69, 269-276.
Carson, R.T., Flores, N.E., Meade, N.F. 2001. Contingent valuation: Controversies and evidence. Environmental and Resource Economics 19, 173-210.
Carson, R.T., Groves, T. 2007. Incentive and informational properties of preference questions. Environmental and Resource Economics 37, 181-210.
Carson, R., Groves, T., List, J., Machina, M. 2004. Probabilistic influence and supplemental benefits: a field test of the two key assumptions underlying stated preferences. Working paper, Department of Economics, University of California, San Diego.
Carson, R.T., Hanemann, W.M., Mitchell, R.C. 1986. The use of simulated political markets to value public goods. Working paper, Department of Economics, University of California, San Diego.
Champ, P.A., Bishop, R.C., Brown, T.C., McCollum, D.W. 1997. Using donation mechanisms to value nonuse benefits from public goods. Journal of Environmental Economics and Management 33, 151-162.
Champ, P.A., Brown, T.C. 1997. A comparison of contingent and actual voting behavior.
Proceedings from W-133 Benefits and Cost Transfer in Natural Resource Planning, 10th Interim Report.
Dillman, D.A., Smyth, J.D., Christian, L.M. 2008. Internet, Mail, and Mixed-Mode Surveys: The Tailored Design Method, 3rd ed. New York: John Wiley & Sons.
Farquharson, R. 1969. Theory of Voting. New Haven, Connecticut: Yale University Press.
Herriges, J., Kling, C., Liu, C.-C., Tobias, J. 2010. What are the consequences of consequentiality? Journal of Environmental Economics and Management 59(1), 67-81.
Landry, C.E., List, J.A. 2007. Using ex ante approaches to obtain credible signals for value in contingent markets: evidence from the field. American Journal of Agricultural Economics 89, 420-432.
List, J.A., Gallet, C.A. 2001. What experimental protocol influence disparities between actual and hypothetical stated values? Evidence from a meta-analysis. Environmental and Resource Economics 20, 241-54.
Lopes, J. 2010. Middleborough voters approve Community Preservation Act. Middleborough Gazette, November 4.
Nepal, M., Berrens, R.P., Bohara, A.K. 2009. Assessing perceived consequentiality: Evidence from a contingent valuation survey on global climate change. International Journal of Ecological Economics and Statistics 14(P09), 14-29.
Schläpfer, F. 2006. Survey protocol and income effects in the contingent valuation of public goods: A meta-analysis. Ecological Economics 57, 415-429.
Schläpfer, F., Roschewitz, A., Hanley, N. 2004. Validation of stated preferences for public goods: a comparison of contingent valuation survey response and voting behavior. Ecological Economics 51(1-2), 1-16.
Vossler, C.A., Doyon, M., Rondeau, D. 2012. Truth in consequences: Theory and field evidence on discrete choice experiments. American Economic Journal: Microeconomics 4(4), 145-171.
Vossler, C.A., Evans, M.F. 2009. Bridging the gap between the field and the lab: Environmental goods, policy maker input, and consequentiality. Journal of Environmental Economics and Management. 58(3), 338-345.
Vossler, C.A., Kerkvliet, J. 2003. A criterion validity test of the contingent valuation method: Comparing hypothetical and actual voting behavior for a public referendum. Journal of Environmental Economics and Management 45(3), 631-649.
Vossler, C.A., Kerkvliet, J., Polasky, S., Gainutdinova, O. 2003. Externally validating contingent baluation: An open-space survey and referendum in Corvallis, Oregon. Journal of Economic Behavior and Organization 51(2), 261-277.
Table 1
Stated preference survey and public referendum voting results.
Public Referendum Survey, Full Sample Survey, Consequential Sample Survey, Inconsequential Sample
N % Yes N % Yes N % Yes N % Yes
Overall 8,166 53.53 478 50.68
(2.29) 370
57.41
(2.57) 91
25.60*** (4.60)
Precinct 1 2,153 59.78 85 63.29
(5.26) 67
66.15
(5.82) 11
33.30 (14.90)
Precinct 2 1,069 52.39 83 41.51
**
(5.44) 67
53.58
(6.14) 14
5.16*** (6.13)
Precinct 3 1,492 47.19 98 38.01
*
(4.93) 68
46.91
(6.10) 24
13.44*** (7.11)
Precinct 4 872 56.88 71 46.22
*
(5.96) 56
54.57
(6.71) 15
14.98*** (9.54)
Precinct 5 1,426 53.65 74 54.78
(5.83) 61
62.39
(6.25) 12
36.38 (14.51)
Precinct 6 1,154 48.44 67 47.58
(6.15) 51
52.71
(7.06) 15
37.31 (12.93)
Notes: Both the number of participants (N) and the percentage of “yes” votes are based on those who provided either a “yes” or “no” vote only. Survey vote percentages and standard errors are adjusted according to sampling weights.
*
Table 2
Description of data.
Variable Name Description Sample Mean
(Std. Dev.)
Tax Estimated annual increase in the participant’s
property taxes, in $ 19.87 (13.42)
College = 1 if participant has a college degree or higher 0.49 (0.50)
Income
Participant’s household income, in $1000s; the midpoint of the category chosen by the participant is used
82.98 (51.48)
Age Participant’s age, in years 57.59 (14.43)
Female = 1 if participant is female 0.55 (0.50)
Environmental = 1 if participant is currently a member of an
environmental organization 0.15 (0.36)
Historical = 1 if participant is currently a member of an
historical society 0.08 (0.28)
Internet = 1 if participant responded via the Internet 0.10 (0.30)
Days to Election Number of days between survey postmark (or
online submission) and Election Day 23.10 (14.75)
Media Coverage = 1 if survey returned 21 or fewer days prior to
Election Day 0.57 (0.50)
Inconsequential = 1 if participant indicated the survey would have
no influence on policy 0.18 (0.38)
Consequential = 1 if participant indicated the survey would have
some potential influence on policy 0.82 (0.38)
Consequential2
Likert-scale response to consequentiality question; 1 (“Not taken into account”) to 5 (“Definitely taken into account”)
2.64 (1.15)
Uncertain = 1 if participant indicated she was “very
uncertain” about her advisory referendum vote 0.06 (0.24)
Voted November 2008 = 1 if participant voted in November 2008
Election 0.94 (0.25)
Voted April 2010 = 1 if participant voted in April 2010 Election 0.36 (0.48)
Charity = 1 if participant gave to charity within the past 12
months 0.93 (0.26)
Table 3
Willingness-to-pay regressions.
Variable / Parameter
Full Sample: Model 1
Full Sample: Model 2
Consequential Sample: Model 3
College 6.62 11.24** 9.95**
(5.03) (5.67) (4.20)
Income 0.07 0.07 0.10***
(0.05) (0.05) (0.04)
Age 0.24 0.36* 0.34**
(0.19) (0.20) (0.15)
Female 7.11 6.48 3.26
(4.82) (4.92) (3.70)
Environmental 19.16*** 23.82*** 19.01***
(7.47) (8.41) (6.36)
Historical 3.47 2.76 5.16
(8.21) (8.68) (6.78)
Internet 5.05 0.57 1.68
(7.41) (7.80) (5.81)
Days to Election 0.19 0.13 0.02
(0.31) (0.32) (0.25)
Media Coverage 8.87 7.45 4.88
(9.08) (9.48) (7.25)
Inconsequential −35.93***
(9.92)
Constant −18.54 −19.19 −16.06
(18.41) (19.26) (14.18)
Scale (σ) 34.60*** 35.19*** 24.11***
(6.69) (7.16) (4.15)
Mean WTP, overall $21.79*** (2.30)
Mean WTP, Consequential $27.87*** (3.11) $25.42*** (2.09) Mean WTP, Inconsequential −$8.06 (8.27)
Log-Likelihood −256.13 −240.89 −191.49
McFadden’s R2 0.079 0.133 0.153
N 401 401 326
Table 4
Exploration of beliefs about consequentiality.
Variable
Model 4: Probit (Consequential)
Model 4:
Ordered Probit (Consequential2)
College −0.530*** −0.262*
(0.203) (0.154)
Income −0.240 e−3 −0.001
(0.002) (0.001)
Age −0.013 -0.003
(0.008) (0.005)
Female 0.148 0.133
(0.185) (0.132)
Environmental −0.244 −0.034
(0.250) (0.218)
Historical 0.035 0.354
(0.304) (0.288)
Internet 0.653* −0.020
(0.341) (0.165)
Days to Election 0.011 0.014
(0.013) (0.010)
Media Coverage 0.249 0.354
(0.395) (0.319)
Uncertain −0.716** −0.586*
(0.343) (0.333)
Voted November 2008 −0.193 −0.094
(0.184) (0.129)
Voted April 2010 0.344 0.496
(0.497) (0.330)
Charity 0.546 0.684***
(0.354) (0.203)
Constant 0.128 −0.820
(0.927) (0.666)
Log-Likelihood −167.68 −588.84
McFadden’s R2 0.090 0.029
N 412 412
Note:standard errors are in parentheses. *, **, and *** denote estimate is statistically different from zero at the 10%, 5%, and 1% significance levels, respectively. Estimated thresholds for ordered probit: μ1=0.897 (0.098); μ2=1.933