Georgia State University Georgia State University
ScholarWorks @ Georgia State University
ScholarWorks @ Georgia State University
Real Estate Dissertations Department of Real Estate
Summer 7-22-2010
An Examination of the Information Content of Funds from
An Examination of the Information Content of Funds from
Operations (FFO) Using Polynomial Regression and Response
Operations (FFO) Using Polynomial Regression and Response
Surface Methodology
Surface Methodology
Frank Gyamfi-Yeboah
Follow this and additional works at: https://scholarworks.gsu.edu/real_estate_diss
Part of the Real Estate Commons
Recommended Citation Recommended Citation
Gyamfi-Yeboah, Frank, "An Examination of the Information Content of Funds from Operations (FFO) Using Polynomial Regression and Response Surface Methodology." Dissertation, Georgia State University, 2010. https://scholarworks.gsu.edu/real_estate_diss/7
This Dissertation is brought to you for free and open access by the Department of Real Estate at ScholarWorks @ Georgia State University. It has been accepted for inclusion in Real Estate Dissertations by an authorized
i
Permission to Borrow
In presenting this dissertation as a partial fulfillment of the requirements for an advanced degree from Georgia State University, I agree that the Library of the University shall make it available for inspection and circulation in accordance with its regulations governing materials of this type. I agree that permission to quote from or to publish this dissertation may be granted by the author or, in his/her absence, the professor under whose direction it was written or, in his absence, by the Dean of the Robinson College of Business. Such quoting, copying, or publishing must be solely for scholarly purposes and does not involve potential financial gain. It is understood that any copying from or publication of this dissertation which involves potential gain will not be allowed without written permission of the author.
ii
Notice to Borrowers
All dissertations deposited in the Georgia State University Library must be used only in accordance with the stipulations prescribed by the author in the preceding statement.
The author of this dissertation is:
Frank Gyamfi-Yeboah
P.O Box UP 1238 KNUST
Kumasi, Ghana
The director of this dissertation is:
Dr. Alan Ziobrowski
Department of Real Estate
Georgia State University
35 Broad Street N.W. Atlanta, GA 30303
Users of this dissertation not regularly enrolled as students at Georgia State University are required to attest acceptance of the preceding stipulations by signing below. Libraries borrowing this dissertation for the use of their patrons are required to see that each user records here the information requested.
iii
AN EXAMINATION OF THE INFORMATION CONTENT OF FUNDS FROM OPERATIONS (FFO) USING POLYNOMIAL REGRESSION AND RESPONSE SURFACE
METHODOLOGY
BY
FRANK GYAMFI-YEBOAH
A Dissertation Submitted in Partial Fulfillment of the Requirements for the Degree
of
Doctor of Philosophy
in the Robinson College of Business
of
Georgia State University
GEORGIA STATE UNIVERSITY
ROBINSON COLLEGE OF BUSINESS
iv Copyright by
Frank Gyamfi-Yeboah
v
ACCEPTANCE
This dissertation was prepared under the direction of the candidate’s Dissertation Committee. It has been approved and accepted by all members of that committee, and it has been accepted in partial fulfillment of the requirements for the degree of Doctor in Philosophy in Business Administration in the Robinson College of Business of Georgia State University.
Dr. H. Fenwick Huss
Dean
Robinson College of Business
Dissertation Committee:
Dr. Alan Ziobrowski, Chair
Dr. Paul Gallimore
Dr. Lisa Schurer Lambert
vi
TABLE OF CONTENTS
LIST OF TABLES………. viii
LIST OF FIGURES………... x
ABSTRACT………... xi
CHAPTER ONE: INTRODUCTION……….. 1
Background……….. 1
Objectives of Dissertation……… 4
Contribution of Dissertation………. 4
Scope of Dissertation……… 7
Organization of Dissertation……… 9
CHAPTER TWO: LITERATURE REVIEW……….. 10
The Returns/Earnings Research……… 10
Trading Volume Earnings Research………. 13
Background of Funds from Operation……….. 16
FFO/Returns Studies………. 18
Hypotheses……… 20
CHAPTER THREE: DATA AND METHODOLOGY……….. 22
Data………... 22
Methodology………. 23
CHAPTER FOUR: RESULTS………. 31
vii
Information Content of FFO……….. 31
Information Content of FFO vs. Net Income………. 34
Institutional investors and Abnormal Trading Volume……….. 35
Robustness Checks………. 38
Dispersion in Analysts’ Forecast and Abnormal Trading Volume……… 41
CHAPTER FIVE: CONCLUSION AND FUTURE RESEARCH IDEAS……… 43
Conclusion………. 43
Future Research Ideas……… 44
viii
LIST OF TABLES
Table 1: Descriptive Statistics and Correlation among measures……… 47
Table 2: Abnormal Trading Volume around the announcement of FFO……… 48
Table 3: Abnormal Trading Volume around the announcement of FFO- Robustness……. 49
Table 4: Linear regression estimates of the association between FFO surprises and
cumulative abnormal trading volume ……… 50
Table 5: The Constrained Piecewise Linear Regression estimates of the association between
FFO surprises and cumulative abnormal trading volume ………. 51
Table 6: Unconstrained Polynomial Regression estimates of the association between FFO
surprises and cumulative abnormal trading volume……….. 52
Table 7: Comparison of FFO TO Net Income………. 53
Table 8: OLS regression estimates of the impact of institutional ownership on
abnormal trading volume………... 54
Table 9: OLS regression estimates of effect of transaction cost on the relation between
institutional ownership and abnormal trading volume……….. 55
Table 10: OLS regression estimates of association between institutional ownership type
and abnormal trading volume………... 56
Table 11: Abnormal Trading Volume around the announcement of FFO: 1997 – 1999….. 57
Table 12: Abnormal Trading Volume around the announcement of FFO: Robustness
1997 – 1999………... 58
Table 13: Linear regression estimates of the association between FFO surprises and
ix
Table 14: The Constrained Piecewise Linear Regression estimates of the association between
FFO surprises and cumulative abnormal trading volume: 1997-1999………. 60
Table 15: Unconstrained Polynomial Regression estimates of the association between FFO
surprises and cumulative abnormal trading volume: 1997-199.……….. 61
Table 16: OLS regression estimates of the association between institutional ownership
and abnormal trading volume: 1997-1999……… …….. 62
Table 17: OLS regression estimates of association between institutional ownership type
and abnormal trading volume: 1997-1999………... 63
Table 18: OLS regression estimates of association between institutional ownership type and abnormal trading volume after controlling for shifts in ownership patterns: 1997 – 1999………. 64
Table 19: OLS estimates of the relation between dispersion in analysts’ forecast and abnormal trading volume: 2004 – 2006……….. 65
x
LIST OF FIGURES
Figure 1: A graph showing how abnormal trading volume relates to actual and expected FFO in a three-dimension space……… 66
Figure 2: Graph showing the effect of price (transaction cost) on the relation between abnormal trading volume and the level of institutional ownership………67
Figure 3: Institutional Ownership in REITs: 2004 – 2006 68
xi ABSTRACT
AN EXAMINATION OF THE INFORMATION CONTENT OF FUNDS FROM OPERATIONS (FFO) USING POLYNOMIAL REGRESSION AND RESPONSE SURFACE
METHODOLOGY
By
FRANK GYAMFI-YEBOAH
JULY 22, 2010
Committee Chair: Dr. Alan Ziobrowski
Major Department: Real Estate
I examine the market reaction to the announcement of FFO by REITs using abnormal trading
volume as a gauge of investors’ reaction. I also address the question of whether FFO provides
more useful information to investors than net income. Lastly, I examine whether the quality of
private information among traders prior to the announcement of FFO affects the level of
abnormal trading volume.
Using three different specifications, I find that even though the announcement of FFO leads to
abnormal trading, there is no association between the level of abnormal trading volume and the
xii
measure of investor response, that FFO explains significantly more variance in abnormal returns
than net income suggesting that FFO provides more useful information than net income.
Lastly, I use the proportion of institutional holdings as a proxy for the number of informed
traders to predict the amount of abnormal trading volume. I find no significant relation between
abnormal trading volume and the proportion of institutional holdings. However, when I break
down institutional ownership into two broad classifications, I find that the level of abnormal
trading volume is significantly positively related to the holdings by mutual funds and investment
advisors but negatively related to the holdings of other institutions (pension funds
&.endowments, banks and insurance companies). This raises questions of whether the use of an
aggregate measure of institutional ownership is appropriate in studies that examine the effect of
- 1 -
CHAPTER ONE
Background
Finance and Accounting theories suggest investors use earnings information in the valuation of
stocks. Most of the valuation models assert that the value of stock should relate to its earnings
capacity. It is, therefore, no surprise that earnings information remains highly sought after by
investors. As a consequence, researchers have, over the past four decades, hypothesized a strong
relationship between earnings and stock prices. The results from such studies, however, often
show a weak relationship.
The fundamental question addressed in a majority of the past studies is whether a significant
relationship exists between the announcement of unexpected earnings and any observed
abnormal returns around the announcement date. The premise of this question is that if financial
markets are efficient and earnings information is indeed central to the pricing of stocks, then the
announcement of unexpected earnings should lead to stock repricing. The apparent disconnect
between the strong relationship posited in most studies and the weak empirical relationship
observed between unexpected earnings announcements and abnormal returns remains a puzzle.
A number of explanations have emerged to explain the weak empirical relationship including the
possibility of a misspecification of the equation estimating the returns/earnings relationship.
Much of the effort at improving the specification has focused on either using alternative earning
metrics such as net income or using a non-linear specification. Notwithstanding these attempts,
- 2 -
A related question is whether the relation between stock price changes and unexpected earnings
captures only some aspects of investors’ reaction to the information content of earnings
announcements. Lev (1989) argues that “stock price change is, of course, a restricted indicator of
information usefulness, since in a heterogeneous belief setting; investors might use the
information without the price being changed”. This line of reasoning suggests that other
indicators of investors’ behavior such as volume of trading may reflect more fully the reaction of
investors to the announcement of unexpected earnings. A number of studies including Bamber
(1986), Atiase and Bamber (1994) and Utama and Cready (1997) have used trading volume to
assess the information content of EPS and documented significant market reaction following
earnings announcement.
The peculiar nature of real estate investment trusts (REITs) necessitated the introduction of
additional performance metrics in addition to the traditional earnings per share (EPS) metric used
for industrial stocks. Although the most widely publicized metric in the REIT industry is funds
from operations (FFO), legitimate questions have been raised as to whether FFO provides
superior information to investors compared to other metrics such as net income. It has, for
instance, been argued that since FFO is unaudited it may be subject to manipulation by
management. Such a possibility can raise serious doubts about its credibility in investors’ minds.
Fields, Rangan and Thiagarajan (1998) document evidence that suggests FFO may not
necessarily be more useful than net income and find that the superiority of one over the other is
- 3 -
to be relatively more informative than net income, the difference in the usefulness between the
two measures was not statistically significant.
Most previous research uses a difference score (expected FFO minus actual FFO) as a proxy for
unexpected FFO in regression analyses to predict abnormal returns or abnormal trading volume.
However, in a recent study by Gyamfi-Yeboah, Ziobrowski and Lambert (2009), this approach is
shown to be misspecified. The authors present an alternative approach that uses expected and
actual FFO as separate variables and includes their interaction and higher order terms in the
analysis. They test the constraints imposed by the traditional specifications and find that the
constraints are not empirically supported.
Using this approach, I examine the information content of FFO with specific emphasis on the
strength of the relationship between unexpected FFO announcements and abnormal trading
volume around the announcement dates. Also, I assess the information content of net income and
address the question of whether FFO offers greater information content to investors than net
- 4 -
Objectives of the Dissertation
My main objective in this dissertation is to examine the information content of FFO to investors
using a polynomial regression and response surface methodology, an approach that addresses the
problems associated with earlier studies such as constrained relationships. Specifically, I seek
answers to the following questions:
• Is the announcement of unexpected FFO followed by abnormal trading?
o Is the abnormal trading stronger for positive or negative surprises?
• Does a difference in the quality of private information among traders prior to the
announcement of FFO affect the level of abnormal trading volume?
• Is FFO more informative to investors than net income?
Contribution of the Dissertation
I extend the literature in several significant ways. First, I apply an alternative approach,
polynomial regression and response surface methodology, to examine the information content of
FFO. This approach, unlike those used in prior studies, does not collapse the conceptually
distinct variables that make up unexpected FFO (i.e. expected and actual FFO) into a single
construct. Rather, it uses them as separate independent variables in addition to the interaction and
higher order terms. It must be stressed that collapsing actual and expected FFO into a single
measure (a difference score) implies the implausible assumption that the market reacts the
similarly to a situation where actual FFO exceeds expected FFO (a positive surprise) as it does
- 5 -
have been widely adopted in the literature, are prone to serious methodological issues (See
Cronbach (1958), Edwards (2001) and Edwards (2002),). These issues include reducing a
three-dimensional relationship into two dimensions and imposing untested restrictions on
relationships. Polynomial regression, on the other hand, provides an opportunity for the
constraints imposed by difference scores to be tested empirically and presents the relationship
between the variables in three dimensions.
My second contribution to the literature is to test Kim and Verrecchia’s (1991) hypothesis that
when there is a differential in the precision of private information held by traders, the
announcement of new information will cause “differential belief revision” among the traders and
lead to abnormal trading volume. The authors note that “relatively better informed traders revise
their beliefs less because the new information is relatively less important to them than to those
who are more poorly informed”. In other words, the level of abnormal trading following the
announcement of unexpected FFO will be less for REITs with more informed investors prior to
the announcement. To test this hypothesis, I follow Kim, Krinsky and Lee (1997) and Utama and
Cready (1997) and use the level of institutional ownership as a proxy for the extent of the
differential in the quality of private information among traders. I argue that institutional investors
are less likely to differ in the precision of their privately held information than individual
investors. Thus, REITs with higher levels of institutional ownership are more likely to have
lower levels of abnormal trading. In contrast to the predictions above, Kim, Krinsky and Lee
(1997) examine the relationship between abnormal trading volume and institutional ownership
- 6 -
relationship between trading volume and the level of institutional ownership is quadratic and that
this relationship is negative when institutional ownership is high. Since the early 1990s, REITs
have, on average, tended to have higher concentrations of institutional ownership than other
stocks (Chan, Leung and Wang, 1998). Also, the REIT operating environment differs from other
firms due to high transaction costs and lower information production (Devos, Ong, and Spieler
(2007) and Downs and Guner (1999)). Furthermore, Downs and Guner (1999) find that the
information flow in the real estate securities market may be as deficient as in the underlying real
estate asset. As a result, private informational advantage among REIT investors might be more
pronounced than among industrial stock investors. The characteristics of REITs and their unique
operating environment provide a good setting to test Kim and Verrecchia’s (1991) hypothesis.
Finally, I explore the question of whether FFO is more useful to investors than net income within
the context of how investors react to the unexpected announcement of the two performance
metrics. Fields, Rangan and Thiagarajan (1998) assess the usefulness of FFO and net income by
analyzing the association of FFO and net income with operating cash flow and current stock
prices. However, similar to Gore and Stott (1998), I examine the relative usefulness of the two
measures by exploring how investors react to the announcement of either unexpected FFO or net
income. It is important to stress that the sample used by Gore and Stott (1998) covered the period
from 1991 to 1996, prior to the National Association of Real Estate Investment Trusts’
(NAREIT) major review of the calculation of FFO in 2000, which was aimed at improving its
uniformity and reliability. Baik, Billings and Morton (2008) document evidence that suggests the
- 7 -
whether FFO has become more useful than net income following the changes NAREIT
introduced in 2000.
Scope of the Dissertation
The majority of the empirical work examining the relation between earnings and returns has
focused on assessing the information content of GAAP earnings metrics; particularly earnings
per share (EPS). The introduction of a non-GAAP metric such as FFO by NAREIT in 1991 for
the REIT industry provides a natural extension to the earnings/returns research. The primary
question addressed in these studies is the extent to which new measures such as FFO are useful
to investors. A number of studies (Gore and Tott (1998); Graham and Knight (2000); Stunda and
Typpo (2004); Baik, Billings and Morton (2008)) have addressed this question in the context of
the REIT industry. But as noted already, the approach adopted in all of these studies suffers from
serious methodological issues, which may mask the relationship between FFO and returns. Using
polynomial regression and response surface analysis, which place no constraints on these
relationships, this study examines the information content of FFO by carrying out two
interconnected empirical investigations.
First, I examine the information content of FFO by assessing the strength of the relationship
between unexpected FFO and abnormal trading around the announcement date. I choose to use
abnormal trading for two reasons; first, trading volume is more likely to reflect more fully the
- 8 -
insights regarding the usefulness of FFO to investors. Second, using trading volume allows for
the test of Kim and Verrecchia’s (1991) hypothesis which states that the level of abnormal
trading following the announcement of an unexpected FFO will be less for REITs with more
informed investors
Secondly, I examine whether FFO is more useful to investors than alternative measures such as
net income. Although, this issue has previously been addressed in the literature, there are still a
number of unresolved questions. Neither Fields et. al (1998), Vincent (1999) nor Gore and Stott
(1998) provide definite conclusion on the superiority of FFO over net income. Also, NAREIT’s
decision to revise the definition of FFO and provide more clarity in 2000 may have altered
investors’ views of the two metrics. Therefore, addressing the question in a post-2000 period has
the potential to provide new insights.
I limit this study to equity REITs, defined as REITs that invest in income-producing real estate
and derive at least 75% of their revenues from such properties. I focus on equity REITs because
depreciation, which is one of the most significant items excluded in the calculation of FFO, is
unlikely to be substantial for Mortgage or Hybrid REITs. As a result, I expect the difference in
investors’ perception of FFO versus net income to be more pronounced in equity REITs than
either mortgage or hybrid REITs.
- 9 -
Organization of the Dissertation
The rest of the study is organized as follows. The next chapter reviews the relevant literature.
Chapter 3 describes the data and presents the methodology while chapter 4 presents the results.
- 10 -
CHAPTER TWO
LITERATURE REVIEW
This chapter presents a review of the extant literature. The first part discusses studies that have
examined the relationship between earnings and returns. The second part reviews studies that
have focused on examining the information content of earnings but within the context of how
trading volume responds to unexpected earnings announcements. The third and fourth sections
present the background of FFO and studies that have examined the information content of FFO,
respectively, while hypotheses are presented in the last section.
The Returns/Earnings Research
The research assessing the information content of earnings is extensive and dates back to the
pioneering work of Ball and Brown (1968) and Beaver (1968). Most of this research centers on
the extent to which earnings metrics produced by the accounting profession are useful to
investors and also to test the efficient market hypothesis. Much of the research prior to the 1990s
focused on measurement issues for both return and earnings. On the return side, Haggerman,
Zmijewski and Shah (1984), Wilson (1986), and Bowen and Daley (1987) use abnormal returns
as a proxy for the return variable, while Beaver, Lambert and Ryan (1987) and Jacobson (1987)
use raw returns. Measures for the earnings variable include earnings per share (EPS)
(Haggerman et al, 1984; Hopwood and McKeown, 1985; Lipe, 1986; Hughes and Ricks, 1987)
and net income (Beaver, Griffin and Landsman, 1982). Despite some use of alternative measures
- 11 -
Lev (1989) reviews and summarizes the findings of research focused on assessing the usefulness
of earnings over the period 1980 – 1988. The major finding of this review is that the correlation
between earnings and stock returns is low and the nature of the returns/earnings relationship was
unstable over time. The small variance in returns explained by earnings is also relatively
insensitive to the choice of the length of the return window. For instance, for windows of 2 to 5
days, the variance in abnormal returns explained by unexpected earnings ranged from 2% to 5%
and for windows of 3 months to 2 years unexpected earnings explained only 4% to 7% of the
variance in abnormal return. Lev (1989) identifies a number of reasons that might explain the
lack of a strong relation between earnings and returns and suggests a possible misspecifiation of
the returns/earnings equation.
Cheng, Hopwood and McKeown (1992) examine the specification of the cross-sectional,
ordinary least square models and find that severe specification problems exist in the linear
regression models. Specifically, they find the most pronounced misspecification problem to be
the assumption of linearity. Although Cheng et al reject the linear specifications used in prior
research, they provide little guidance on alternative models that might allow for curvilinear
relationships or would address the problems associated with traditional approaches. Freeman and
Tse (1992) also argue that “transitory earnings surprises should have less impact on security
prices than permanent earnings surprises”. This line of reasoning also suggests that the
returns/earnings relationship is curvilinear. Even though Cheng et al (1992) and Freeman and
Tse (1992) provide a strong case to re-examine the specification of the returns/earnings
- 12 -
earnings minus expected earnings) to predict abnormal returns. In a recent study,
Gyamfi-Yeboah et al (2009) adopt an alternative specification with REIT returns using expected and
actual FFO as separate variables and include interaction and higher order terms to test the
constraints imposed by the approach frequently adopted in previous research. The authors show
that the constraints imposed by the models used in prior research are not supported and provide
evidence that these models are misspecified.
An area of inquiry that has received little attention is whether the market responds equally to
situations where actual earnings exceeds expected earnings ( a positive surprise) as it does when
actual earnings are less than expected earnings (a negative surprise). Schipper (1991)
summarizes evidence from several empirical studies that shows that analysts, on average, tend to
be optimistic in their forecasts.If investors are aware of the bias there should be stronger market
responses to positive surprises than negative surprises for the same absolute unexpected earnings
announcements (Freeman and Tse (1992)). This reasoning implies that price responses to
unexpected earnings announcements could be asymmetric, which is contrary to assumptions
made in most previous studies. In a more recent study, however, Brown (2001) finds that the
median earnings surprise was negative in the eighties, zero in the early nineties and positive in
the mid to late nineties. This suggests that if the bias in analysts’ forecasts is the sole explanation
for an asymmetric response to earnings surprises then the pessimistic bias in analysts’ estimates
in the late nineties should lead to stronger market reaction to negative surprises. Basu (1997)
provides an alternative explanation for the asymmetric market reaction to earnings surprises
- 13 -
anticipate bad news and to usually regard it as a one-time earnings shock. In contrast, good news
is recognized gradually over an extended period of time. Thus, the market recognizes positive
earnings surprises as more persistent than negative earnings surprises. As a result, market
reaction will be stronger for positive than negative surprises.
The results from the few studies that have hypothesized an asymmetric response to unexpected
earnings announcement are mixed. Freeman and Tse (1992) hypothesize a stronger response for
positive surprises but find no empirical support. Conrad, Cornell and Landsman (2002) find that
the market’s response to a negative surprise is stronger than the response to a positive surprise.
Skinner and Sloan (2002) find a similar result to Conrad, Cornell and Landsman (2002), but
show that the asymmetrical response holds only for growth stocks. Bartov, Givoly and Hayn
(2002) and Lopez and Rees (2002), on the other hand, provide evidence that the rewards for
firms that beat analyst forecast is higher than the penalty for those that fail to meet market
expectations.
Trading Volume/Earnings Research
Trading volume has received considerable attention as an alternative to using the
returns/earnings relationship to examine the information content of earnings. The advocates for
using trading volume in addition to returns argue that the relationship between stock price
changes and unexpected earnings captures only some aspects of investors’ reactions to the
- 14 -
information without necessarily causing a price change. Beaver (1968) discusses a number of
scenarios where reaction to new information may be observed in either price or trading volume
but not both. He also argues that even when a reaction is observed in both measures, the response
may not be equal. Although findings in a number of empirical studies based on trading volume
have not differed significantly from those based on security prices, there is no reason to expect
that studies comparing both measures would yield identical results (Bamber (1986). Morse
(1980) documents results that suggest that trading volume responses to the announcements of
earnings is more pronounced than price response. Bamber and Cheon (1995) provide evidence of
substantial differences in trading volume and price reactions around earnings announcements.
They conclude that such different reactions suggest that “trading volume-based research has the
potential to yield insights beyond that attainable through-price-based research”.
Kim and Verrecchia (1991) argue that traders with better predisclosure private information react
less to new information than those who are more poorly informed. Moreover, it is the existence
of a differential in the quality of available information that creates abnormal trading volume. A
number of studies have tested this hypothesis using various proxies for the differential in the
quality of private information available to investors prior to earnings announcements. Atiase and
Bamber (1994) use the dispersion in analysts’ forecasts and the range across the most optimistic
and the most pessimistic analyst EPS forecasts as proxies and find support for the Kim
-Verrecchia (KV) hypothesis. They note a number of limitations with their proxies including the
fact that the proxies reflect divergent expectations among analysts and not differences in the
- 15 -
Lee (1997) and Utama and Cready (1997) use the level of institutional holdings as a proxy.
Contrary to the theoretical prediction, Kim et al (1997) find a significant positive relationship
between abnormal trading volume and the level of institutional holdings. In a similar study that
allows for nonlinearity in the relation, Utama and Cready (1997) show that the association
between trading volume and the level of institutional ownership is quadratic and that the relation
is negative in the high institutional ownership range. Specifically, they find the point of
inflection to be about the 50% level of institutional ownership for their sample. This suggests
that the impact of a differential in the quality of private predisclosure information on the levels of
abnormal trading as predicted by the KV hypothesis might hold in samples with higher
institutional holdings. Ali, Klasa and Li (2008) argue that institutions holding small stakes are
unlikely to devote significant resources to gather private information and it might therefore be
erroneous to treat such investors as well informed relative to individual investors. Furthermore,
institutions with high ownership generally do not trade around earnings announcements since
they are usually dedicated investors or face regulatory restrictions1. Ali et al (2008) therefore
propose a refined measure of institutional ownership that treats institutions with medium
holdings as investors with better predisclosure private information who are likely to trade around
the announcement of earnings. They confirm the inverted U-shaped relationship between the
levels of institutional holdings and abnormal trading surrounding earnings announcement
documented in Utama and Cready (1997).
1
- 16 -
Background of Funds from Operation (FFO)
The unique nature of REITs necessitated the introduction of FFO by the National Association of
Real Estate Investment Trusts (NAREIT) in 1991 as a supplementary performance measure.
NAREIT’s rationale for advocating such a measure was that depreciation, which forms part of
GAAP earnings measures, was very substantial for equity REITs. Since depreciation is not an
actual cash expense, its inclusion had the effect of distorting the true performance of REITs. The
original definition of FFO stated that depreciation and amortization should be added back to
consolidated net income. The definition has since been clarified in 1995, 1999 and 2002.
It is apparent from various statements issued by NAREIT that its original purpose in promoting
FFO was quite modest. For instance, it states in its 2002 white paper that “the original intent was
that FFO be used for the sake of determining a supplemental capitalization multiple similar to a
P/E ratio” and that “FFO was not intended to be used as a measure of the cash generated by a
REIT nor of its dividend paying capacity”.
Since its introduction in 1991, the definition of the FFO measure has been revised a number of
times. The changes made in 1995 to exclude nonrecurring items had unintended consequences as
it created an opportunity for management to exercise discretion in what items it chose to add or
exclude. The fact that FFO is an unaudited measure makes it impossible to detect any
manipulations and raises serious doubts in the minds of some investors about its reliability
(Martinez, 1998). NAREIT responded to these concerns by establishing a Best Financial
Practices Council to provide recommendations on how best to improve the uniformity and
- 17 -
Bulletin issued on November 8, 1999 to include both recurring and nonrecurring items, effective
January 2000. The National Policy Bulletin further clarified items that should be excluded from
the calculation of FFO.
Even though FFO is generally recognized by both REITs and investors, NAREIT concedes in a
white paper issued in 2002 that greater guidance and interpretation was still needed. One area
that remained ambiguous was the items firms could include as amortized items. The purpose of
the 2002 white paper was to address such problems. In its National Policy Bulletin issued in
February, 2004, NAREIT noted that to “enhance usefulness and effectiveness of FFO” it was
accepting the recommendations of the Best Financial Practices Council to develop “best
practices” disclosures models. Such models are aimed at advancing consistency in financial
reporting among REITs.
It is evident from the foregoing discussion that FFO has evolved with a number of modifications
since its introduction in 1991. Most of the changes have been in response to concerns of
investors and analysts about the lack of consistency and uniformity in the calculation and
reporting of FFO. The current definition per NAREIT’s white paper in 2002 is as follows:
“Funds from Operation means net income (computed in accordance with generally
accepted accounting principles), excluding gains (or losses) from sales of property, plus
depreciation and amortization and after adjustments for unconsolidated partnerships and
- 18 - FFO/Returns Studies
Relative to studies examining the information content of EPS, the research on the usefulness of
FFO is less extensive. Vincent (1999) examined the information content of EPS versus FFO.
using a model based on analysts’ forecasts. The results show no significant relationship between
unexpected FFO and cumulative abnormal returns over both short and long-term windows.
Similarly, Gore and Stott (1998) provide evidence suggesting unexpected FFO is not related to
abnormal returns over the short run. Using annual return windows, Stunda and Typpo (2004)
find a significant relationship with FFO and EPS as independent variables and abnormal returns
as the dependent variable. However, it is impossible to solely assess the information content of
FFO because Stunda and Typpo (2004) include both EPS and FFO in their regression.
Higgins, Ott and Ness (2006) examine the market’s response to the FFO changes introduced in
2000 and find no significant reaction, suggesting that investors’ perceptions of FFO may not
have been altered significantly. However, in a more recent study, Baik, Billings and Morton
(2008), use a sample covering the period 1995 - 2003 and provide evidence that suggests the
information content of FFO has significantly increased since 2000 and investors perceive less
manipulation and greater reliability.
A related line of research examines the question of whether FFO is more useful than net income.
This question arises out of the claim that FFO is superior to net income because it reflects more
accurately the performance of REITs. However, since FFO is unaudited and only an
- 19 -
traditional GAAP measures. Fields, Rangan and Thiagarajan (1998) assess the relative
usefulness of FFO and net income by analyzing the association of FFO and net income or
operating cash flows and current stock prices. They find that FFO may not be more useful than
net income and that the superiority of one over the other depends on whether usefulness is
defined as the ability of the two measures to explain subsequent operating performance or
contemporaneous stock prices. In a similar study, Gore and Stott (1998) conclude that although
FFO appears to be more informative than net income, the difference was not statistically
significant. Vincent (1999) also examines the relative information content of EPS, FFO, cash
from operations (CFO) and earnings before interest, taxes, depreciation and amortization
(EBITDA) and concludes that there is no greater information content in FFO compared to the
other three measures. The author argues that the lack of consistency in the computation of FFO
across REITs and the fact that FFO is not audited may explain why investors still rely on EPS
even though it has been shown not to correctly reflect REIT performance. Graham and Knight
- 20 -
Hypotheses
Based on the assertions of the efficient market hypothesis and evidence from a number of
empirical studies, I hypothesize the following:
H1: There is a significant positive relationship between unexpected FFO and abnormal trading
volume around the announcement date.
H2: The market response to positive FFO surprises is stronger than responses to negative
surprises
The evidence documented in the literature suggests that analysts tended to be optimistic in their
forecasts prior to the late nineties (Devos et al (2007), Brown (2001)). However, this tendency
has dissipated in recent years, suggesting a symmetric response to positive and negative
surprises. However, the conservatism argument put forward by Basu (1997) would suggest a
stronger reaction to positive than negative surprises. Notwithstanding the mixed results in
previous studies, the evidence seems to support an asymmetric response.
H3: The relationship between unexpected FFO and abnormal trading volume should be stronger
than the association between unexpected NI and abnormal trading volume.
In January of 2000, NAREIT implemented guidelines aimed at ensuring the uniformity and
reliability of FFO. Additionally, the SEC introduced rules in 2003 that impose stricter controls
over FFO. These measures should make FFO more reliable and less susceptible to manipulation.
- 21 -
accurate measure of REIT operating performance, I expect FFO to be more useful to investors
than net income.
H4: REITs with higher institutional holdings will have less abnormal trading volume than those
with low institutional holdings.
Since abnormal trading volume may be the result of a differential in the quality of private
information available to traders prior to the announcement of an unexpected FFO (Kim and
Verrecchia (1991)), I expect abnormal trading volume to be lower for REITs with higher
- 22 -
CHAPTER 3
Data and Methodology
Data
I use the Institutional Brokers’ Estimate System (IBES) database to identify REITs with
unexpected FFO and Net Income (NI) during the periods January 1997 to December 1999 and
January 2004 to December 2006. I use the two periods to enable me to compare the information
content of FFO before and after the changes made by NAREIT to the definition of FFO and also
to ensure the robustness of the findings. The IBES database provides information on analysts’
forecasts of FFO and NI and actual FFO and NI for REITs listed on the New York Stock
Exchange (NYSE) and the American Stock Exchange (AMEX). Daily return and trading volume
data are derived from the Center for Research in Security Prices (CRSP) database. I obtain data
on institutional holdings from CDA/Spectrum 13(f) institutional stock holdings, which are
published quarterly.
Prior to analyzing the data, each of the independent variables is centered at the mean of their
means. As noted by Lambert, Edwards and Cable (2003), such a procedure facilitates the
interpretation of results. Furthermore, the data is screened for outliers and influential cases.
Following Fox (1991), I use leverage, Cook’s D statistic, and standardized residuals from the
quadratic regression equation. Three observations that exceed the minimum cut off on all three
- 23 -
Methodology
I use the event study methodology to derive the excess returns around an FFO or NI
announcement. Daily excess returns around the event date will be calculated based on the
value-weighted daily return data from the CRSP. I calculate the cumulative excess return based on
three different event windows: 2, 3 and 5 days around the date of the announcement using an
estimation period of 250 days ending 20 days prior to the event.
Two alternative measures will be used to estimate abnormal trading volume around an
announcement of an unexpected FFO or Net Income announcement. First, I follow Chae (2005)
and calculate abnormal trading volume as follows:
Abnormal Volume=LogTurnover -LogNormal Turnover (1)
Where Log Turnover =
t i, t i, Shares g Outstandin Volume Trading Log
Log Normal Turnover =
∑
=− − = 11 t 40 t Turnover Log 30 1Second, I calculate abnormal trading volume based on the market model estimated using the
CRSP value-weighted index over a 30-day estimation period2 ending 11 days prior to the
announcement.
2 To ensure that results are robust, alternative specifications using different estimation periods are used and the
- 24 -
I test hypotheses 1, 2, & 3 using two variations of the traditional difference score approach and
compare them to the polynomial regression and response surface analysis approach. First,
following tradition, I create a difference score between actual and expected FFO and estimate a
regression using the difference score as a predictor. Second, I apply piecewise linear regression
in an effort to estimate the predicted asymmetrical response. Third, I estimate an unconstrained
polynomial regression equation using actual FFO and expected FFO as separate predictors, plot a
three-dimensional response surface and test the features of the response surface.
The Constrained Linear Approach
Traditionally, the Trading volume/FFO relationship has been modeled as follows:
=β +β − +
∑
= α +ε k i i D Y X CAT 1 10 ( ) (2)
Where CAT is the cumulative abnormal trading volume around the announcement day, (X - Y) is
the algebraic unexpected FFO deflated by some measure3 such as share price, X is actual FFO
and Y is expected FFO. D represents year dummies. Expanding equation (2) results in the
following:
ε α β
β
β + − + +
=
∑
= k i i D Y X CAT 1 1 10 (3)
3
- 25 -
Note that the model specified in equation (2) is a constrained version of a model that uses both
expected and actual FFO, which can be expressed as follows:
=β +β +β +
∑
α +ε = k i i D Y X CAT 1 2 10 (4)
Comparing equation (3) to equation (4) reveals that equation (2) constrains the coefficients in
(2) to be of the same magnitude but opposite in sign (i.e.β1 =−β2). However it allows for no
empirical test on whether such an assumption is supported.
The Constrained Piecewise Linear Model
I use piecewise regression according to the principles recommended by Neter et al (1996) to test
for asymmetric response. First, I create a variable Z, which is set equal to 0 for positive surprises
but 1 otherwise. I then use the following equation:
=β +β − +β − +
∑
α +ε= k i i D Z Y X Y X CAT 1 2 1
0 ( ) ( ) (5)
Where CAT, X and Y are as defined before.
A negative and significant coefficient on β2would indicate a weaker response to negative than
positive surprises. Accounting for asymmetric responses using the piecewise regression approach
implies that the relationship between cumulative abnormal returns and unexpected FFO follows a
- 26 -
elsewhere. Specifically, I expect the slope to be stronger for positive surprises than negative
surprises.
Polynomial Regression and Response Surface Analysis: The Unconstrained Approach
I test for the joint effect of expected and actual FFO on cumulative abnormal returns by
estimating an equation that uses each variable separately and includes their squared and product
terms to capture possible curvilinearity and asymmetry in market reaction to unexpected FFO
announcement. Our model of interest, which is the unconstrained quadratic regression, has the
following form;
β β β β β β
∑
α ε= + + + + + + + = k i i D Y XY X Y X CAT 1 2 5 4 2 3 2 1
0 (6)
Where CAT is the cumulative abnormal return, X represents actual FFO, Y is the mean analyst
estimate and D represents year dummies. Equation (5) allows for the returns-FFO relationship to
be plotted in a three dimensional space enabling the examination of how the market reacts to
FFO announcements under three different scenarios; (1) actual FFO is higher than expected
FFO; (2) actual FFO is lower than expected FFO and (3) actual FFO is equal to expected FFO.
I examine the shape of the surface along the misfit line, which is defined by values where
X=-Y. The shape along the misfit line captures the market reaction to unexpected FFO
announcements, and is analogous to the unexpected earnings response coefficients in the
- 27 -
CAT =β0 +(β1−β2)X +(β3−β4 +β5)X2 +ε (7)
The term (β3 −β4 +β5)represents the curvature of the surface along the misfit line while the
term (β1 −β2)represents the slope of the surface along the misfit line both calculated at the
point where X and Y equal the mean of their means.
Secondly, I examine the shape of the surface along the fit line, which represents the line along
which expected and actual FFO are equal. The fit line is defined by values where X = Y and
substituting this into equation (8) yields the following:
CAT =β0 +(β1+β2)X +(β3 +β4 +β5)X2 +ε (8)
The term (β3 +β4 +β5)represents the curvature of the surface along the fit line while the term
)
(β1+β2 represents the slope of the surface along the fit line at a point where X and Y equal the
mean of their means.
Figure 1 illustrates how the actual FFO and expected FFO relate to cumulative abnormal trading
volume in a three-dimensional space. The vertical axis shows the cumulative abnormal trading
volume while actual and expected FFO are represented on the x-axis and y-axis respectively. The
misfit line (i.e. X = -Y) runs from the left corner to the right corner of the XY plane. The shape
along the misfit line shows market responses when actual FFO deviate from expected FFO. The
- 28 -
(negative surprises) while the right side of the graph indicates responses where actual exceeds
expected FFO (positive surprises). The shape along the fit line (i.e. X = Y), which runs the near
corner to the far corner, shows market responses when actual and expected FFO are equal.
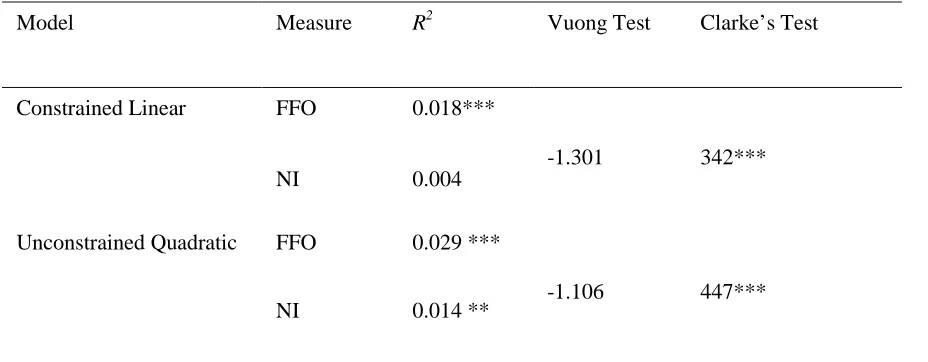
Test for hypothesis 3 requires an estimation of equation (8) using expected and actual Net
Income in place of FFO and comparing the variance explained to that obtained when the FFO
variables are used. I use the Vuong likelihood ratio to test whether the R2 of the FFO model is
statistically different from the NI model. A significantly larger R2 for the FFO equation will
indicate a higher information content of FFO than NI providing support for hypothesis 3. Clarke
(2007) shows that when the distribution of the log-likelihood ratios used in the Vuong test is
highly peaked, an alternative distribution-free test provides a more efficient test. Since I do not
know, a priori, the distribution of the log-likelihood ratios, I also use Clarke’s simple
distribution-free test in testing for difference between the two models.
Testing for an Asymmetric Response (Hypothesis 2)
Hypothesis 2 predicts stronger responses for positive surprises than negative surprises. To test
this hypothesis using the unconstrained curvilinear model, I re-center each variable both at one
standard deviation above its mean and one standard deviation below its mean. I calculate the
slope for negative surprises by first estimating equation (7) using the actual FFO variable
centered at one standard deviation below its mean and the expected FFO variable at one standard
- 29 -
the slope for positive surprise by estimating equation (7) using the actual FFO variable centered
at one standard deviation above its mean and the expected FFO variable at one standard
deviation below its mean and then calculate the slope using equation (8). Next, to test whether
the absolute value of the slope for positive surprises is significantly greater than the slope for
negative surprises, I apply bootstrapping procedures to empirically derive the sampling
distribution and then construct confidence intervals around the difference in slopes. I draw 1000
bootstrap samples and use the bias corrected percentile method suggested by Stine (1989) to
construct the confidence intervals.
Test of Hypothesis 4 (Kim and Verrecchia Hypothesis)
To test whether REITs with higher institutional holdings have less abnormal trading than those
with low institutional holdings I estimate the following equation:
ε α β β β
∑
= + + + + = k i i D Z IO CAT 1 7 6 0 (9)Where IO is the percentage of institutional ownership in a REIT and Z is a vector of control
variables including firm size, absolute cumulative abnormal return around the announcement
date, and stock price. Prior studies (Ali et al (2008), Utama and Cready (1997), Atiase and
Bamber (1994)) have identified these variables to be significantly related to abnormal trading
volume. A significant negative coefficient on IO will indicate support for hypothesis 4. Since Ali
et al (2008), Utama and Cready (1997) document evidence of nonlinearity in the relationship
- 30 -
the square of IO to test whether the inverted U-shaped relationship documented in these studies
hold in samples with high institutional holdings.
As documented in prior studies, I expect the coefficient on size to be negatively related to
abnormal trading. This expectation is based on the premise that larger firms have greater
predisclosure information making their FFO announcement less informative (Ali et al (2008),
Utama and Cready (1997), Atiase and Bamber (1994)). Kim and Verrecchia (1991) hypothesize
a positive relationship between abnormal trading and absolute abnormal return around the
announcement date. This, coupled with the empirical evidence in a number of studies, leads me
to expect a positive and significant coefficient on absolute abnormal returns. Ali et al (2008),
Utama and Cready (1997) use stock price to control for the effect of transaction costs on trading
volume at the announcement of earnings They posit and find a positive relationship between
price and abnormal trading volume. I therefore expect to find a positive relationship between
- 31 -
CHAPTER FOUR
RESULTS
Descriptive Statistics
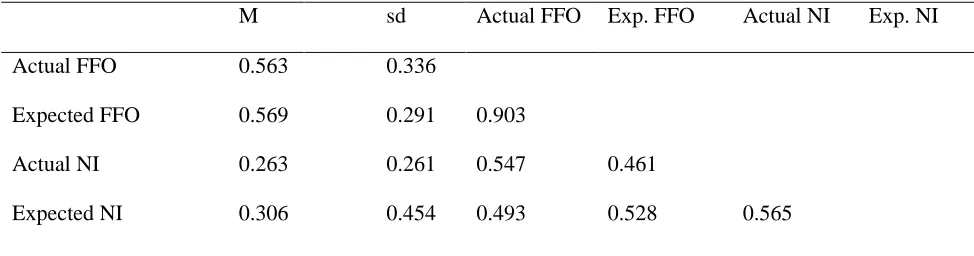
Table 1 presents the descriptive statistics and correlations of the measures. The table shows that,
on average, analysts’ forecasts of FFO tend to be higher than actual FFO announced by REITs.
Analysts’ forecasts of net income (NI) also tend to be higher than the actual. Correlation between
actual FFO and analyst estimates of FFO is 0.90 indicating that higher estimates are followed by
higher actual FFO. The correlation between actual NI and analyst estimates is only 0.565
indicating that higher estimates of NI are not necessarily followed by higher actual NI. The mean
number of analysts forecasting FFO and NI is 8 and 3 respectively. The fact that more analysts
provide estimates of FFO than NI suggests that investors have a greater demand for FFO.
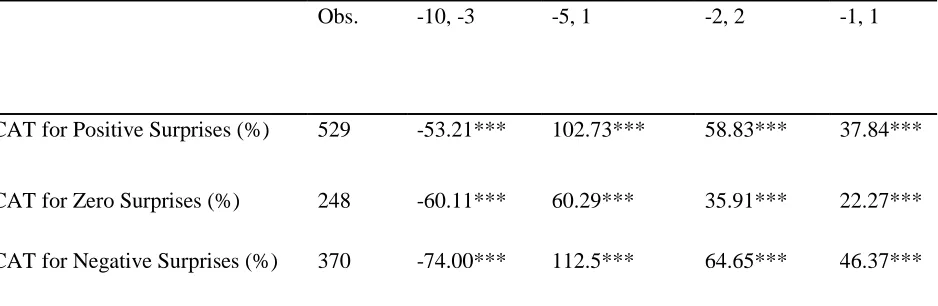
FFO Announcements and Abnormal Trading Volume
Tables 2 and 3 present the abnormal trading volume generated on the announcement of FFO by
REITs based on two alternative definitions. As the results show, for all windows used, there is
significant abnormal trading volume around the announcement dates. This suggests that the
market engages in significantly more trading when REITs announce FFO irrespective of whether
it misses, meets or beats the consensus forecast by analysts. The table also shows that the level of
trading prior to the announcement of FFO is negative and significant in the market-based
specifications suggesting that the market tends to reduce trading activity in anticipation of the
- 32 -
announcement of FFO is consistent with the trading pattern around the announcement of
earnings information for non-REITs. (See for example Chae, 2005)
To examine whether the level of abnormal trading volume is associated with the level of the
surprise contained in the FFO announcement, I estimate three regressions. The first is based on
the traditional specifications frequently used in the existing literature that uses the difference
between actual FFO and expected FFO scaled by price as an independent variable to explain
abnormal trading volume. The second specification modifies the first by allowing for different
slopes for positive and negative surprises and use piecewise regression. Lastly, I use an
unconstrained polynomial regression that allows for curvilinearity in the relation between
abnormal trading volume and FFO surprises.
Table 4 presents the results based on the traditional specification. The results show that for all
windows, there is no significant relationship between abnormal trading volume and the level of
surprise in the announcement of FFO. This is indicated by R2s that are not statistically different
from zero. Since the traditional specification is a constrained version of the specification that
uses both expected and actual FFO as independent variables, I present an unconstrained linear
regression in Table 4. This allows me to formally test whether the constraints imposed by the
traditional specification may be driving the results. The result of the F-test shows no significant
difference in the variance explained by the traditional specification and the unconstrained
- 33 -
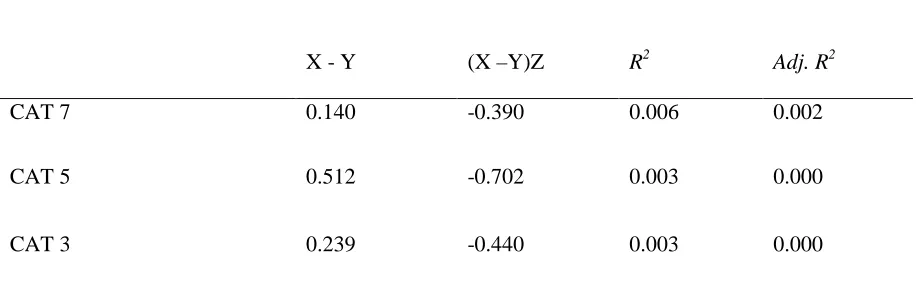
The results from the piecewise regression are presented in Table 5. The results show no
significant relationship as indicated by the R2s that are not statistically different from zero. In
addition, tests of the difference in model R2s show no significant difference between the
piecewise regression and the traditional specifications. This suggests that the lack of association
between abnormal trading volume and the size of the surprise holds when I allow for different
slopes for negative and positive surprises. This is further confirmed by the insignificant
coefficient on the coded variable.
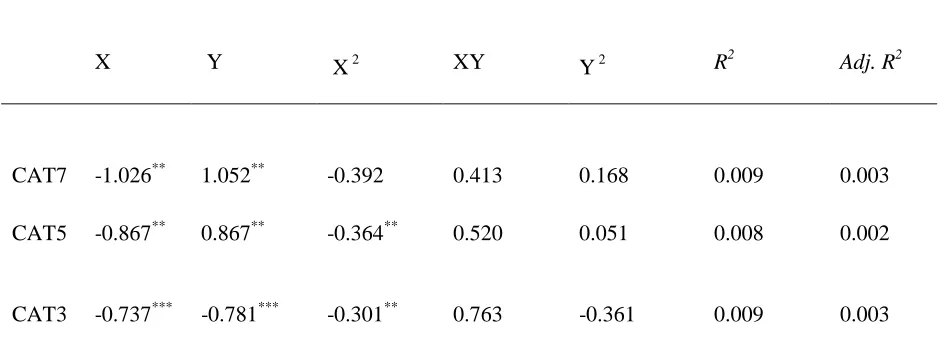
I present the results based on the unconstrained polynomial regression in Table 6. The results
show insignificant R2s for all windows. An F-test for difference in R2s for the unconstrained
linear and quadratic specifications shows no significant difference. These results suggest that the
lack of significant relationship between abnormal trading volume and the size of surprise is
robust to different specifications.
These results are inconsistent with the findings documented for non-REITs that also use trading
volume as a measure of investor response (see Bamber, 1987, Bamber and Cheon, 1995 and
Cready and Hurtt, 2002).Moreover, results from a number of studies examining the information
content of FFO using abnormal returns as a gauge of investor reaction have documented
significant relationship between FFO surprises and abnormal returns (see Gyamfi-Yeboah,
Ziobrowski and Lambert, 2010 and Baik, Billings and Morton 2008). This suggests that there
may be peculiar characteristics of REITs that limits investors’ ability to fully trade on the
- 34 -
costs significantly reduce trading volume but have no effect on share prices. This suggests that in
the presence of higher transaction costs, market response through share price changes could be
more pronounced than changes in trading volume. It is well documented (Subrahmanyam, 2007;
Bertin, Kofman, Michayluk and Prather, 2005 and Ghosh, Miles and Sirmans, 1996) that REITs
have, on average, a relatively high bid-ask spread (a proxy for transaction cost) and are relatively
less liquid compared to non-REITs. It is plausible to argue that the higher bid-ask spreads for
REITs, which reflects a lack on consensus on prices may limit the amount of trading that occurs
in response to the announcement of FFO surprises.
Information Content of Net Income vs. FFO (Test of Hypothesis 3)
To address the question of whether FFO conveys more useful information about REITs
performance when compared to traditional GAAP measures, notably net income, I re-estimate all
equations using net income in place of FFO. Since the evidence presented in both Downs and
Guner (2006) and Baik, Billings and Morton (2008) suggest that FFO may be more useful to
investors, I expect the variance explained by the regressions containing FFO to be significantly
larger than those containing net income.
I present the results of the FFO versus Net Income regressions in Table 7. Since the preceding
results indicate no significant relation between abnormal trading volume and FFO surprises, I use
abnormal returns as the dependent variable. To ensure that the results are robust, I use two
- 35 -
polynomial regression. As the results show, R2 from the regression using net income is
substantially lower than the R2 from the regression using FFO. A test for the difference in R2
using Clarke’s distribution free test shows that FFO explains significantly more variance in
abnormal returns than net income supporting our conjecture that FFO provides more useful
information to investors than net income.
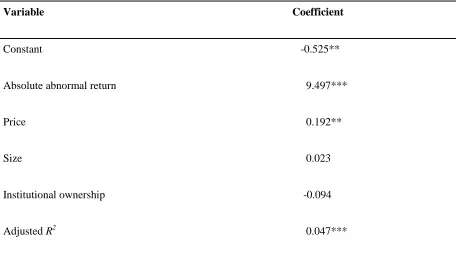
Informed Traders and Abnormal Trading Volume (Test of Hypothesis 4)
I test Kim and Verrecchia’s (1991) hypothesis that firms with more informed traders will
experience less abnormal trading on the announcement of earnings (or FFO). The results of the
regression testing this hypothesis are presented in Table 8. The main variable of interest is the
proportion of outstanding shares held by institutions (IO) at the end of each quarter prior to the
FFO announcement. I include control variables that have been documented in prior studies to be
significantly related to abnormal trading volume. I find, as expected, that absolute abnormal
returns are significantly positively related to abnormal trading volume. I also find price to be
significantly related to the abnormal trading while firm size does not appear to have any
significant impact. As the results in the table show, even though the proxy for the level of
informed traders enters the regression with the expected sign, the coefficient is not statistically
different from zero. Consistent with the approach adopted in prior studies, I include a quadratic
term for IO but obtain the same results. This suggests that, for REITs, the level of institutional
ownership does not appear to have a significant impact on the abnormal trading volume observed
on the announcement of FFO. This result is in contrast to the findings documented in Kim,
- 36 -
relatively high transaction costs for REITs may limit the trading by uninformed traders who may
want to trade on the announcement of FFO.
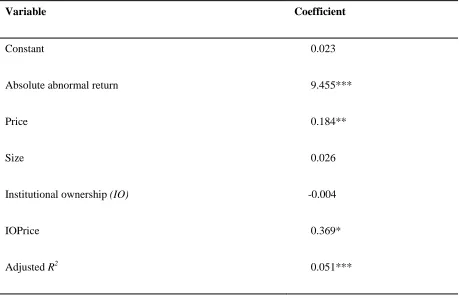
To formally test whether the results documented above are driven by the relatively higher
transaction costs for REITs, I interact log price (a proxy for transaction cost) with IO and include
this term in a regression predicting abnormal trading volume. The results are presented in Table
9. A significant and positive coefficient on the interaction term would indicate that the impact of
the level of institutional ownership on abnormal trading volume depends on the level of
transaction costs. Specifically, such a result would suggest that REITs with lower transaction
costs and higher levels of institutional ownership are more likely to have lower volume of
trading on the announcement of FFO. As the results show, the coefficient on the interaction term
is positive and significant supporting the conjecture that the lack of significance on the
institutional ownership variable may partly be explained by the relatively high transaction costs
for REITs. Figure 2 demonstrates the relation between abnormal trading volume and the levels of
institutional ownership at three different values of price: the mean, one standard deviation above
the mean and below the mean. The y-axis shows cumulative abnormal trading volume while the
x-axis shows the centered values for levels of institutional ownership. As the figure shows, the
slope for the level of institutional ownership varies for different values of price.
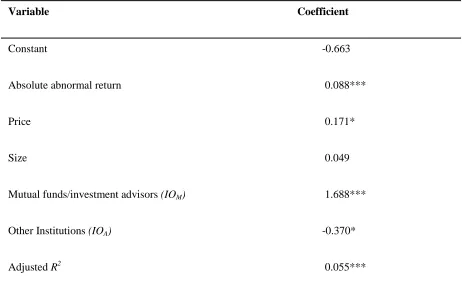
Dennis and Strickland (2002) document different trading behavior for different types of
institutional investors. The authors decompose institutional ownership into four categories and