Georgia State University
ScholarWorks @ Georgia State University
Public Health Theses School of Public Health
Fall 12-10-2010
A Spatial and Health Burden Analysis of Census
Tract 85: Implications for Prevention and
Intervention
Allison C. Edwards Georgia State University
Follow this and additional works at:https://scholarworks.gsu.edu/iph_theses Part of thePublic Health Commons
This Thesis is brought to you for free and open access by the School of Public Health at ScholarWorks @ Georgia State University. It has been accepted for inclusion in Public Health Theses by an authorized administrator of ScholarWorks @ Georgia State University. For more information, please contact [email protected].
Recommended Citation
Edwards, Allison C., "A Spatial and Health Burden Analysis of Census Tract 85: Implications for Prevention and Intervention." Thesis, Georgia State University, 2010.
A Spatial and Health Burden Analysis of Census Tract 85: Implications for Prevention and Intervention
(Under the direction of Dr. Rodney Lyn, Faculty Member)
New regulations requiring not-for-profit hospitals to provide documented evidence of charitable care and community benefits provide a unique opportunity for strategic and targeted investment within the given community of the hospital. And with a growing number of uninsured and underserved in the US, the need for tactical community benefits is increasing exponentially. The purpose of this capstone is to pool together the relevant resources and data necessary to guide and inform the decision making process involved in creating prevention and intervention programs tailored specifically to census tract 85. Utilizing several different forms of demographic and health data including Census, Online Analytical Statistical Information Systems (OASIS), and Geographic Information Systems (GIS), this capstone provides an assessment of the community of census tract 85 and identifies the two major health conditions of said community, diabetes and stroke, for prevention/intervention. Following the principles of evidence-based decision making, this project pulls together the necessary resources and provides recommendations on how not-for-profit hospitals and other community partners can best intervene within the community of census tract 85, thus improving the health of its residents.
A Spatial and Health Burden Analysis of Census Tract 85: Implications for Prevention and Intervention
By: Allison Edwards
B.A. University of Tennessee, Knoxville, 2001
A Capstone Project Submitted to the Graduate Faculty of Georgia State University in Partial Fulfillment of the Requirements for the Degree
A Spatial and Health Burden Analysis of Census Tract 85: Implications for Prevention and Intervention
By: Allison Edwards
Approved:
Rodney Lyn, Ph.D.
Committee Chair
Michael P. Eriksen, Sc. D.
Committee Member
December 6, 2010
iii
Acknowledgements
I would especially like to thank Gordon Freymann at the Georgia Department of Community Health for his quick responses to all of my questions regarding OASIS.
I would also like to thank the faculty and staff of the Institute of Public Health at Georgia State University, for allowing me to have this wonderful experience. Special thanks to Dr. Lyn, for all of his thoughtful advice and encouragement, and Dr. Eriksen, for mentoring me throughout my time in the program.
Authors’ Statement
In presenting this capstone as a partial fulfillment of the requirements for an advanced degree from Georgia State University, I agree that the Library of the University shall make it
available for inspection and circulation in accordance with its regulations governing materials of this type. I agree that permission to quote from, to copy from, or to publish this capstone may be granted by the author or, in her absence, by the professor under whose direction it was written, or in his absence, by the Associate Dean, College of Health and Human
Sciences. Such quoting, copying, or publishing must be solely for scholarly purposes and will not involve any potential financial gain. It is understood that any copying from or publication of this capstone which involves potential financial gain will not be allowed without written permission of the author.
Notice to Borrowers Page
All theses deposited in the Georgia State University Library must be used in accordance with the stipulations prescribed by the author in the preceding statement.
The author of this thesis is:
Student’s Name: _Allison Edwards_______________________________________ Street Address: _784 Fulton Terrace______________________________________ City, State, and Zip Code: _Atlanta, GA 30316______________________________ The Chair of the committee for this thesis is:
Professor’s Name: _Dr. Rodney Lyn______________________________________ Department: _Public Health_____________________________________________ College: __Health and Human Sciences________________________________________ Georgia State University
P.O. Box 3995
Atlanta, Georgia 30302-3995
Users of this thesis who not regularly enrolled as students at Georgia State University are required to attest acceptance of the preceding stipulation by signing below. Libraries borrowing this thesis for the use of their patrons are required to see that each user records here the information requested.
NAME OF USER ADDRESS DATE TYPE OF USE
(EXAMINATION ONLY OR COPYING)
Curriculum Vitae
Allison Edwards
784 Fulton Terrace, Atlanta GA 30316Education
Georgia State University, Atlanta GA
Masters of Public Health, 2010 GPA: 3.89
University of Tennessee, Knoxville TN
Bachelors of Arts in Psychology, 2001
Professional Experience
Piedmont Healthcare/Piedmont Hospital, Atlanta GA 2009
Intern
Worked with team of administrative executives on improving community benefits
program strategically through community needs assessment and improvement of hospital outreach within the community
Georgia State University, Atlanta GA 2008-2009
Graduate Research Assistant
Researched current data for a major public health publication and assisted with compilation of relevant materials
Volunteer Experience
Georgia State University, Atlanta GA 2008 Department of Sociology
Volunteered on a project collecting qualitative data from residents of public housing in Atlanta area
The Red Cross, Atlanta GA 2005
Assisted with hurricane Katrina evacuees
vii
TABLE OF CONTENTS
CHAPTERS
ACKNOWLEDGEMENTS……….iii
LIST OF FIGURES………...………viii
LIST OF TABLES………...ix
LIST OF CHARTS………...x
LIST OF MAPS………...…xi
I. INTRODUCTION……….………..…1
Introduction………..…....1
Background………...2
Purpose of Project………....4
II. THEORETICAL FRAMEWORK……….…….6
III. CAPSTONE PROCEDURES…….………..11
IV. FINDINGS……….…………17
Demographic Profile………..17
Health Profile……….20
V. LITERATURE REVIEW………..27
Diabetes………..27
Stroke……….35
VI. EXISTING RESOURCES AND POTENTIAL PARTNERS………...……42
VII. DISCUSSION AND CONCLUSION………...47
REFERENCES………..55
viii
LIST OF FIGURES
Figure 1 The Seven Stages of Evidence Based Decision Making...7
ix
LIST OF TABLES
Table 1 All Health Conditions Examined Using OASIS Data for Percentage of
Deduplicated Discharges………...………14
x
LIST OF CHARTS
Chart 1 Percentage of Deduplicated Discharges from the years 2005-2007 using OASIS
data………...……….…………21
Chart 2 Percentage of Deduplicated Discharges for Diabetes by Age from the years 2005-2007using OASIS data……….……22
Chart 3 Percentage of Deduplicated Discharges for Diabetes by Race from the Years 2005-2007 using OASIS data……….…...23
Chart 4 Percentage of Deduplicated Discharges for Diabetes by Sex from the Years
2005-2007 using OASIS data………23
Chart 5 Percentage of Deduplicated Discharges for Stroke by Sex from the years
2005-2007 using OASIS data……….……24
Chart 6 Percentage of Deduplicated Discharges for Stroke by Race from the years 2005-2007 using OASIS data……….25
xi
LIST OF MAPS
Map 1 Census Tract 85………..………18
Map 2 Churches in Census Tract 85……….44
1 CHAPTER I- INTRODUCTION
Introduction
According to Centers for Disease Control and Prevention (CDC) data, in 2009
there were 46.3 million people without health insurance living in the United States (CDC,
2010). The recent climate in this country of increased job loss and poverty only promises
to see this number rise over the next several years. In a country with such an
overwhelming number of uninsured citizens, there is a desperate need for some form of
relief to both the underserved populations with unequal access to healthcare, and the
governmental institutions responsible for their support. One solution to this problem is
the not-for-profit hospital, which has a core responsibility to provide charity care to those
underserved populations. Not-for-profit hospitals are 501(c)(3) organizations that
receive tax advantages from the federal government and the Internal Revenue Service
(IRS) , including exemption from federal income taxes and ability for their donations to
be tax deductible (Harrison, 2004). These tax exclusions are contingent upon the
not-for-profit hospital employing a charitable mission, providing charity care, and relieving the
government of some of the burdens of health care (Harrison, 2004). This precedent was
set by the IRS in a revenue ruling in the year 1969 which stated that hospitals qualify as
charitable if they engage in health promotion activities within the community (IRS,
1969). The ruling established improving community health as a fundamental priority of
2
Recently, the US government has been requiring not-for-profit hospitals to
provide an increased amount of charitable care and community benefits, along with more
evidence of doing so, in order to justify their tax exemptions (Harrison, 2004). This
update to the legislation provides a unique opportunity for the not-for-profit hospital to
refocus their community benefit efforts, and employ strategies, methods, and targeted
investment into prevention and interventions within the community and based on the
diverse needs of the community. Strengthened efforts at the community benefit level of
not-for-profit hospitals have great potential to reduce the burden of disease, decrease
health disparities, and minimize social injustice in underserved communities with low
access to care, should these efforts be strategic and aimed at the priorities.
Background
In spring 2009, I began working with a large not-for-profit hospital in Metro
Atlanta on a new project they were undertaking to improve the health of their
community. This hospital wanted to create new prevention and intervention programs
based on the needs of their community in order to improve their community’s overall
health. They identified the zip code 30318 as a priority and decided to narrow the scope
of the project to this area because its residents were the most frequent users of the
Emergency Department (ED). And so the research began with this area, as we all
collectively struggled to understand what it might be about this specific community that
led to more frequent utilization of the ED.
Primary and secondary data sources were utilized and focused on the following
areas: population demographic profile; health burdens; community-based health care and
recommendations; and, emergency department use trends. The health assessment found
that over 1/3 of the neighborhoods within the zip code 30318 had high morbidity rates for
lung cancer, diabetes, hypertension, kidney disease, stroke, and asthma. Research and
focus groups informed the hospital of the many community clinics within the zip code,
the services they provide, and their perceptions of this not-for-profit hospital. Internal
focus groups provided the hospital with staff perceptions of the challenges of both the ED
and the hospital’s community outreach abilities. Analysis of ED records produced a
profile of the most frequent users of the hospital ED. Based on the data amalgamation
and analysis, recommendations were developed on three different levels: organizational,
community benefit, and emergency department. One of the specific recommendations at
the community benefit level was to develop and implement interventions with
appropriate metrics aimed at priorities. This capstone will elaborate on this initial
recommendation, taking it several steps further, by providing specific information about
exactly which interventions would be needed and what interventions would work best
within the given community.
As part of the research team, I was responsible for gathering data to form a
community profile and a community health analysis. In my pursuits of searching for
relevant data associated with this zip code, I observed that 30318 is hardly a
homogenous, uniform group of people to which all interventions would apply equally,
nor would there be equal need for the same intervention throughout the zip code. Some
areas of 30318 seemed to be doing relatively well in terms of health conditions, while
other areas within that same zip code had a disproportionate burden of disease by
4
The work of this capstone stems from my interest in these areas of health
inequality. I specifically chose to further explore health and community data for census
tract 85. Census tract 85 was one of the areas with consistently higher morbidity rates
across many of the health conditions I researched. I wanted to delve deeper into
understanding a more complete picture of health for this area, and what interventions
specifically a local hospital or clinic could institute to improve health outcomes for the
residents of census tract 85.
Purpose of Project
The purpose of this capstone is to pool together the relevant resources and data
necessary to guide and inform the decision making process involved in creating
prevention and intervention programs tailored specifically to census tract 85. Drawing
from my experience with my practicum, this capstone will also detail several
interventions that would be appropriate for a large not-for-profit hospital to employ as an
evidence-based method to improve the health of their given community. This capstone
can be used as a tool for any group or individual who may be interested in health
promotion and prevention/intervention programs specific to census tract 85. This
capstone may also be used as a tentative model for future research, by which others may
discover methods to reveal a picture of health for the community of their interest, in order
to promote interventions that work within it.
This capstone will accomplish the following objectives to provide the necessary
components essential for community intervention:
1. Produce a demographic profile of census tract 85 using data from the US Census
2. Produce a health profile of the most significant health conditions for census tract
85 using Online Analytical Statistical Information System (OASIS) data
3. Describe the existing resources and potential partners that could aid in
prevention/intervention projects
4. Research and explain evidence based prevention/intervention recommendations
6
CHAPTER II- THEORETICAL FRAMEWORK
Evidence-based decision making (EBDM) involves the process of making
decisions in accordance with recommendations from the best available scientific
literature. Evidence-based public health seeks to narrow the margin between evidence
and practice. EBDM has many benefits including increasing the efficient use of
resources, maximizing program productivity, and ensuring program success (Brownson,
2009).
There are 3 categories of scientific evidence for public health practice. Type 1
evidence defines the actual causes of diseases and health conditions. Type 2 evidence
states what can be done to prevent disease and other negative health conditions, by
defining the relative effectiveness of interventions and prevention programs. Type 3
evidence, of which there is the least, describes the context in which the intervention was
implemented, and under what conditions it is most successful. This is also known as
external validity, or the translation of scientific knowledge into various practices
(Brownson, 2009). The work of this capstone will strive to utilize all three of these
categories of scientific evidence.
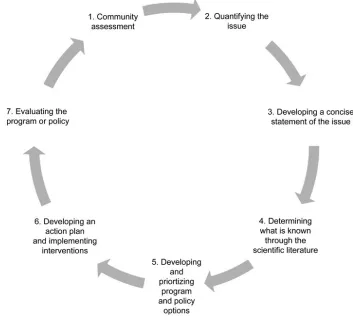
Figure 1 (below) demonstrates the seven stage cycle of evidence-based public
health (Brownson, 2009). This figure provides a guideline for the application of EBDM
one process naturally leads to the next (Brownson, 2003). The application of this
[image:20.612.144.497.157.483.2]framework may also involve numerous feedback loops or iterations (Brownson, 2009).
Figure 1 The Seven Stages of Evidence-Based Decision Making
The first step of the process is the community assessment. Because it is listed as
the first step of the process, this signifies that this is an important foundation with which
to build and inform the remaining steps of the cycle. A needs assessment of the
community aids in identification of significant health problems within that population as
well as strengths, resources and assets within the community (McKenzie, 2005). Step 2,
quantifying the issue makes use of descriptive data, such as vital statistics and
8
for the ability to compare the population in question with others, and later to determine if
the intervention/prevention efforts are successful. Developing a concise statement of the
issue is the third step of the cycle. This is significant in order to build support for the
issue with policy makers and relevant organizations. Also a clear statement of the
problem increases the likelihood of systematic and focused planning. Step 4, determining
what is known through the scientific literature, can be accomplished using the issue
statement to systematically identify and evaluate scientific studies pertaining to the issue
at hand. The fifth step, developing and prioritizing program and policy options, could be
partially informed by the review of the literature, but also there is a need to access the
available resources on effective prevention/intervention programs developed by expert
panels or explained in summaries of existing evidence, like systematic reviews. Step 6 is
to develop an action plan and implement the interventions. This involves the
development of goals related to the program and strategic planning methods to ensure
that those goals are met. The final step of program evaluation analyzes the goals and
objectives of step 6 to determine how well they were met (Brownson, 2003). This last
step feeds back into step 1 of the cycle, as it can be utilized to modify the original
process, when necessary. This capstone will utilize the first four steps of the stages of
evidence-based medicine.
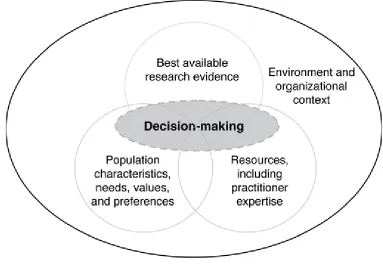
Figure 2 (below) shows how the significant components of evidence-based public
health all come together within an environmental or organizational context to inform
decision making. An overarching objective of this paper is to present the components of
figure 1 relative to census tract 85, in order to allow for informed decision making by
Figure 2. The Domains that Influence Evidence-Based Decision-Making
This capstone makes use of EBDM by utilizing the following to search for the
best available practices on which to make recommendations for prevention/intervention
strategies: the Guide to Community Preventive Services, the US Preventive Services
Taskforce, the CDC, and current scholarly scientific literature. The Guide to Community
Preventive Services, created by the U.S. Department of Health and Human Services
(DHHS), provides evidence-based public health recommendations regarding population
based interventions to promote health and to prevent disease and negative health
conditions within communities (Truman, 2000). It contains recommendations from a
Task Force, which is made up of independent, volunteer, public health experts within the
10
overseeing systematic review priorities, developing innovative review methods, and
considering how those findings can impact practice (CPS, 2010). The Guide to Clinical
Preventive Services contains the U.S. Preventive Services Task Force (USPSTF)
recommendations on the use of preventive services that are normally provided in primary
care settings. The USPSTF consists of a panel of independent, private sector, primary
care physicians who assess the scientific evidence available in order to provide
11 CHAPTER III- CAPSTONE PROCEDURES
The main objective of this capstone is to pool together the relevant resources and
data necessary to guide and inform the decision making process involved in creating
prevention and intervention programs tailored specifically to census tract 85. The steps
of this process include the following:
1. Creating a demographic profile of census tract 85
2. Creating a health profile of the two of the major health problems in census tract 85
3. Searching the literature to find best evidence interventions for each of those conditions
4. Identifying existing resources and potential partners within the community
5. Integrating the information in steps 1-4 to make specific recommendations as to the actions a not-for-profit hospital should take to improve the health of census tract 85
In the work that I did through my practicum, one of the challenges I faced was
analyzing data at the zip code level. Zip codes are created by the US postal service, and
not for the purposes of data analysis. For that reason, it is very difficult to find good data
at the zip code level. I chose to use a smaller, more homogenous unit specifically created
for the purposes of data analysis: the census tract. The US Census Bureau and OASIS
both have data available at this level, which was another reason for selecting the census
12
I also chose to use OASIS data for this project because it allows for the ability to
look at census tract level data cut by many different indicators, such as race, sex, and age.
In order to make recommendations on prevention/intervention programs, it is imperative
to have a picture of disease for the community, to determine exactly who should be
targeted by these programs. OASIS is a standardized health data repository that pools
together the following data: vital statistics, Georgia Comprehensive Cancer Registry,
hospital discharge, emergency room visits, and more.
Within OASIS, I chose to further examine census tract 85 using the data category
of “percentage of deduplicated discharges.” This category was the closest option for a
morbidity rate. OASIS once referred to this category as “percentage of morbidities” but
recently changed the nomenclature in order to better reflect the true nature of the data. In
reality, a true morbidity rate is difficult to come by due to the delay between disease
development and clinical diagnosis, and disparities in access to healthcare.
Another procedure of this capstone was taking the data presented in OASIS and
translating it into a more appropriate form for the analysis of this project. I utilized the
OASIS morbidity/mortality mapping tool to obtain data for census tract 85 and Fulton
County. All data was downloaded, recorded, and then reconfigured into chart form to
better illustrate the comparison between the two areas, allowing the health disparities to
be more clearly seen.
All census data was collected using the American FactFinder feature on the US
Census Bureau website. Once under American Factfinder, Decennial Census was
selected. Both Census 2000 summary file 1 and summary file 3 were further explored
for state, and then Fulton County for geographic area. County-Census Tract was selected
for table format. The following is a list of the categories of data that were reviewed,
including type of information obtained from each field, listed in parenthesis:
Summary File 1
• general housing characteristics 2000- (number of vacant homes)
• age and sex 2000- (median age)
• race and Hispanic or Latino 2000- ( percentage African American)
• household and families 2000- (female household without husband)
• selected age groups 2000- (percent 60 years and over)
• population, housing units, area, and density 2000- (area in square miles)
Summary File 3
• occupancy, equipment, and utilization characteristics of occupied housing units 2000- (percent with no vehicles available)
• language, school enrollment, and educational attainment 2000- (for educational attainment percents)
• employment status and commuting to work 2000- (percent of unemployed)
• income and poverty in 1999: 2000- (percent of poverty status)
All health data was collected using the mortality/morbidity Online Analytical
Statistical Information System (OASIS) mapping tool developed by the Georgia
Department of Community Health, Department of Public Health. To gather data for
census tract 85, the measure used was percentage of deduplicated discharges, and the
mapping unit used was census tract. Fulton County was selected for geography, and
2005-2007 was selected for time. All fields, which totaled 45, were recorded for each
cause. To gather data for Fulton County, the measure was also percentage of
deduplicated discharges, and the mapping unit selected was County. Fulton County was
also selected for geography and 2005-2007 was selected as the domain for time. All
fields, also totaling 45, were recorded for each cause. The causes that were at least a full
14
examination for this project to be the conditions in greatest need of
prevention/intervention actions. Of those causes, HIV/AIDS and pneumonia were
eliminated for the purposes of the project, to narrow the scope and augment the depth of
the interventions recommended. The two remaining categories for further investigation
[image:27.612.122.585.235.701.2]were the following: diabetes and stroke.
Table 1. All Health Conditions Examined Using OASIS Data for Percentage of Deduplicated Discharges (with priorities highlighted)
Census Tract 85
Fulton County
Blood Poisoning (Septicemia) 1.65 1.3
HIV/AIDS 3.2 1.6
TB NR 0.1
Infectious and Parasitic Diseases
Meningitis 0 0
Oral Cancer NR 0.1
Throat Cancer 0 0
Stomach Cancer 0 0.1
Colon Cancer 0.5 0.4
Liver Cancer NR 0.1
Pancreatic Cancer NR 0.1
Lung Cancer NR 0.3
Skin Cancer 0 0
Breast Cancer NR 0.3
Cervical Cancer 0 0
Uterine Cancer 0 0.1
Ovarian Cancer 0 0.1
Prostate Cancer 0.25 0.2
Testicular Cancer 0 0
Bladder Cancer 0 0.1
Kidney Cancer NR 0.1
Brain Cancer 0 0.1
Lymph Cancer (Hodgkin's Disease) 0 0 Cancers
Leukemia NR 0.1
Blood Diseases (Anemias) Sickle Cell Anemia 0.25 0.3
Endocrine/Nutritional/Metabolic
Mental and Behavioral
Disorders Drug Overdoses 0.55 0.6
Alzheimer's Disease 0.45 0.3
Nervous System Diseases
Parkinson's Disease 0 0
High Blood Pressure (Hypertension) 0.75 0.8 Rheumatic Fever and Heart Diseases NR 0.1 Hypertensive Heart Diseases 0.65 0.3 Obstructive Heart Diseases (Heart
Attack) 3.3 3.4
Stroke 3.1 1.9
Hardening of the Arteries 0.3 0.4
Major Cardiovascular Diseases
Aortic Aneurism and Dissection NR 0.1
Flu NR 0
Pneumonia 5 3
Bronchitis 1.25 0.8
Emphysema NR 0
Asthma 1.45 1.3
Respiratory Diseases
All other chronic lower respiratory
diseases NR 0.1
Digestive System Diseases Alcoholic Liver Disease 0.2 0.1
Kidney Diseases 2.2 1.5
Reproductive/Urinary System
Diseases Kidney Infections NR 0.3
Other Bone and Muscle Diseases 3.65 4.4
*all numbers are percentage of deduplicted discharge for each cause, NR= not
reportable
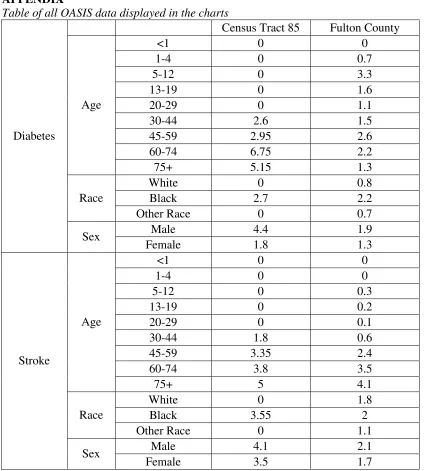
The OASIS mortality/morbidity mapping tool was then used to further explore the
picture of disease for each of the selected health conditions. For diabetes and stroke, all
fields under the following category were individually explored and recorded for both
census tract 85 and Fulton County: age, race, payor, and sex. The payor category was
eliminated from the results as it would require significant research to make
recommendations for interventions based on this category, which was not within the
scope of this project. The data was then used to make charts for comparison of the fields
between Fulton County and census tract 85. For census tract 85, the percentage of
16
tool. That range was averaged to create a whole number for the purposes of the
comparison. Any data that came up as not reportable was classified as 0 for the purposes
of numeric comparison via chart.
The section on evidence based recommendations utilized suggestions from: The
Guide to Community Preventive Services (CPS), the US Preventive Services Task Force
(USPSTF), the Centers for Disease Control and Prevention (CDC), and scholarly
scientific literature. The CPS and USPSTF both have a list of evidence based
recommendations for disease prevention and the promotion of healthful activities.
Recommendations were omitted from this report that were not within the realm of normal
healthcare provider services and expertise (such as policy changes, taxes, and mass media
17 CHAPTER IV- FINDINGS
Demographic Profile of Census Tract 85
Census tract1 85 lies within Fulton County, and inside of the Atlanta city limits. It
can be found to the north of I-20, to the west of I-75/85, and to the east of I-285. It is
found within the zip code 30318 and it is part of neighborhood planning unit J (NPU-J).
The neighborhood that makes up most of census tract 85 is Grove Park. Donald Lee
Hollowell Parkway runs directly through census tract 85 from east to west and was
formerly known as Bankhead Highway. Census tract 85 is bordered to the northeast by
Proctor Creek, to the east by Marietta Boulevard, to the south by North Avenue, to the
west by South Eugenia Place and Mildred Place, and to the north by Alvin Drive. Some
of the major parks in the area include Gun Club Park, Grove Park, and Edwin Place Park
(City of Atlanta GIS, 2010). The total land area in square miles of census tract 85 is 1.45.
(US Census, 2010)
1
18
Map 1. Census Tract 85 (outlined in black)
(City of Atlanta GIS 2010)
The US Census Bureau currently does not make population estimates for the
geographic area of census tract, so a more accurate count of the current population, as
well as current demographic information of census tract 85, will not be available until
According to the 2000 US census, the total population of census tract 85 was
4,798, with the median age at 35. The total population of Fulton County in 2000
according to census was 816,006, and the estimated population as of July 1, 2009 is
1,033,756. The predominant race or ethnic group living in census tract 85 based on the
2000 census is African American or black, at 97.8%.
Census tract 85 had a larger percentage (17.5%) of those age 60 years and older in
the year 2000 as compared with Fulton County (11.5%).
There was a larger percentage of female households without a husband present in
census tract 85 as compared with Fulton County, in the year 2000, as shown in their
respective percentages (35.7%) and (16.5%).
The total number of housing units in census tract 85 is 1,821, while the number of
occupied housing units is 1,681. This means in 2000, there were 140 vacant homes in
census tract 85. The percentage of households with no vehicles available is 24.2 in
census tract 85, while it is 15.2 in Fulton County.
There was also a higher number of the civilian labor workforce unemployed in the
year 2000 in census tract 85 (20%) as compared with Fulton County (8.9%).
Percentage of census tract 85 with less than a 9th grade education is 11.6, which
can be compared with Fulton County’s 5.1. Percents of census tract 85 and Fulton
county population who are a high school graduate or higher are 59.2 and 84 respectively.
Percentage with a bachelors degree or higher in Fulton County is 41.4, compared with
census tract 85’s 3.5. The percent of the population for whom poverty status is
determined, based on 1999 income, in census tract 85 is 25.8 compared with Fulton
20
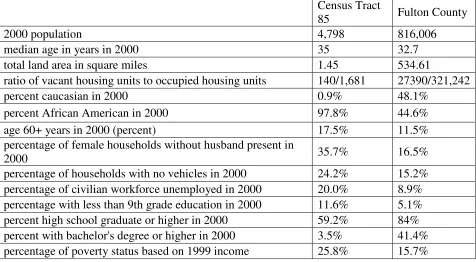
Based on the data provided by the US Census Bureau, it can be observed that
those living in census tract 85, in general, have lower incomes and complete fewer years
in school than the whole of Fulton County. The lack of financial stability and educational
opportunities has the potential to create many health disparities and barriers to care
[image:33.612.109.585.226.488.2]within this community.
Table 2. Table of Census data
Census Tract
85 Fulton County
2000 population 4,798 816,006
median age in years in 2000 35 32.7
total land area in square miles 1.45 534.61
ratio of vacant housing units to occupied housing units 140/1,681 27390/321,242
percent caucasian in 2000 0.9% 48.1%
percent African American in 2000 97.8% 44.6%
age 60+ years in 2000 (percent) 17.5% 11.5%
percentage of female households without husband present in
2000 35.7% 16.5%
percentage of households with no vehicles in 2000 24.2% 15.2% percentage of civilian workforce unemployed in 2000 20.0% 8.9% percentage with less than 9th grade education in 2000 11.6% 5.1% percent high school graduate or higher in 2000 59.2% 84% percent with bachelor's degree or higher in 2000 3.5% 41.4% percentage of poverty status based on 1999 income 25.8% 15.7%
Health Profile of Census Tract 85
The percentage of deduplicated discharges2 measure reveals what percentage of
all the deduplicated discharges, for the selected measures (i.e. age, sex, race, years) is due
to a particular condition (e.g. diabetes). Using the data from Chart 1 (below) as an
2
example, it can be discerned that of all the deduplicated discharges between 2005-2007,
in census tract 85, 3.1 percent was due to stroke (OASIS, 2010).
Of the data examined using the OASIS mapping device to compare the percentage
of deduplicated discharges, the two health conditions that were selected for this project
were at least a whole percentage point higher in census tract 85 than in Fulton County:
diabetes and stroke.
The raw number of deduplicated discharges per population for census tract 85 is
58/4,798 for stroke and 60/4,798 for diabetes. The number of deduplicated discharges
per population for Fulton County is 4,014/816,006 for stroke and 3,394/816,006 for
diabetes. This means that the prevalence rate of deduplicated discharges for stroke is
.005 in Fulton County and more than twice that rate in census tract 85 at .012. The
prevalence rate of deduplicated discharges for diabetes is .004 in Fulton County and more
than three times that rate in census tract 85 at .013 (OASIS, 2010).
22
Chart 1 compares the percentage of deduplicated discharges in census tract 85 and
Fulton County. The chart shows that for the conditions of stroke and diabetes, the
percentage of deduplicated discharges is greater in census tract 85 than it is in Fulton
County. These discrepancies in health between census tract 85 and Fulton County
merited further research to better describe the picture of disease in census tract 85, and
therefore, each condition was further scrutinized by age, race, and sex.
Diabetes
Chart 2. Percentage of Deduplicated Discharges for Diabetes by Age from the years 2005-2007using OASIS data
Chart 2 shows that in census tract 85, the percentage of deduplicated discharges
inclines sharply between the ages 30-44, suggesting that this is the age range when the
residents of census tract 85 either develop diabetes or develop complications of the
ages of 30-44 have almost twice the percentage of deduplicated discharges; about three
times as much for the age group 60-74, and nearly four-fold the amount for age 75+. The
lack of data for age 29 and under in census tract 85 could reflect either lack of diabetes
diagnosis at that age range or lack of admissions to a non-Federal acute care inpatient
facility with diabetes as the basis of principle diagnosis, in which case patients may have
been seen by a primary care pediatrician or other doctor, and therefore would not show
up in this data.
Chart 3. Percentage of Deduplicated Discharges for Diabetes by Race from the Years 2005-2007 using OASIS data
Chart 3 shows that the burden of disease for diabetes in census tract 85 between
2005-2007 was on the African American residents. This chart provides the evidence that
any prevention/intervention program for diabetes in census tract 85 would need to target
24
Chart 4. Percentage of Deduplicated Discharges for Diabetes by Sex from the Years 2005-2007 using OASIS data
Chart 4 shows the pecentage of deduplicated discharges for both census tract 85
and Fulton County by sex for the years 2005-2007. The chart shows that both males and
females have higher percentages of deduplicated discharges for census tract 85 than
Fulton County. It also shows that men in census tract 85 have a higher rate for
deduplicated discharges than women.
Stroke
Chart 5 shows of all the deduplicated discharges between 2005-2007 for each age
group listed, what percentage was for stroke for census tract 85 as compared with Fulton
County. The chart demonstrates that in Fulton County, the percentage of deduplicated
discharges for stroke is higher prior to age 30 than in census tract 85. The chart also
shows that the percentage of deduplicated discharges was over twice as high at ages
30-44 in census tract 85 than in Fulton County. There was also a higher percentage of
deduplicated discharges for stroke for each of the age groups after 30-44 in census tract
85, as compared with Fulton County, between 2005-2007. The fact that there is no data
for census tract 85 prior to the age range 30-44 reflects that strokes are typically an
aberration at such a young age, and for a smaller population, such as census tract 85, it
would be quite rare to observe such an anomaly.
Chart 6. Percentage of Deduplicated Discharges for Stroke by Race from the years 2005-2007 using OASIS data
Chart 6 demonstrates that the burden of disease from strokes between 2005-2007
in census tract 85 fell on the African Americans that live there. This reflects both the fact
26
prevention/intervention aimed at reducing strokes in census tract 85 should be one that is
successful in reaching the African American community.
Chart 7. Percentage of Deduplicated Discharges for Stroke by Sex from the years 2005-2007 using OASIS data
Chart 7 shows the percentage of deduplicated discharges for stroke by sex from
the years 2005-2007. It can be seen, from this chart, that the percentage of deduplicated
discharges for strokes was slightly higher for males than females in both Fulton County
and census tract 85, and that the percentage of deduplicated diseases for stroke is higher
27 CHAPTER V- LITERATURE REVIEW
DIABETES
Public Health Impact of Type II Diabetes
Diabetes was the 7th leading cause of deaths in the US in 2006 (ADA, 2010).
However, the disease is often underreported on death certificates as heart disease and
stroke have the tendency to be reported as the actual cause of death, while diabetes is also
a contributing factor (ADA, 2010). The World Health Organization estimates that the
number of deaths due to diabetes will double worldwide between the years 2005 and
2030 (WHO, 2010).
Pre-diabetes is a condition that is becoming increasingly more common in the US.
It is not only a risk factor for diabetes, but also for heart disease and stroke. In 2007, an
estimated 57 million Americans had diabetes (NIH, 2007). A person who is
pre-diabetic has a blood glucose level that is higher than what is normal, but not high enough
to be classified as diabetes. This condition is a risk factor for diabetes, and many people
who develop pre-diabetes will develop diabetes within the next 10 years, unless they take
steps to reverse or halt its progress (ADA, 2010). Therefore, pre-diabetes could be
viewed as the last possible stage for the prevention of diabetes.
Metabolic syndrome is another health condition that is a risk factor for developing
type ii diabetes. It is the co-occurrence of at least three out of the following five
symptoms: waist measurements over 35 for female and 40 for male, high triglyceride
28
glucose levels (Grundy, 2005). All conditions characteristic of metabolic syndrome can
be controlled via changes in diet and physical activity.
There are several complications associated with diabetes including heart disease,
stroke, high blood pressure, blindness, amputation, kidney disease, nervous system
disease, dental disease, and complications with pregnancy (ADA and CDC, 2010). In
2007, the direct medical costs of diabetes were calculated to be $116 billion annually, not
including such indirect costs associated with such things as disability and work loss
which is calculated to total $58 billion a year (ADA and CDC, 2010).
Health Disparities Associated with Type II Diabetes
In the United States, African Americans are twice as likely as whites to have
diabetes (CDC, 2010). They also experience more complications of diabetes, more
disabilities associated with diabetes, and higher death rates due to diabetes (Walker,
2010). There are an estimated one million African Americans in the United States with
pre-diabetes (Dodani, 2010). Both education and income levels are significant
determinants of the risk of death associated with diabetes (Saydah, 2010). In the National
Healthcare Disparities Report in 2003, the Agency for Healthcare Research and Quality
(AHRQ) found that diabetics with lower socioeconomic statuses were less likely to
receive the recommended diabetes services, and more likely to be hospitalized or
experience complications due to their diabetes (AHRQ, 2004).
These national findings of the health disparities associated with diabetes can be
observed within the residents of census tract 85. It can be assumed by the data that not
complications, but that they will continue to suffer from diabetes in the future, should
nothing be done to intervene and reverse the progression of diabetes within the
community.
Evidence-Based Recommendations for Diabetes
Lifestyle interventions within the pre-diabetic phase of insulin resistance can
mitigate risk of cardiovascular disease and prevent diabetes (Faridi, 2010). The CDC
recommends two activities for the prevention of type ii diabetes: eating a healthful diet
and being physically active (CDC, 2007). The Diabetes Prevention Program (DPP), a
major clinical research study conducted in 27 health centers across the United States,
found that millions of persons at high risk for type ii diabetes can delay or avoid the
development of the condition by weight loss from regular exercise and a low fat/calorie
diet (NIH, 2008).
Nutrition
The research demonstrates that the effects of integrated risk counseling for
nutrition-related diseases in African Americans found that patients reported significant
changes in nutrition and physical activity self-efficacy following their participation in
risk counseling (Halbert, 2010). However, another study examining different treatments
used by primary care physicians found that for patients with hyperlipidemia, diet and
nutrition counseling was either ordered or provided for white patients (40.4%) more
frequently than African Americans (32.6%) (Willson, 2010). These findings reveal racial
disparities in the use of behavioral dietary counseling in a population that it could greatly
30
Research also shows that the majority of low socio-economic status, older,
Southern adults, aren’t meeting the recommended Food Guide Pyramid nutrition
guidelines. The authors of this article recommend that nutrition counseling include
strategies to increase whole grain, fruit, and vegetable consumption, and reduce fat
consumption (Vitolins, 2007).
Interventions targeted at high risk populations have been found to be cost
effective at slowing the incidence of diabetes (Faridi, 2010). While the US Preventive
Services Task Force (USPSTF) has concluded that there is insufficient evidence to
recommend behavioral counseling promoting healthy diets for the general population of
patients, they do recommend intensive behavioral dietary counseling for adult patients
with hyperlipidemia, elevated levels of lipids in the blood, or other known risk factors for
cardiovascular disease. This service can be carried out by the primary care clinician or
through referral to a dietician or nutritionist (USPSTF, 2010).
The intensive behavioral counseling must combine nutrition education with
behavioral counseling so that patients can ascertain support and motivation to change
their diet and learn the skills needed to prepare more healthful foods. Whitlock et. al
recommend the use of the 5-A behavioral dietary counseling model as a framework with
which to create effective therapies, and the USPSTF lists this in their clinical
considerations for dietary counseling (Whitlock, 2002). The 5-A model is as follows:
a. Assess- dietary practices and related risk factors
b. Advise- to change dietary practices
c. Agree- on individual diet change goals
e. Arrange- regular follow up and support or refer to more intensive behavioral nutritional counseling, such as medical therapy, if needed
These interventions have demonstrated changes in the average daily consumption
of the basic building blocks of a healthy diet, such as fiber, fruit, vegetables, and
reduction in saturated fat among adults at increased risk for diet related chronic disease.
The best results were found when patients with hyperlipidemia, hypertension, or other
risk factors for diet related chronic disease participated in multiple sessions of the
intervention that lasted 30 minutes or longer. The USPSTF also posits that the most
effective interventions will involve a combination of education, behavior counseling,
patient reinforcement, and patient follow up (USPSTF, 2010).
A systematic review conducted by The American Dietetic Association Evidence
Analysis Library Nutrition Counseling Workgroup found that there is strong evidence to
sustain using a blend of both behavioral theory and cognitive behavioral theory for
modification of certain dietary habits, weight, and cardiovascular and diabetes risk
factors (Spahn, 2010). Nutrition counseling structured through this theory may involve
the following: self-monitoring (such as thoughts, emotions, food intake, behavior),
problem solving, goal setting, rewards and contingency management, cognitive
restructuring, social support, stress management, stimulus control, and relapse prevention
(Spahn, 2010).
Physical Activity
A recent qualitative study examining influences on physical activity in a
disadvantaged African American community asked the members of that community to
32
members of that community. The community members identified social support and
having structured programs within the neighborhood as two things that would increase
physical activity (Griffin, 2008).
The TFCPS has concluded that there is strong evidence of effectiveness to
maintain the use of interventions in communities that enhance the network of social
support when trying to increase physical activity in participants. These interventions
focus on altering physical activity behavior through the use of supportive social networks
(CPS, 2010).
The intervention works by either identifying and strengthening existing social
networks or creating new networks of support. Intervention strategies used include using
a buddy system, making contacts with others, or setting up exercise groups. These
interventions enhanced the overall level of participant fitness, decreased their percentage
of body fat, increased their knowledge of exercises, and improved their belief in their
own capacity to exercise (CPS, 2010).
Qualitative research has demonstrated that social support from family, friends,
and neighbors is a socio-cultural enabler for physical activity. Focus groups comprised
of African American women determined that group exercise classes, and walking clubs
or sports teams organized within churches or other existing community organizations
could enhance the social environment and promote exercise (Sanderson, 2002).
Research demonstrates that there are racial and ethnic inequalities in access to
parks and recreational areas (Wolch, 2005, Moore, 2008). This can help to explain some
of the reasons for racial disparities with respect to physical activity and obesity
for increasing exercise and improving health through either creation of, or increased
access to already existing places of physical activity. This intervention could involve a
change to the physical environment through creation of parks, trails, or exercise facilities
which could take a significant amount of time to implement due to policy and land use
restrictions. Or it could involve reducing fees to existing facilities or changing the hours
of operation to reduce barriers to exercise, which could go into effect in a much shorter
amount of time, should it be a viable option (CPS, 2010).
Focus groups from the study done by Sanderson et al. identified safe, convenient
places to exercise as a potential enabler to physical activity. They identified poorly
maintained parks or recreation areas, and the lack of close by facilities as barriers to
exercise (Sanderson, 2002). A hospital or health clinic wanting to increase exercise
within this population could invest in reconstructing public parks or other venues to
enhance physical activity.
Case Management
Case management has been shown to be effective in reducing the cost of care for
those at high risk of diabetes related complications. It can effectively lower hospital
admissions rates for those utilizing the services of case managers and can also shorten the
length of their hospital stay (Cramer, 2010).
The TFCPS recommends the use of a case management based on strong evidence
of effectiveness (CPS, 2010). The case manager ideally should be distinct from the
healthcare providers, and should be responsible for overseeing, coordinating, and
organizing all of the patient’s care involving diabetes (Norris, 2002). In the case of
34
examining nurse case management of diabetes found that nurse led case management
provides an effective clinical intervention for blood glucose control (Welch, 2010).
Case management has been recommended on the basis of strong evidence of
effectiveness in its ability to improve glycemic control. The studies reviewed also
demonstrated a decrease in glycated hemoglobin (CPS, 2010).
The TFCPS identifies the five essential components of case management as
follows:
a. Identifying eligible patients
b. Assessing current levels of healthcare and needs of eligible participants
c. Developing an individual care plan for each participant
d. Putting the care plan into action
e. Monitoring the results
Diabetes Self Management Education
The TFCPS has also concluded that there is evidence that diabetes self
management education (DSME) interventions are effective. DSME strategies involve
teaching people how they can best manage their diabetes. Goals of DSME include
increasing metabolism, preventing possible negative health outcomes that can result from
diabetes, and helping the client achieve their best possible quality of life (CPS, 2010).
The research has found that following a community based intervention, older
adults in Georgia senior centers showed improvements in most diabetes self management
behaviors (Speer, 2008). One study aimed at using DSME techniques with African
Americans over age 40 with type ii diabetes found that the DSME intervention increased
up assessment (Walker, 2010). The authors also noted that churches were the best place
for recruiting participants (Walker, 2010).
There is sufficient evidence of effectiveness in improving glycemic control when
DSME strategies are implemented in community gathering places such as faith based
organizations, libraries, and other community centers. Guiding principles of group based
DSME maintain that they should be patient centered, culturally relevant, problem based,
evidence based, and include psychosocial, behavioral, and clinical issues (Tang, 2006).
STROKE
Public Health Impact of Stroke
Approximately 795,000 Americans have a stroke each year (ASA, 2010). Of that
number, 610,000 are first ever strokes, while the remaining 185,000 are coming from
people who have had a stroke before (CDC, 2010). Strokes are the 3rd leading cause of
death after heart disease and cancer, and are responsible for about 137,000 deaths
annually (ASA, 2010).
This year alone, Americans will spend around $73.7 billion in costs associated
with stroke medical care and disability related costs (ASA, 2010). Many complications
can occur as the result of having a stroke such as paralysis, speech difficulties, emotional
problems, and death. Stroke is the number one cause of major long term disability.
Recovery from a stroke can take months or even years, thus increasing both direct and
indirect health care costs, as well as greatly affecting the person’s quality of life (CDC,
2010).
Having diabetes is actually a risk factor for stroke, so anything done to prevent or
36
stroke. In 2004, stroke was recorded on 16% of diabetes related death certificates for
those 65 and older (ADA, 2010).
Health Disparities Associated with Stroke
Compared with whites, African Americans have two times the risk of first ever
stroke (Sallar, 2010 and CDC, 2010). Furthermore, survival rate from first ever stroke is
140% lower among African Americans (Sallar, 2010). In the US, the highest mortality
rate due to stroke can be found in the southeast, also referred to as the “stroke belt” (CDC
2010). In Georgia, the mortality rate for stroke is 16% higher than it is nationally (Bell,
2009).
The risk of stroke is also increased by certain health disparities, such as low
socioeconomic status and low education (Bell, 2009). Data analysis of the Behavioral
Risk Factor Surveillance System (BRFSS) by the CDC found that the prevalence of
having multiple risk factors for heart disease and stroke was 25.9% for college graduates,
while it was 52.5% among those who had less than a high school diploma. Similarly
household income greater than or equal to $50,000 annually had a prevalence of 28.8%,
while those who made less than $10,000 a year had a prevalence of 52.5% of having
multiple risk factors for stroke and heart disease (CDC, 2005).
It is not surprising that census tract 85 has a higher burden of disease from stroke
than the rest of Fulton County based on health disparities. The findings from the
demographic profile of census tract 85 reveal that its residents have lower incomes, lower
education levels, and therefore lower socioeconomic statuses as compared with Fulton
strokes. In order to alter this trend, prevention and intervention programs that are proven
to work would need to be readily accessible to this population.
Evidence-Based Recommendations for Stroke
The CDC recommends the following six actions for stroke prevention and
intervention: eating a healthy diet, maintaining a healthy weight, being physically active,
not smoking, limiting alcohol use, and knowing the warning signs and what to do in case
of a stroke (CDC, 2010). The prevention and intervention strategies related to the first
three actions can be found under the corresponding section for diabetes, since those
actions are also recommended for prevention of diabetes.
Smoking
Physicians are in the unique position of having the ability to inquire about tobacco
use of their patients and provide them with counseling and smoking cessation materials
should they be required (McCullough, 2009). Approximately 70% of smokers visit
physicians annually, and smoking is the single most preventable cause of mortality and
disease or disability (von Garnier, 2010). This allows for an important opportunity for
physicians to prevent disease within their patients.
The TFCPS has concluded that there is strong evidence of effectiveness to support
the use of a healthcare reminder system with a healthcare provider education system to
both increase the delivery of tobacco related advice to clients and also decrease client
tobacco use and increase quitting. This is a multicomponent intervention, utilizing both
38
A recent systematic review of prompting clinicians about preventive care methods
showed that physician prompts were most successful with smoking cessation
(Dexheimer, 2008).
Provider reminders involve making efforts to identify tobacco using patients and
then counsel them on methods of cessation. Provider education involves educating the
providers on why it is important to get their patients to quit smoking or using other
tobacco products. There was insufficient evidence to recommend provider education
alone, but when paired with provider reminders as part of a multicomponent intervention,
the evidence for effectiveness was strong. Methods for provision of educational
information include lectures, written materials, videos, and continuing medical education
seminars (CPS, 2010).
The USPSTF also recommends that clinicians ask all adults if they are tobacco
users, and provide them with interventions to tobacco use if they are. They have
identified a 5-A behavioral framework for tobacco interventions:
i. Ask about tobacco use
ii. Advise to quit through clear and personalized messages
iii. Assess willingness to quit
iv. Assist to quit
v. Arrange follow up and support
The USPSTF found convincing data that smoking cessation interventions
combined with short behavioral counseling meetings (less than 10 minutes) and
number of smokers who quit and remain tobacco free for at least one year (USPSTF,
2010).
Research demonstrates that the provision of free medication combined with easy
access to counseling can result in high levels of unplanned quit attempts, and good
quitting success (Smith, 2009). Combination therapies (bupropion + lozenge or patch +
lozenge) resulted in approximately 30% of patients who remained abstinent after 6
months (Smith, 2009).
The USPSTF also concludes that counseling and medications used together are
more influential than either component is alone. Such medications could include nicotine
replacement therapy, bupropion, and varenicline (USPSTF, 2010).
Alcohol Use
A systematic review found that brief multicontact behavioral counseling
interventions can reduce risky or harmful alcohol use of primary care patients (Whitlock,
2004).
The USPSTF has found fair evidence of effectiveness for screening and
behavioral counseling interventions to decrease alcohol abuse by adults in primary care
settings. Adults with risky alcohol consumption behaviors can be identified using the
CAGE method, which involves asking four questions, and if the patient answers “yes” to
any one of them, they would be said to have risky alcohol related behaviors (Solberg,
2008). The four questions are:
a. Have you ever felt you should Cut down on your drinking?
b. Have people Annoyed you by criticizing your drinking?
40
d. Have you ever had a drink first thing in the morning (an “Eye opener”) to steady your nerves or get rid of a hangover?
The USPSTF also found that there is good evidence that with behavior counseling
and follow up the result can be a reduction in alcohol consumption for a 6 to 12 month
period or even longer (USPSTF, 2010).
The behavior counseling intervention that is recommended follows the framework
of the 5-As of behavioral counseling (Whitlock, 2004):
a. Ask about alcohol use
b. Advise to quit through clear and personalized messages
c. Assess willingness to quit
d. Assist to quit
e. Arrange follow up and support
Knowledge of Symptoms of Stroke
Despite the large contributions of stroke to death and disability in the southeast, it
has been documented that many patients were not able to recognize the symptoms of a
stroke (Sallar, 2010). Knowing the symptoms of a stroke and what actions should be
taken in case of one, can greatly reduce the level of dysfunction and the negative effects
of a stroke by getting the necessary care quickly (Sallar, 2010). A community based
educational intervention with older adults in Georgia found that 65% of participants
recognized all 5 symptoms of a stroke following the intervention (Bell, 2009). The CDC
recommends knowing the warning signs of stroke and to call 9-1-1 immediately, should
someone be suspected of having a stroke (CDC, 2010). Interventions aimed at the
to do in case of a stroke could have a great impact on preventing death and other negative
health effects associated with strokes. According to the American Stroke Association, if
a stroke patient takes a clot bursting drug (tissue plasminogen activator or tPA) within
about 3 hours of the start of stroke symptoms, it may reduce long term disability (ASA,
42
CHAPTER VI- EXISTING RESOURCES AND POTENTIAL PARTNERS
When deciding on which kind of intervention or prevention program would best
work for a community, it is important to take inventory of the existing resources in and
around the community which could be useful to the project. In Community Health
Promotion Ideas that Work, the authors identify 6 principles by which effective health
promotion practitioners select intervention techniques. The third principle “don’t
reinvent the wheel” speaks to the importance of using any resources within the
community that can assist in achieving the goals of the intervention (Kreuter, 2003). The
next section lists a few of the existing resources that could be of use for census tract 85,
and identifies some of the potential partners for furthering the mission.
The National Diabetes Education Program (NDEP) is a collaboration between the
National Institutes of Health (NIH) and CDC. NDEP not only has material on diabetes
prevention and maintenance that is tailored to the specific community being served
(African Americans, Hispanics, women, etc.) but they also have information and tools
that can be used by health care providers to help get their patients to take steps towards
preventing diabetes. The website allows either the healthcare organization or patient to
search relevant information that pertains to diabetes, such as information regarding blood
pressure, cholesterol, healthy eating, and physical activity. There is also a tool on the
website that allows a patient or healthcare organization select educational material based
on age, diabetes status (pre-diabetes, at risk, have diabetes, etc.), race, and language
spoken. This could be an invaluable resource for an intervention or prevention program
Research Tested Intervention Programs (RTIPs) take task force guidelines from
the community guide and design cancer prevention and intervention programs based on
the best evidence provided. While none of the three health conditions examined in this
capstone are cancers, some of the same primary prevention strategies used to prevent
cancer can also prevent diabetes and stroke such as proper nutrition, physical activity,
quitting smoking, and use of barrier method safe sex. Therefore this tool could be useful
when trying to find evidence based intervention strategies that will work for the
community of census tract 85 (CPS, 2010).
Another existing resource that could be useful when implementing interventions
for census tract 85 is the Stroke and Heart Attack Prevention Program (SHAPP). SHAPP
is a local Georgia program for low income uninsured and underinsured Georgians with
hypertension. SHAPP provides education and direct services such as blood pressure
screening, referral to physicians, diagnosis, case management, and treatment. Eligible
patients have income not exceeding 200% of the federal poverty guidelines and no
prescription drug benefits (Constantine, 2008). At the end of 2009, SHAPP reported that
over 67% of those who participated in the program had their blood pressure under control
(GA DCH, 2010). SHAPP partners with faith-based organizations in the community to
gain opportunities for outreach (CDC, 2010).
Several of the intervention ideas listed in the literature review identify social
support and/or community reinforcement as a vehicle for prevention and intervention
programs. One of the interventions for promoting physical activity uses strengthening
social support networks to increase physical activity in program participants. Also, the
44
demonstrates evidence of effectiveness when implemented in community gathering
places such as faith based organizations. A review determining the effectiveness of
health programs that take place in faith based organizations found that faith based
programs can produce positive effects on health and improve health outcomes (DeHaven,
2004). This intervention strategy could also be used in census tract 85, since it is a
community with several faith based organizations and churches. Map 2 shows the
locations of churches, as denoted with red stars, within census tract 85.
Map 2. Churches in Census Tract 85
(City of Atlanta GIS, 2010)
Another important theme throughout the interventions listed is education. Within