Economics Dissertations
Spring 5-15-2010
Essays on Agglomeration Trends in the U.S. Manufacturing
Essays on Agglomeration Trends in the U.S. Manufacturing
Industries, 1988-2003
Industries, 1988-2003
Abdullah Mahbuzzaman Khan Georgia State University
Follow this and additional works at: https://scholarworks.gsu.edu/econ_diss
Part of the Economics Commons
Recommended Citation Recommended Citation
Khan, Abdullah Mahbuzzaman, "Essays on Agglomeration Trends in the U.S. Manufacturing Industries, 1988-2003." Dissertation, Georgia State University, 2010.
https://scholarworks.gsu.edu/econ_diss/69
PERMISSION TO BORROW
In presenting this dissertation as a partial fulfillment of the requirements for an advanced degree from the Georgia State University, I agree that the Library of the University shall make it available for inspection and circulation in accordance with its regulations governing materials of this type. I agree that permission to quote from, to copy from, or to publish this dissertation may be granted by the author or, in his absence, the professor under whose direction it was written or in his or her absence, by the Dean of the Andrew Young School of Policy Studies. Such quoting, copying, or publishing must solely be for scholarly purposes and must not involve potential financial gain. It is understood that any copying from or publication of this dissertation which involves potential gain will not be allowed without written permission of the author.
All dissertations deposited in the Georgia State University Library must be used only in accordance with the stipulations prescribed by the author in the preceding statement.
The author of this dissertation is:
Abdullah M. Khan
190 Bellewood Oak Drive Tucker, GA 30084
The Director of this dissertation is:
Dr. Mark W. Rider
Department of Economics
Andrew Young School of Policy Studies Georgia State University
P.O. Box 3992
Atlanta, GA 30302-3992
Users of this dissertation not regularly enrolled as students at Georgia State University are required to attest acceptance of the preceding stipulations by signing below. Libraries borrowing this dissertation for the use of their patrons are required to see that each user records here the information requested.
Name of User Address Date Type of use
BY
ABDULLAH M. KHAN
A Dissertation Submitted in Partial Fulfillment of the Requirements for the Degree
of
Doctor of Philosophy in the
Andrew Young School of Policy Studies of
Georgia State University
Copyright by
ACCEPTANCE
This dissertation was prepared under the direction of the candidate’s Dissertation Committee. It has been approved and accepted by all members of that committee, and it has been accepted in partial fulfillment of the requirements for the degree of Doctor of Philosophy in Economics in the Andrew Young School of Policy Studies of Georgia State University.
Dissertation Chair: Mark W. Rider
Committee: Carolyn J. Bourdeaux
Bruce E. Kaufman
Jonathan C. Rork
Electronic Version Approved:
Robert E. Moore Dean
Andrew Young School of Policy Studies Georgia State University
iv
ACKNOWLEDGEMENTS
I would like to take this opportunity to express my profound gratitude to people
who have advised, inspired, and facilitated both directly and indirectly in undertaking and
completing this dissertation project. These people range from faculty, friends, and family
members who I came in personal contact with to scholars and researchers whom I have
never met in person but I was influenced by their scholarly work. I would like to begin by
thanking the chair and members of my dissertation committee.
I am immensely grateful to Dr. Mark Rider, my dissertation committee chair.
Without his valuable guidance and inspiration this dissertation project would not have
been possible. I gratefully recall his valuable advices at every stage of this dissertation
project. My profound gratitude also goes to the members of my dissertation committee.
Dr. Jonathan Rork’s close monitoring and great mentorship, Dr. Bruce Kaufman’s
suggestions and fatherly guidance, and Dr. Boudreaux’s comments and cooperation
throughout the writing process were invaluable. I am very much grateful to them. I would
also take this opportunity to express my gratitude to the Readers of my dissertation - Dr.
Mary Beth Walker, Dr. Jorge Martinez-Vasquez and Dr. Andrey Timofeev for their
insightful remarks.
I am also very much indebted to other faculty, staff and students at the Andrew
Young School of Policy Studies. I must also take this opportunity to extend my profound
gratitude to my friends, parents, siblings and other relatives for their inspiration and
cooperation.
Due to space constraint, I am forced to leave out names of many people who have
v
However, I must admit that the fond memories of these unsung friends will always be
with me beside the knowledge gained from this program. Finally, I would like to thank
all faculty, staff and students of Andrew Young School of Policy Studies for their
contribution towards a great learning environment conducive to the ever broadening
frontiers of research in economics and for making me feel at home during my stay at
vi
TABLE OF CONTENTS
Page
ACKNOWLEDGEMENTS ... iv
LIST OF TABLES ... viii
LIST OF FIGURES ... xiv
ABSTRACT ...xv
CHAPTER I: INTRODUCTION ...1
CHAPTER II: TRENDS IN INDUSTRIAL AGGLOMERATION: THE CASE OF U.S. MANUFACTURING INDUSTRIES, 1988-2003 ...6
Introduction ...6
Literature Review ...14
Data ...18
Agglomeration Measures ...20
Trends in Employment, Agglomeration, and Industrial Concentration……….25
Trends in Employment in the Manufacturing Industries ...25
National Trends ...25
Regional Trends ...28
Conclusion ...37
Agglomeration Trends Measured by Ellison-Glaeser Index ...38
National Trends ...38
Regional Trends ...39
Conclusion ...49
Agglomeration Trends Measured by Gini Index ...51
vii
Regional Trends ...53
Conclusion ...63
Trends in Industrial Concentration Measured by Herfindahl Index ...64
National Trends ...64
Conclusion ...66
CHAPTER III: IMPACT OF GLOBALIZATION ON MICRO-DETERMINANTS OF AGGLOMERATION: THE CASE OF U.S. MANUFCTURING INDUSTRIES, 1988-2003 ...69
Introduction ...69
Literature Review ...78
Empirical model, variable construction and data ...86
Estimation results ...100
Conclusion ...119
CHAPTER IV: CONCLUSION AND POLICY IMPLICATIONS...121
APPENDIX. TABLES ...…123
APPENDIX. FIGURES ...186
REFERENCES ...196
viii LIST OF TABLES
Table Page
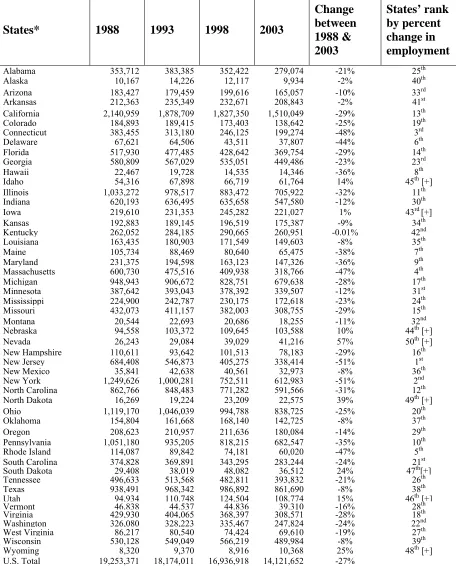
A1 State Level Total Manufacturing Employment, 1988-2003……….……..123
A2 Ten States With Highest Attrition Rates of Manufacturing
Employment between 1988 and 2003……….…..124
A3 U.S. Census Divisions Ranked by Percent Change in Manufacturing
Employment between 1988 and 2003……….……124
A4 Top Twenty 3-Digit SIC Industries Ranked by Manufacturing Employment
in 1988 and Their Employment Trends for Subsequent Years Through 2003….…...125
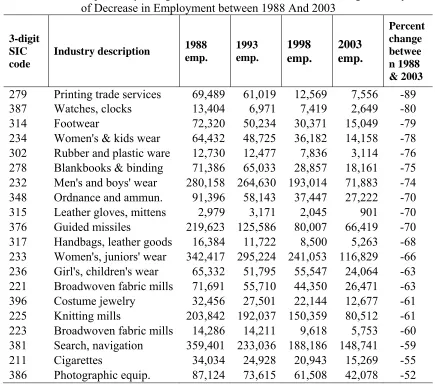
A5 Top Twenty 3-Digit SIC Industries Ranked in Descending Order by
Rate of Decrease in Employment between 1988 and 2003……….……126
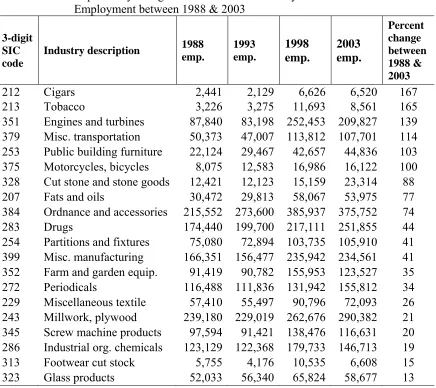
A6 Top Twenty 3-Digit SIC Industries Ranked by Rate of
Increase in Employment between 1988 and 2003……….…………..127
A7 Trends of Top Ten Manufacturing Industries in New England
Division Ranked by Employment, 1988……….………….128
A8 Trends of Bottom Ten Manufacturing Industries in New England
Division Ranked by Employment, 1988……….………….128
A9 Trends of Top Ten Manufacturing Industries in Middle Atlantic
Division Ranked by Employment, 1988……….………….129
A10 Trends of Bottom Ten Manufacturing Industries in Middle
Atlantic Division Ranked by Employment, 1988………..………...129
A11 Trends of Top Ten Manufacturing Industries in East North
Central Division Ranked by Employment, 1988……….……….130
A12 Trends of Bottom Ten Manufacturing Industries in East North
Central Division Ranked by Employment, 1988………..………....130
A13 Trends of Top Ten Manufacturing Industries in West North
Central Division Ranked by Employment, 1988……….……….131
A14 Trends of Bottom Ten Manufacturing Industries in West North
ix
A15 Trends of Top Ten Manufacturing Industries in South Atlantic
Division Ranked by Employment, 1988……….………….132
A16 Trends of Bottom Ten Manufacturing Industries in South
Atlantic Division Ranked by Employment, 1988………..……...132
A17 Trends of Top Ten Manufacturing Industries in East South
Central Division Ranked by Employment, 1988……….………….133
A18 Trends of Bottom Ten Manufacturing Industries in East South
Central Division Ranked by Employment, 1988………..………133
A19 Trends of Top Ten Manufacturing Industries in West South
Central Division Ranked by Employment, 1988……….………….134
A20 Trends of Bottom Ten Manufacturing Industries in West South
Central Division Ranked by Employment, 1988………..……134
A21 Trends of Top Ten Manufacturing Industries in Mountain
Division Ranked by Employment, 1988……….…………..135
A22 Trends of Bottom Ten Manufacturing Industries in Mountain
Division Ranked by Employment, 1988………..…….135
A23 Trends of Top Ten Manufacturing Industries in Pacific Division
Ranked by Employment, 1988……….………….136
A24 Trends of Bottom Ten Manufacturing Industries in Pacific
Division Ranked by Employment, 1988………..….136
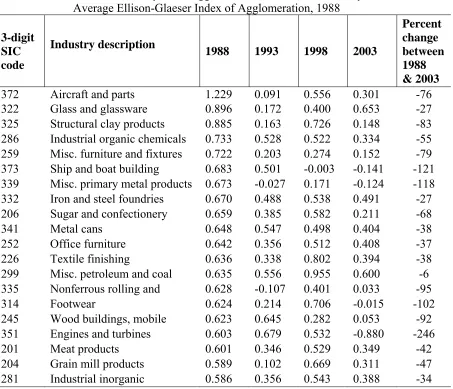
A25 Trends of Twenty Most Agglomerated Industries Ranked by National
Average Ellison-Glaeser Index of Agglomeration, 1988………..…………137
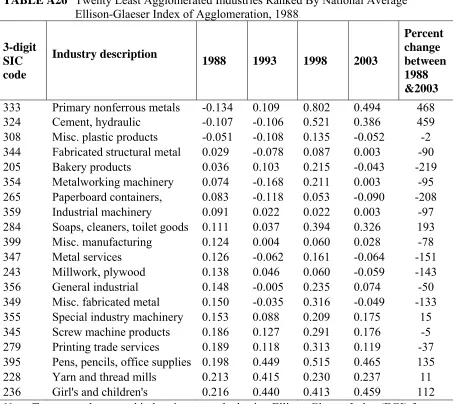
A26 Twenty Least Agglomerated Industries Ranked by National
Average Ellison-Glaeser Index of Agglomeration, 1988………..…138
A27 Trends of Ten Most Agglomerated Industries in New England
Division Ranked by Ellison-Glaeser Index of Agglomeration, 1988…………..……..139
A28 Trends of Ten Least Agglomerated Industries in New England
Division Ranked by Ellison-Glaeser Index of Agglomeration, 1988………..…..139
A29 Trends of Ten Most Agglomerated Industries in Middle Atlantic
x
A30 Trends of Ten Least Agglomerated Industries in Middle Atlantic
Division Ranked by Ellison-Glaeser Index of Agglomeration, 1988……….…….140
A31 Trends of Ten Most Agglomerated Industries in East North Central
Division Ranked by Ellison-Glaeser Index of Agglomeration, 1988…………..………141
A32 Trends of Ten Least Agglomerated Industries in East North Central
Division Ranked by Ellison-Glaeser Index of Agglomeration, 1988………….……….141
A33 Trends of Ten Most Agglomerated Industries in West North Central
Division Ranked by Ellison-Glaeser Index of Agglomeration, 1988………….….……142
A34 Trends of Ten Least Agglomerated Industries in West North Central
Division Ranked by Ellison-Glaeser Index of Agglomeration, 1988……….…….142
A35 Trends of Ten Most Agglomerated Industries in South Atlantic
Division Ranked by Ellison-Glaeser Index of Agglomeration, 1988……….…...143
A36 Trends of Ten Least Agglomerated Industries in South Atlantic
Division Ranked by Ellison-Glaeser Index of Agglomeration, 1988……….…….143
A37 Trends of Ten Most Agglomerated Industries in East South Central
Division Ranked by Ellison-Glaeser Index of Agglomeration, 1988……….…...144
A38 Trends of Ten Least Agglomerated Industries in East South Central
Division Ranked by Ellison-Glaeser Index of Agglomeration, 1988………..144
A39 Trends of Ten Most Agglomerated Industries in West South Central
Division Ranked by Ellison-Glaeser Index of Agglomeration, 1988……….…….145
A40 Trends of Ten Least Agglomerated Industries in West South Central
Division Ranked by Ellison-Glaeser Index of Agglomeration, 1988………..145
A41 Trends of Ten Most Agglomerated Industries in Mountain Division
Ranked by Ellison-Glaeser Index of Agglomeration, 1988……….…....146
A42 Trends of Ten Least Agglomerated Industries in Mountain Division
Ranked by Ellison-Glaeser Index of Agglomeration, 1988……….146
A43 Trends of Ten Most Agglomerated Industries in Pacific Division
Ranked by Ellison-Glaeser Index of Agglomeration, 1988……….147
A44 Trends of Ten Least Agglomerated Industries in Pacific Division
xi
A45 Twenty Most Agglomerated Industries Ranked by National
Average Gini Index of Agglomeration, 1988………..148
A46 Twenty Least Agglomerated Industries Ranked by National Average
Gini Index of Agglomeration, 1988……….…………149
A47 Trends of Ten Most Agglomerated Industries in New England
Division Ranked by Gini Index of Agglomeration, 1988………150
A48 Trends of Ten Least Agglomerated Industries in New England
Division Ranked by Gini Index of Agglomeration, 1988………..……..150
A49 Trends of Ten Most Agglomerated Industries in Middle Atlantic
Division Ranked by Gini Index of Agglomeration, 1988………151
A50 Trends of Ten Least Agglomerated Industries in Middle Atlantic
Division Ranked by Gini Index of Agglomeration, 1988………..……..151
A51 Trends of Ten Most Agglomerated Industries in East North Central
Division Ranked by Gini Index of Agglomeration, 1988………152
A52 Trends of Ten Least Agglomerated Industries in East North Central
Division Ranked by Gini Index of Agglomeration, 1988………..……..152
A53 Trends of Ten Most Agglomerated Industries in West North Central
Division Ranked by Gini Index of Agglomeration, 1988………153
A54 Trends of Ten Least Agglomerated Industries in West North Central
Division Ranked by Gini Index of Agglomeration, 1988………..……..153
A55 Trends of Ten Most Agglomerated Industries in South Atlantic Division
Ranked by Gini Index of Agglomeration, 1988………...154
A56 Trends of Ten Least Agglomerated Industries in South Atlantic
Division Ranked by Gini Index of Agglomeration, 1988………..……..154
A57 Trends of Ten Most Agglomerated Industries in East South Central
Division Ranked by Gini Index of Agglomeration, 1988………155
A58 Trends of Ten Least Agglomerated Industries in East South Central
Division Ranked by Gini Index of Agglomeration, 1988………..……..155
A59 Trends of Ten Most Agglomerated Industries in West South Central
xii
A60 Trends of Ten Least Agglomerated Industries in West South Central
Division Ranked by Gini Index of Agglomeration, 1988………..……..156
A61 Trends of Ten Most Agglomerated Industries in Mountain Division
Ranked by Gini Index of Agglomeration, 1988………..…….157
A62 Trends of Ten Least Agglomerated Industries in Mountain Division
Ranked by Gini Index of Agglomeration, 1988………..…….157
A63 Trends of Ten Most Agglomerated Industries in Pacific Division
Ranked by Gini Index of Agglomeration, 1988………..…….158
A64 Trends of Ten Least Agglomerated Industries in Pacific Division
Ranked by Gini Index of Agglomeration, 1988………..……….158
A65 Twenty Most Concentrated Industries Ranked by
National Average Herfindahl Index, 1988………..……….159
A66 Twenty Least Concentrated Industries Ranked by
National Average Herfindahl Index, 1988……….………..160
A67 Top Ten Manufacturing Industries by Employment in the U.S. ……….…..…..161
A68 Summary of Some Recently Published Papers on Micro-
Determinants of Agglomeration……….….…162
A69 Industries Ranked by Labor Pooling Index (LP), 1988………..……163
A70 Industries Ranked by Goods Pooling Index (GP), 1988……….……..…..163 .
A71 Industries Ranked by Idea Pooling Index (IP1), 1988 ……….………..…164
A72 List of All Industries Bridged Across SIC and NAICS Codes………..….…....165
A73 List of Selected 3-Digit Industries Bridged Across SIC and NAICS
Codes for the Regression Analysis……….………...168
A74 Descriptive Statistics ……….….……....171
A75 OLS and Fixed Effect Regressions of Ellison-Glaeser Agglomeration Index.……...172
A76 OLS and Fixed Effect Regressions of Ellison-Glaeser Agglomeration Index………....173
A77 OLS and Fixed Effect Regressions of Gini Index….……..………...…...174
xiii
A79 Industries Ranked by Idea Pooling Index (IP2), 1988………176
A80 List of Information and Communication Technology (ICT) Intensive
Industries Bridged Across SIC and NAICS Codes*……….…..177
A81 OLS and Fixed Effect Regressions of Ellison-Glaeser Agglomeration Index
(Variables Interacted with ICT - Intensive Industries)………....178
A82 OLS and Fixed Effect Regressions of Ellison-Glaeser Agglomeration Index
(Variables Interacted with ICT - Intensive Industries)………...180
A83 OLS and Fixed Effect Regressions of Gini Index (Variables Interacted with
ICT - Intensive Industries)……..………..…………182
A84 OLS and Fixed Effect Regressions of Gini Index (Variables Interacted with
xiv LIST OF FIGURES
Figure Page
B1 Total manufacturing employment in the United States, 1988–2007………..….186
B2 Manufacturing output as percent of GDP in the United States,
1988–2008. Data………..187
B3 Historical Manufacturing Output in the United States, 1988–2007………..…..…188
B4 Growth In Manufacturing Output per Worker Hour in the
United States, 1988-2007 ………189
B5 Total Manufacturing Employment in the United States In 1988 and 2003………...…..190
B6 Hypothetical Employment Shares of Manufacturing Industries
In A Four Region Economy………...………..191
B7 Gini Index for Employment Concentration ………....192
B8 Average Import Duty Rate in the United States from 1989 to
2001………...193
xv ABSTRACT
ESSAYS ON TRENDS IN INDUSTRIAL AGGLOMERATION: THE CASE OF U.S.
MANUFACTURING INDUSTRIES FROM 1988 TO 2003
By
ABDULLAH M. KHAN
MAY 2009
Committee Chair: Dr. Mark Rider
Major Department: Economics
This dissertation consists of two essays dealing with the trends in industrial
agglomeration and changes in the influence of micro-determinants of agglomeration due
to globalization in the U.S. manufacturing agglomeration and the second essay discusses
the impact of globalization on the micro-determinants of agglomeration. The first essay
explores recent agglomeration trends in the U.S. manufacturing industries between 1988
and 2003 using employment and employment-based agglomeration measures such as
Ellison-Glaeser Index and Gini index, and using Herfindahl index as a measure of
industrial concentration due to scale economies. Between 1988 and 2003, forty two states
lost and eight states gained manufacturing employment with a net loss of more than 5.13
million jobs nationwide. Middle Atlantic, New England, and South Atlantic are the three
divisions with highest drops in manufacturing employment with Middle Atlantic
division’s loss of 45 percent jobs, New England division’s loss of 44 percent and South
Atlantic division’s loss of 28 percent of jobs in the manufacturing industries. Three
states that experienced the most decrease in manufacturing jobs in 2003 measured in
xvi
and Connecticut (48 percent). Textile and apparel industries, metal related industries and
leather and leather goods industries etc. are among the industries that experienced
relatively higher attrition in manufacturing jobs in 2003. Three trends are apparent. First,
employment has declined across regions, years and industries. Second, the industries that
were among the most agglomerated industries in 1988 have generally displayed decrease
in agglomeration indices (both in terms of EGI and Gini measures) in later years
including 2003. This trend may imply that for these industries, attrition of manufacturing
employment in later years mainly occurred from the counties with relatively higher share
of employment in the concerned industries in 1988. Third, industries that are found to be
least agglomerated in 1988 have often displayed increase in agglomeration in later years
including 2003. This trend may imply that for these industries, attrition of manufacturing
employment in 2003. This trend may imply that for these industries, attrition of
manufacturing employment in 2003 mainly occurred from the counties with lower
employment share of the concerned industries in 1988. Similar trends are observed for
the Herfindahl indices. Changes in the Herfindahl indices may be due to changes in
traditional scale economies caused by advancements in the ICTs.
The second essay explores the differential impacts of technological advancements
and trade liberalization on the three Marshallian determinants of industrial agglomeration
for U.S. manufacturing industries. These three micro-determinants of agglomeration are
goods pooling (input sharing), labor pooling (availability of labor), and idea pooling
(knowledge spillover). The impact of decrease in employment on industrial
agglomeration is ambiguous, and warrants empirical investigation. An index of
xvii
after controlling for transportation costs, natural advantage and other state level economic
variables, and after inclusion of interaction variables for technological advancement and
trade liberalization. The regression results for both the OLS and FE specifications are
consistent with the hypothesis that there was a structural change in the effect of the
micro-determinants of industrial agglomeration in the U.S. manufacturing industries
beginning in 1995.
In the second essay, we decompose the impact of globalization on three
micro-determinants of agglomeration into two separate segments: impact of technological
advancements and impact of trade liberalization. The findings are partially consistent
with the hypothesis that globalization has attenuated the effect of micro-determinants of
agglomeration as the influence of two out of three micro-determinants of agglomeration
diminished in the post-1995 years relative to their pre-1995 levels. For example, in the
post 1995 period in our base line model, influence of labor pooling is diminished by
about 4 percent and influence of idea pooling has attenuated by about 1 percent from
their pre-1995 levels. Contrary to our hypothesis, we find that the influence of goods
pooling has increased as a micro-determinant of agglomeration in the post-1995 years
relative to its pre-1995 levels. The attenuation in influence for labor pooling and increase
in influence of goods pooling in the post-1995 period are statistically significant when
attenuation of influence of idea pooling is not statistically significant. Also, when we
decompose the total effect of globalization, we find the impact of technology to be
greater than that of international trade. The key findings are robust to alternative
specifications of the econometric model, particularly to changes in the proxies used for
1
CHAPTER I: INTRODUCTION
The study of the recent trends in manufacturing agglomeration in the U.S. and the
impact of globalization on the micro-determinants of agglomeration is important from
both academic and policy perspectives. The examination of these issues is academically
important because there is a dearth of empirical studies analyzing recent trends in U.S.
manufacturing agglomeration and the relative influence of micro-determinants of
agglomeration. But analyses of trends in industrial agglomeration after mid-1990s is
important as this period is marked with rapid advancement in information and
communication technologies, specially the mass use of internet and liberalization in
international trade facilitated by emergence of North American Free Trade Agreement
(NAFTA) and the successful conclusion of the Uruguay round trade negation which was
the harbinger of the World Trade Organization. Study of manufacturing agglomeration is
also important from policy perspective.
Once regarded as one of the largest source of U.S. employment, this sector has
lost about 5.13 million jobs between 1988 and 2003 as shown in Figure B1. During this
period manufacturing output as percent of GDP declined, manufacturing output rose and
manufacturing productivity per worker hour increased sporadically as shown in Figure
B2, Figure B3 and Figure B4 respectively. Employment is one of the central focuses of
economic development and macro-economic stabilization policy planning. Study of
recent manufacturing agglomeration trend will also shed light on the employment
is theoretically ambiguous as it may lead to increase or decrease of agglomeration in a
jurisdiction depending on whether jobs are being lost from relatively more agglomerated
regions or less agglomerated regions within the host jurisdiction. If attrition of
employment in a particular manufacturing industry is occurring from relatively less
agglomerated region (e.g. county), the relative density of agglomeration in the broader
jurisdiction (e.g., state) may increase. On the other hand, if manufacturing jobs in a
particular industry are being lost from more agglomerated jurisdiction, then
agglomeration density of that industry in the broader jurisdiction may decline. Because of
this ambiguity, we need to empirically examine the trends in manufacturing
agglomeration and the relative influence of three micro-determinants of agglomeration.
Thus, study of agglomeration would not only be informative to the academic
community but also to policy planners engaged in formulation of fiscal, as well as,
socio-economic infrastructure development policies.
In Chapter 2 we discuss the trends in U.S. manufacturing industries at the national
level and across nine Census divisions using employment data, the Ellison-Glaeser Index
of agglomeration (henceforth EGI), and the Gini index. We also examine the trends in
industrial concentration using the Herfindahl index. In this chapter, we find that Middle
Atlantic region lost highest percent (45 percent) of manufacturing jobs between 1988 and
2003. During the same time, New England region lost 44 percent jobs and South Atlantic
division and Pacific regions lost 28 percent of jobs. Out of fifty states, forty two states
experienced a loss of manufacturing jobs and only eight states experienced slight increase
in manufacturing employment with a net loss of over five million jobs nationwide. In this
economies and concentration due to internal economies or scale economies. We examine
agglomeration trends using both the EGI and the Gini index. We use the Herfindahl index
to examine trends in industrial concentration due to internal economies or scale
economies.1
According to EGI, the most agglomerated 3-digit SIC industry is aircraft and parts
(SIC 372), followed by glass and glassware (SIC 322), structural clay products (SIC 325),
industrial organic chemicals (SIC 286) and others. All of these industries’ agglomeration
density decreased between 1988 and 2003. On the other hand, some of the industries
those were among the least agglomerated in 1988 displayed increase in agglomeration in
2003. These industries include primary and nonferrous metal (SIC 333), cement (SIC
324), soaps, cleaners and toilet goods (SIC 284), special industry machinery (SIC 355)
and others.
Using Gini as a measure of agglomeration we find that structural clay products
(SIC 325), industrial organic chemicals (SIC 286), wood buildings and mobile homes
(SIC 245), glass and glassware (SIC 322) etc. are among the most agglomerated
industries in 1988. Here we also find that industries that were least agglomerated in 1988
per the Gini index have displayed increase in agglomeration in 2003.
Herfindahl index measures industrial concentration in manufacturing industries
that arises due to internal economies of scale. Using this measure we find that guided
1 Internal economies of scale economies are internal to firms and refer to cost savings that
accrue due to mass productions using large plants. External economies refer to cost
savings that agglomerated firms receive from a larger diversity of activities and a higher
missile and space vehicles (SIC 376), handbags and personal leather products (SIC 317),
primary nonferrous metal (SIC 333), engines and turbines (SIC 351) etc. are among the
industries displaying most industrial concentration. It seems that capital and technology
intensive manufacturing industries have more opportunity to achieve internal economy of
scale.
As revealed in the employment trend analysis over sixteen years (1988-2003),
manufacturing jobs are attenuating across regions and industries. From agglomeration
trend analysis using the EGI measure, we find that most industries displayed decrease in
agglomeration between 1988 and 2003. This finding implies that manufacturing jobs are
being lost from the relatively more agglomerated regions causing the agglomeration
index to decline for the concerned 3-digit SIC industries in the host states. At the regional
level, industries that displayed agglomeration in 1988 displayed deagglomeration in
recent years. On the other hand, industries that displayed the least agglomeration in 1988
displayed more agglomeration in recent years. Using patent count in 1988 as a measure
of industrial innovativeness we find that for several regions, industries that displayed
increase in agglomeration over the period under study were more innovative (i.e., had
more patent certifications in 1988) than industries that displayed decrease in
agglomeration between the same period.
In Chapter 3 we explore the impact of globalization on the three
micro-determinants of agglomeration. These three micro-micro-determinants of industrial
agglomeration are labor pooling (availability of workers), goods pooling (input sharing),
and idea pooling (knowledge spillover). Globalization in recent years has been facilitated
communication technologies (ICTs) and trade liberalization. Recent advancements in the
ICTs, especially that in the internet and other web based communication tools, have
significantly altered the old paradigm of manufacturing landscape in the U.S. and around
the world. Internet and other web-based communication tools have arguably enhanced
sharing of knowledge and performance of economic activities over long distances. The
enactment of the North American Free Trade Agreement (NAFTA), and World Trade
Organization have contributed to further liberalization of international trade.
As shown in the estimation results in Chapter 3, we find that the influence of
labor pooling and idea pooling are diminished due to globalization, whereas the influence
of goods pooling is increased due to it . This makes intuitive sense because, with the
advent of modern ICTs including the internet, it is possible to share ideas and perform
some routinized task from long distance via web based ICTs and industrial robots. But
for material input heavy manufacturing firms, location near sources of raw materials
remain to be a critical consideration for agglomeration. In this chapter we decompose the
total effect of globalization into two separate effects. It turns out that technological
advancement effects are generally stronger than trade liberalization effects on LP and IP
CHAPTER II: TRENDS IN INDUSTRIAL AGGLOMERATION: THE CASE OF
U.S. MANUFACTURING INDUSTRIES, 1988-2003
Introduction
Manufacturing industries in the U.S. are going through significant changes in
response to globalization, such as technological change and trade liberalization. These
changes are generally marked by increases in labor productivity and manufacturing
output and by decreases in manufacturing employment and by decreases in the relative
contributions of the manufacturing sector to Gross Domestic Product (GDP).2
Technological advancement increases labor productivity and thus allows the production
of target levels of output with fewer workers. Trade liberalization exposes domestic
industries to increased foreign competition. This exposure forces U.S. firms to be more
cost-effective and innovative in order to survive and thrive. Thus, trade liberalization
forces firms to cut back on production, move plants off-shore, or close.
Globalization is being driven by technological advancements that facilitate
communication and trade liberalizations. Recent advances in the internet and other
web-based information and communication technologies (ICTs) have reduced the costs and
increased the quality of distant communication and thus have contributed to more
cost-effective management of supply chains over long distances.3 The internet was officially
2 These trends are shown in Figures B1 through B4, in Figure B8, and in Tables A1
through A4.
3 In fact, data show that the growth rate of U.S. labor productivity fell in the 1970s and
open for commercial usage after the decommissioning of the National Science
Foundation–managed NSFNet in 1995. Additionally, recent trade agreements have
reduced tariff and non-tariff barriers to international trade. Since 1994, tariffs and
quantitative restrictions on international trade between the U.S., Canada, and Mexico
have declined, and eventually all remaining tariff and quantitative restrictions were
phased out under the provisions of the North American Free Trade Agreement
(NAFTA).4 The U.S. further lowered tariffs on goods imported from a large number of
countries in 1995 as a result of the successful conclusion of the Uruguay round of the
General Agreement on Tariffs and Trade (GATT). These events have effectively
facilitated the ease of communication and increased international trade, which in turn has
increased the outsourcing by domestic companies and by U.S.-origin multi-national
corporations (MNCs) of the production of many intermediate and final goods. .
Technological advancement increases labor productivity and has positive effects
on the comparative advantage of the incumbent country.5 Recent technological
productivity is discussed in several books and articles, including Krugman and Wells
(2006, p. 597) and Jimeno and Saiz (2006), who attribute the observed increase in labor
productivity to technological advancements, such as the ICT revolution.
4 As per the information provided at the website of the Office of the United States Trade
Representative, the remaining tariffs and quantitative restrictions were eliminated in
January 2008 (Retrieved from
http://www.ustr.gov/trade-agreements/free-trade-agreements/north-american-free-trade-agreement-nafta November 08, 2008).
5 There is a wealth of theoretical and empirical papers on the labor-productivity
advancements may boost U.S. manufacturing output and thus may increase U.S.
manufacturing exports. Under such a scenario with increased trade liberalization,
export-intensive manufacturing industries would grow, which could lead to increased
agglomeration of these manufacturing industries in the U.S. On the other hand,
technological advancement and trade liberalization may cause the agglomeration of U.S.
manufacturing industries to decline if such firms lose their cost-competitiveness to their
foreign counterparts. Because of this ambiguity in the potential impact of technological
advancement and trade liberalization on manufacturing employment agglomeration, it is
important that we empirically analyze recent trends in the agglomeration of U.S.
manufacturing industries. Kim (1995) examines the trend in U.S. regional manufacturing
structure from 1870 to 1987. However, the period since 1987 is of particular interest,
since the three major events mentioned above (i.e., enactment of NAFTA and GATT and
commercial use of the internet) happened after this period.
We find that, during the period between 1988 and 2003, the U.S. has lost about
five million manufacturing jobs, most of them in Middle Atlantic (-45 percent), New
England (-44 percent), South Atlantic (-28 percent), and Pacific (-28 percent) divisions.
Also, we find that the agglomeration for most of the manufacturing industries has
declined during this period as measured by EGI and Gini indices.
Following Marshall (1890), three types of agglomeration externalities are well
known in the literature. One type is Marshall-Arrow-Romer externalities, also known as
issue is Solow (1956). Some recent empirical work on this topic includes Matteucci et al.
(2005) and Atrostic and Nguyen (2002).
“MAR externalities.” This type of externalities mainly arise from special concentration of
similar firms.
Another type is “Jacob externalities” that occur mainly from the co-agglomeration
of firms from different industries, thus providing opportunities for inter-industry
collaboration and knowledge-sharing. Now let us briefly explore why the benefits of
Jacobs externalities decline as industries mature. The main source of Jacob externalities
is inter-industry collaboration, which allows firms to tap into economic knowledge from
different sources. This sharing of knowledge among different kinds of industries is more
relevant for product innovations. But as industries mature, their innovation intensity
shifts from product innovation to process innovation, where inter industry
knowledge-sharing is arguably less relevant. For this reason, the benefits of agglomeration in the
form of Jacob externalities would decline as industries mature.
A third type of externalities are known as “urbanization externalities” which refer
to benefits of agglomeration that can arise due to city size or density of agglomeration.
Frequently used measures of agglomeration are Ellison-Glaeser Index (EGI) and Gini
Index, and a measure of industrial concentration is the Herfindahl Index. The EGI is
constructed using the Gini index and the Herfindahl index. We discuss agglomeration
trends using these three indices as well as in terms of employment data. In this
dissertation we mainly examine agglomeration due to Marshall-Arrow-Romer
agglomeration externalities via goods pooling (GP, labor pooling (LP) and idea pooling
(IP).
Economies of GP are the cost savings that agglomerated ‘input-heavy’ firms
suppose a firm has a crane and a forklift. When the firm is using the forklift, the crane is
idle. If the firm is spatially isolated, it cannot lease the idle crane to another firm.
However, if firms using cranes and forklifts collocate, then these indivisible inputs can be
shared. As Duranton and Puga (2004) contend, such ‘input-heavy’ agglomerated firms
can also save costs by sharing many indivisible public goods, production facilities, and
market places which might be prohibitively expensive to access for an isolated firm. For
example, it may be prohibitively expensive to set up power plant for a firm located in
isolation. But agglomerated firms can share the expenses of setting up of such plants with
heavy fixed costs and thus can minimize production costs. Thus, proximity to one another
reduces the costs of production to each agglomerated firm relative to the case of
dispersed firms. Cost savings from such input sharing is an important motivation of
agglomeration for input-heavy firms. Arguably, the more ‘input-heavy’ a firm is the more
interested it may be in agglomerating due to goods pooling reasons.
Economies of LP are the cost savings available to agglomerated firms from
efficient matching of the demand and supply sides of the labor market. For example,
when firms locate nearby an abundant supply of labor with skills matching the
requirements of the industry, there are cost savings as a result of lower hiring costs and/or
productivity increases. Furthermore, Helsley and Strange (1990) and Overman and Puga
(2009) contend that large labor markets improve the chances of matching the skill
requirements of firms with the particular skills of workers. Increasing the average quality
of matches increases the productivity of labor and thus lowers the costs of producing a
Economies of IP are the cost savings that accrue to agglomerated firms from
sharing knowledge about industrial best practices and sharing knowledge about the
results of research and development (R&D) activities. For example, when firms are
agglomerated, industrial workers and researchers of similar interests and abilities have
greater opportunities to share knowledge and ideas critical for successful innovation.
Such innovations reduce the costs of production and allow firms to differentiate their
products and thereby increase their market shares.
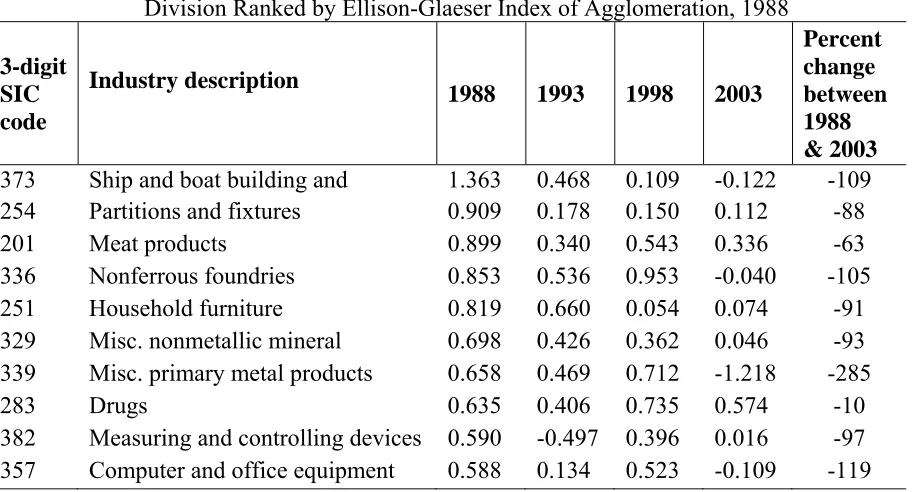
Measured by the Ellison-Glaeser Index (EGI), the most agglomerated 3-digit SIC
industries in 1988 included aircraft and parts (SIC 372), glass and glassware (SIC 322),
structural clay products (SIC 325), industrial organic chemicals (SIC 286), miscellaneous
furniture and fixtures (SIC 259), ship- and boat-building (SIC 373), and miscellaneous
primary metal products (SIC 339).6 All of these industries display deagglomeration in
2003 relative to the level in 1988. The least agglomerated industries as measured by EGI
include primary non-ferrous metal (SIC 333), hydraulic cement (324), miscellaneous
plastic products (SIC 308), fabricated structural metal products (SIC 344), Bakery
products (SIC 205), and Metalworking machinery (SIC 354). Out of these six industries
four industries (miscellaneous plastic products, fabricated structural metal, bakery
products, metalworking machinery) displayed deagglomeration; two of these (primary
nonferrous metal and hydraulic cement) display further agglomeration.7
6 National average EGI values are calculated by averaging state-level EGI values.
7 National trends in agglomeration of the twenty most agglomerated industries and twenty
least agglomerated industries as measured by EGI are listed in Tables 8 and Table 9,
Using the Gini Index as a measure of agglomeration, we find that structural clay
products (SIC 325), industrial organic chemicals (286), wood buildings and mobile
homes (SIC 245), glass and glassware (SIC 322), books (SIC 373), miscellaneous
petroleum and coal products (SIC 299), and textile finishing (SIC 226) are the most
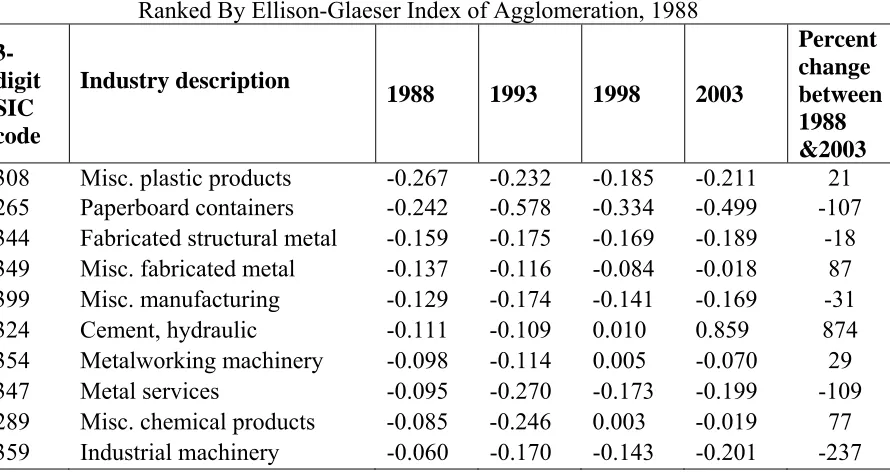
agglomerated industries in 1988.8 The least agglomerated industries as measured by Gini
indices include: miscellaneous plastic products (SIC 308), industrial machinery (SIC
359), metalworking machinery (SIC 354), fabricated structural metal (SIC 344),
miscellaneous manufacturing (SIC 399), millwork and plywood (SIC 243), and
miscellaneous fabricated metal products (SIC 349). Of the industries mentioned, three
(miscellaneous plastic products, metalworking machinery, and miscellaneous fabricated
metal products) display further agglomeration, three (industrial machinery, miscellaneous
manufacturing, and millwork and plywood) display further deagglomeration, and one
industry (fabricated structural metal products) displays no change in agglomeration.9
The Herfindahl Index is a measure of industrial concentration. When using this
measure, we find the following to be among the most concentrated industries in 1988::
guided missile and space vehicles (SIC 376), handbags and personal leather products
(SIC 317), primary nonferrous metals (SIC 333), engines and turbines (SIC 351), and
ordnance and accessories (SIC 348). All five of these most concentrated industries
display less concentration in 2003 than in 1988. Measured by Herfindahl indices, the
8 National average Gini indices are calculated by averaging the state-level Gini indices.
9 National trends in agglomeration of the twenty most agglomerated and twenty least
agglomerated industries as measured by Gini indices are listed in Tables 10 and Table 11,
least concentrated industries in 1988 include hydraulic cement (SIC 324), industrial
machinery (SIC 359), miscellaneous manufacturing (SIC 399), millwork and plywood
(SIC 243), and commercial printing (SIC 275). All of these industries displayed further
concentration in 2003, except commercial printing (SIC 275), which demonstrated a
decrease in concentration.10
As discussed in greater detail below, , three trends are quite apparent at both the
national and regional levels. First, there has been a significant drop in manufacturing
employment in recent years. Second, industries displaying the most agglomeration
(according to both the EGI and the Gini indices) in 1988 display decreased agglomeration
in subsequent years. Third, industries displaying the least agglomeration in 1988
generally display increased agglomeration in the study’s later years.
The remainder of this chapter is organized as follows. Section 2 describes a
review of the literature. Section 3 discusses the data and the bridging of industries across
SIC and NAICS regimes. Section 4 analyzes the trends in employment, agglomeration,
and industrial concentration for 3-digit SIC manufacturing industries at the national and
regional levels. This section also briefly discusses the agglomeration trends for
information and communication technology (ICT)-intensive industries. Section 5
concludes.
10 National trends in the twenty most concentrated industries and twenty least
concentrated industries as measured by Herfindahl indices are reported in Tables 12 and
Literature Review
Kim (1995) discusses the long-run trends in the regional specialization and
localization economies for U.S. manufacturing industries from 1860 to 1987. This study
compares relative regional specialization among nine census regions and reports that the
degree of regional specialization in U.S. manufacturing industries increased between
1860 and World War I after a slight decline between 1860 and 1890. Kim also examines
regional localization patterns for U.S. manufacturing industries for the same period for
SIC 2-digit industries and reports a slight decrease in overall U.S. regional
specialization.11 His study finds that localization indices rose for eleven 2-digit industries
and decreased for nine 2-digit SIC industries.12
The level of regional specialization reached its peak between the 1910s and 1920s
and decreased significantly from then until 1987. According to Kim (1995), degree of
regional specialization increased between 1880 following a modest decline between 1860
11 Kim (1995) uses Krugman’s (1991) index of regional specialization and Hoover’s
(1996) index of regional localization in his analyses, which are shown in the appendix
section of this paper.
12 Industries for which localization increased over the 1860–1987 period include tobacco
(SIC 21), textiles (SIC 22), apparel (SIC23), furniture, fixtures (SIC 25), petroleum and
coal (SIC 29), primary metals (SIC 33). Industries for which localization indices
decreased include food (SIC 20), paper (SIC 26), chemicals (SIC 28), electrical
and 1890. The level of regional concentration reached its peak between the interwar
years (i.e., from 1919 to 1938) before falling continuously through 1987.
Kim (1999) also analyzes the regional comparative advantages measured by
relative factor endowments for U.S. manufacturing industries from 1880 to 1987. He
regresses the industrial output of twenty SIC 2-digit industries on seven measures of
factor endowments over several decades and finds that the model’s R2 value diminishes
as time progresses, implying the growing importance of agglomeration economies in
influencing industrial productivity.13 Besides reporting regression results, Kim (1999)
also reports results regarding factor intensities using a capital-to-labor ratio and
cost-of-materials-to-labor ratio. Industries such as petroleum (SIC 29), chemicals (SIC 28), and
primary metals (SIC 33) are capital intensive; industries such as apparel (SIC 23),
furniture (SIC 25), instruments (SIC 38), etc., are labor intensive.
Ellison and Glaeser (1997) examine the industrial localization of U.S.
manufacturing industries at 4-digit SIC levels and find evidence of industry localization
for natural advantage reasons and of co-agglomeration in industries with strong
upstream-downstream linkages. They propose a new measure of industrial agglomeration
known as the Ellison-Glaeser Index (EGI), which they contend does a better job in
controlling for effects of internal economies of scale or large plant sizes. They find textile
mill products (SIC 22) to be one of the most highly agglomerated industries and food and
13 The seven factor endowments are labor, capital, agriculture, tobacco, timber, petroleum
and minerals. The regression results suggested that regional variations in productivity of
manufacturing industries are significantly influenced by variations in regional factor
kindred products (SIC 20) to be one of the least agglomerated industries. Rosenthal and
Strange (2001) examine the micro-determinants of agglomeration using manufacturing
employment data for the year 2000. Using EGI as a measure of industrial agglomeration,
they find a positive and statistically significant relationship between industrial
agglomeration and the micro-determinants of agglomeration. As in Rosenthal and
Strange (2001), some of the most agglomerated industries in the state-level analysis
(4-digit SIC industries) include Schiffli machine embroideries (SIC 2397), the carpet
industry (SIC 2273) and thread and handwork yarns (SIC 2284).
Rork (2005) explores the long-run impact of fiscal-incentive-driven economic
development policy on regional industrial structure in terms of factor intensity and the
skill level of workers for the Southern region of the United States. He finds that primarily
labor-intensive firms did respond to such fiscal incentives. As a result, Southern states
became a hub of low-skilled-labor-intensive manufacturing industries when the national
trend was to move from unskilled to skilled labor.
Several papers attribute the decline in U.S. manufacturing employment to the
growth in the foreign outsourcing of manufactured goods. For example, Burke et al.
(2004) link U.S. manufacturing job losses to the concurrent increase in foreign
outsourcing. Using national input-output data, they examine the sources of inputs of 19
major manufacturing industries for the period between 1987 and 2002. The share of
foreign-sourced inputs in total manufactured inputs almost doubled between 1987 and
2002, from 12.4 percent to 22.1 percent. Similarly, Vogiatzoglou (2006) reports evidence
that U.S. manufacturing was increasingly relocating to Mexico during the same period.
manufacturing employment to labor-productivity growth as a result of recent advances in
ICTs and to the increase in global competition as a result of trade liberalization. In short,
the combined effects of the ICT revolution and trade liberalization are contributing to the
erosion of employment among U.S. manufacturing industries.14 The resulting increase in
global competitiveness forces less-competitive U.S. manufacturers to scale down their
operations, move their plants to off-shore locations, or leave the industry.
The effect of foreign outsourcing on industrial agglomeration in the U.S. is
ambiguous. O’Brien (1992) and Cairncross (1997) contend that increased globalization is
eroding the importance of location for economic activity. In contrast, Ohmae (1995),
Porter (1998), and Fujita et al. (1999) contend that globalization is in fact increasing the
importance of location. These competing views warrant further examination of
agglomeration trends in the U.S. manufacturing industries using more recent data.
14 Henceforth, outsourcing as a result of trade liberalization and technological
advancement will be referred to as globalization. However, these two mechanisms (i.e.,
trade liberalization and technological advancement) are likely to affect the
Data
We calculate the agglomeration of manufacturing industries using data provided
by the U.S. Bureau of Census. The period of this study spans 1988 through 2003, which
necessitates the use of industry data over two different industrial classification systems:
the Standard Industrial Classification System (SIC) and the North American Industrial
Classification System (NAICS). The NAICS was adopted in order to give the NAFTA
signatory countries (i.e., USA, Canada and Mexico) a common set of industrial codes.
The NAICS replaced SIC in 1997. The SIC system initially classified U.S. manufacturing
industries into twenty 2-digit “major industry groups,” which were then disaggregated
into 140 3-digit “industry groups.” These were further disaggregated into 574 4-digit
“industries.” In contrast, NAICS disaggregates manufacturing industries from 2-digit to
6-digit levels.
We bridge data across SIC and NAICS regimes for comparability purposes. The
U.S. Census Bureau provides a bridge table between 4-digit SIC industries and 6-digit
NAICS industries, using a system of three legends that indicates the relative
comparability of SIC industries and the corresponding NAICS industries. A “complete
bridge” legend indicates that the corresponding SIC and NAICS industries are perfectly
bridgeable. For these industries, we are able to construct a complete time series. A
“slightly open drawbridge” indicates that the corresponding SIC and NAICS industries
do not deviate by more than 3 percent based on sales. An “open drawbridge” indicates
that the corresponding data may contain a deviation of more than 3 percent based on sales
Due to this feature of our data, we must weigh the trade-off in calculating the
agglomeration indices for the manufacturing industries. Understandably, a strong bridge
sample represents a smaller portion of the entire manufacturing industry (a maximum of
76 industries out of 139 SIC 3-digit industries). But analyses of trends in agglomeration
of manufacturing industries would be more representative if we included more SIC
industries. From this consideration, we choose to discuss the trends in manufacturing
agglomeration using both strong bridge and weak bridge samples. The weak bridge
sample captures 139 SIC industries at the 3-digit level.15
Next we turn to a discussion of the measures of industrial agglomeration and
concentration used in this analysis. In the next section we discuss the trends in
employment, industrial agglomeration and concentration as measured by these indices.
15 For the econometric analysis of the impact of globalization on micro-determinants of
agglomeration, we use both the strong bridge data and the weak bridge data for
Agglomeration Measures
Following Ellison and Glaeser (1997), we use EGI as a measure of industrial
agglomeration because of its ability to isolate industrial agglomeration due to the
micro-determinants of agglomeration from industrial concentration due to increasing returns to
scale.16 EGI is a function of the Ellison and Glaeser’s Gini Index (EGGi) and the
Herfindahl Index (HIi) of industry i.17 To better appreciate the construction of EGI, we
briefly describe Hoover’s (1936) locational Gini quotient (LQim), Gini coefficient (Gi),
and Ellison and Glaeser’s Gini Index (EGGim), where the subscripts refer to industry i
and region m.
To illustrate the construction of LQim, we propose an economy with m regions (m
= 1, …, M, where Sim represents industry i’s share of total manufacturing employment in
region m, and Xm represents total manufacturing employment in region m. We define
industry i’s location quotient in region m to be LQim = Sim/Xm. This measure can be
further illustrated by a four-quadrant figure where each quadrant represents a region. As
16 As noted by Ellison and Glaeser (1997), many industries consist of a few large firms
producing the bulk of the output in a particular industry because of increasing returns to
scale; e.g., the vacuum cleaner industry (SIC 3635). About 75 percent of the workers in
this industry are concentrated in only four states. But as they explain, the observed
concentration of the vacuum cleaner industry is not due to external economies of scale or
the micro-determinants of agglomeration; rather, it is due to internal economies of scale,
which generate a heavily skewed plant-size distribution.
17 This Gini index is also known as Ellison-Glaeser’s index of raw geographical
shown in Figure B6, total manufacturing employment is uniformly distributed across the
four regions (e.g., X1 = X2 = X3 = X4 = 0.25), but employment in industry i is distributed
as follows: Si1 = 0.10, Si2 = 0.20, Si3 = 0.30, Si4 = 0.40. Using the formula given above,
the location quotients are LQi1 = 0.4, LQi2 = 0.80, LQi3 = 1.20, and LQi4 = 1.60. From
these quotients, it is evident that employment in industry i is more agglomerated in region
4 than in region 1 because LQi4 > LQi3 > LQi2 > LQi1.18
Spatial concentration also can be measured using a locational Gini coefficient
(Gi). Figure B7 is a graphical representation of the locational Gini coefficient. In Figure
B7, we plot the shares of total manufacturing employment (Xm) by region on the
horizontal axis and industry i’s employment shares on the vertical axis of a 1 x 1 square.
The diagonal line AB bisects the square. The area of the lower triangle ABC is equal to
0.5. The piece-wise linear curve represents the case when values of Sim and Xm are as
given in Figure B6. The diagonal line in Figure B7 represents the case when Sim = Xm =
0.25. In Figure B7, the area of the space between the diagonal and the piece-wise linear
curve is labelled θ1; the remaining area of the lower triangle ABC is labelled θ2. By
construction, the total area of the triangle ABC indicated by θ1 and θ2 is 0.5. Thus, the
overall locational Gini coefficient (Gi) in a given region is Gi = θ1/ (θ1 + θ2) = θ1/0.5.
18 Gallagher (2007) has a similar four-quadrant exposition of the construction of the
locational quotient (LQim) and a brief discussion of other measures of agglomeration and
co-agglomeration. In this paper we discuss the construction of locational quotient (LQim)
and the Ellison-Glaeser index of raw geographic concentration (EGGi) in similar fashion
If Sim = Xm = 0.25—i.e., if industry i’s employment shares (to be measured on the
vertical axis) are equal to the shares of total manufacturing employment (measured on the
horizontal axis) across the 4 regions—then plots of these shares would result in the
disappearance of the piece-wise linear curve as this line will coincide with the diagonal
line AB, resulting in θ1 = 0; thus, Gi = 0. When the shares of manufacturing employment
across regions are equal but industry i’s employment shares vary across the four regions
as in the example in Figure B6, the piece-wise linear curve will emerge as illustrated in
Figure B7. Using the ratios shown in Figure B6, we can calculate θ1 = 0.163 and Gi =
0.163/0.50 = 0.326. Now, suppose that industry i’s employment is solely concentrated in
a single region in our hypothetical four-region economy. In this case, θ2 = 0, θ1 = 0.5, and
thus Gi = 1.0. Therefore, the locational Gini coefficient varies between 0 and 1.0, and
agglomeration is increasing in Gi.
Ellison and Glaeser’s Gini Index (EGGi) is another well-known measure of
industrial agglomeration, which is defined as EGGi≡ 2
1
)
( im
M
m
m S
X −
∑
=where, as before,
Xm is region m’s share of total manufacturing employment and Sim is industry i’s share of
total manufacturing employment in region m. EGGi ranges between 0 and 1.0, and
agglomeration is increasing in EGGi. Returning to our previous example, EGGi = (0.25 -
0.10)2 + (0.25 - 0.20)2 + (0.25 - 0.30)2 + (0.25 - 0.40)2 = 0.05. Due to its ease of
construction this index appeals to many researchers.
The problem with this approach to measuring agglomeration is that a value of
EGGi > 0 does not necessarily mean that industry i is agglomerated as a result of external
economies of scale. For example, suppose an industry is made up of a small number of
case, EGGi will take on a large value, but it results from economies of scale rather than
the micro-determinants of agglomeration.19 To overcome this issue, Ellison and Glaeser
(1997) propose the following measure of agglomeration:
∑
∑
− − − − = ) 1 )( 1 ( ) 1 ( 2 2 is is is is is is H X H X EGGEGI , where His =
∑
= K k isk Z 1
2 is a Herfindahl index for the k
plants of industry i in state s, and Zisk represents the employment share of the kth plant of
industry i in state s.20 In the case of a perfectly competitive industry with a large number
of small plants, His approaches zero, and EGIis approaches EGGis/(1-
∑
Xis2).21 In this
case, EGI measures spatial concentration and, unlike the Ellison and Glaeser’s Gini index
19 As an example, Ellison and Glaeser (1997) refer to the situation of the U.S. vacuum
cleaner industry (SIC code 3635). Roughly 75 percent of total employment in this sector
is contained in one of the four largest plants, but this concentration is driven by the
industry’s inherent organization and not necessarily by the agglomeration forces. The
EGI was developed “to facilitate comparisons across industries, across countries or over
time. When plants’ location decisions are made as in the model, differences in the size of
the industry, the size and distribution of plants, or the fineness of the geographic data that
are available should not affect the index” (Ellison & Glaeser, 1997, p. 890).
20 Rosenthal and Strange (2001), Bertinelli and Decrop (2005) and many other
researchers have utilized this measure of agglomeration known as Ellison-Glaeser Index
(EGI). The Herfindahl index is calculated for the plant size distribution of each industry
using the county business pattern data.
21 We calculate Herfindahl index using the median employment for different plant size
(EGGis), is independent of industrial organization due to internal economies of scale.22
According to this measure, EGIis takes on a value of zero when industry i is not
concentrated in some region(s) but is uniformly distributed as might result of a random
location process. EGIis takes on a positive value when industry i is concentrated in some
region(s). In short, we use EGI because this measure of industrial agglomeration controls
for industry-specific agglomeration due to internal economies of scale and thus provides
a better measure of industrial agglomeration due to external economies of scale related to
the micro-determinants of agglomeration, natural advantage, transportation costs, and
other external factors.23
We measure agglomeration for all the 3-digit SIC manufacturing industries using
two measures—Ellison-Glaeser index (EGI) and Ellison and Glaeser’s Gini index
(EGGi). We also measure the market concentration of these industries using the
Herfindahl index (HI). We trends in industrial agglomeration and in industrial
concentration for the U.S. and for nine U.S. census divisions using these three measures.
22 Innovative use of the Herfindahl index in constructing EGI controls for the influence of
skewed plant-size distribution on the measurement of relative density of agglomeration.
23 One drawback of the Ellison-Glaeser index is the difficulty in interpreting the values.
For example, an agglomeration index of 0.20 does not have an obvious meaning, except
for comparison purposes. However, the advantages of this measure seem to outweigh its
drawbacks, particularly in the current context. We also use the Gini index as a measure of
agglomeration because this traditional measure is simpler, with its value ranging between
0 and 1. The value of EGI can be either positive or negative, indicating agglomeration or
Figure B9 provides a list of these census divisions and regions, including a list of U.S.
states that belong to these divisions..
Now we proceed with discussing national and regional employment trends in the
manufacturing industries for the period 1988-2003.
Trends in Employment, Agglomeration, and Industrial Concentration
Trends in Employment in the Manufacturing Industries
National Trends
Manufacturing employment in the U.S. has been decreasing in recent years. Table
A1 presents state- and national-level aggregate manufacturing employment for the years
1988, 1993, 1998, and 2003. Column 6 of Table A1 shows the change in employment in
2003 as a share of 1988’s employment level. We see that manufacturing employment in
the U.S. decreased from 19.3 million in 1988 to 14.1 million in 2003 (a decrease of 27
percent), which means about five million manufacturing jobs disappeared in the U.S.
during this sixteen year period. Table A1 also shows the state-level change in
employment over time. We see in column 6 of Table A1 that, out of the fifty U.S. states,
forty-two states experienced attrition in manufacturing employment between 1988 and
2003; whereas eight states gained manufacturing employment during this period.
Table A2 presents a list of ten states that lost the most manufacturing employment
in 2003 as a percent share of that in 1988. The five that lost the most were New Jersey
(decreased by 51 percent), New York (decreased by 51 percent), Connecticut (decreased
by 48 percent), Massachusetts (decreased by 47 percent), and Rhode Island (decreased by