ScholarWorks @ Georgia State University
ScholarWorks @ Georgia State University
Middle-Secondary Education and Instructional Technology Dissertations
Department of Middle-Secondary Education and Instructional Technology (no new uploads as of Jan. 2015) 5-16-2014
The Effects Of Using Visual Statistics Software On Undergraduate
The Effects Of Using Visual Statistics Software On Undergraduate
Students' Achievement In Statistics And The Role Of Cognitive
Students' Achievement In Statistics And The Role Of Cognitive
And Non-Cognitive Factors In Their Achievement
And Non-Cognitive Factors In Their Achievement
Kori Lloyd Hugh Maxwell Georgia State University
Follow this and additional works at: https://scholarworks.gsu.edu/msit_diss
Recommended Citation Recommended Citation
Maxwell, Kori Lloyd Hugh, "The Effects Of Using Visual Statistics Software On Undergraduate Students' Achievement In Statistics And The Role Of Cognitive And Non-Cognitive Factors In Their Achievement." Dissertation, Georgia State University, 2014.
https://scholarworks.gsu.edu/msit_diss/125
This Dissertation is brought to you for free and open access by the Department of Middle-Secondary Education and Instructional Technology (no new uploads as of Jan. 2015) at ScholarWorks @ Georgia State University. It has been accepted for inclusion in Middle-Secondary Education and Instructional Technology Dissertations by an authorized administrator of ScholarWorks @ Georgia State University. For more information, please contact
ACCEPTANCE
This dissertation, THE EFFECTS OF USING VISUAL STATISTICS SOFTWARE ON UNDERGRADUATE STUDENTS’ ACHIEVEMENT IN STATISTICS AND THE ROLE OF COGNITIVE AND NON-COGNITIVE FACTORS IN THEIR
ACHIEVEMENT, by KORI LLOYD HUGH MAXWELL, was prepared under the direction of the candidate’s Dissertation Advisory Committee. It is accepted by the committee members in partial fulfillment of the requirements for the degree, Doctor of Philosophy, in the College of Education, Georgia State University.
The Dissertation Advisory Committee and the student’s Department Chairperson, as representatives of the faculty, certify that this dissertation has met all the standards of excellence and scholarship as determined by the faculty. The Dean of the College of Education concurs.
Iman C. Chahine, Ph.D. Kyong-Ah Kwon, Ph.D.
Committee Chair Committee Member
Pier Junor Clarke, Ph.D. Wanjira Kinuthia, Ph.D.
Committee Member Committee Member
Gengsheng Qin, Ph.D.
Committee Member
Date
Dana L. Fox, Ph.D.
Chairperson, Department of Middle and Secondary Education
Paul A. Alberto, Ph.D.
Interim Dean
By presenting this dissertation as a partial fulfillment of the requirements for the
advanced degree from Georgia State University, I agree that the library of Georgia State University shall make it available for inspection and circulation in accordance with its regulations governing materials of this type. I agree that permission to quote, to copy from, or to publish this dissertation may be granted by the professor under whose direction it was written, by the College of Education’s Director of Graduate Studies, or by me. Such quoting, copying, or publishing must be solely for scholarly purposes and will not involve potential financial gain. It is understood that any copying from or
publication of this dissertation which involves potential financial gain will not be allowed without my written permission.
All dissertations deposited in the Georgia State University library must be used in
accordance with the stipulations prescribed by the author in the preceding statement. The author of this dissertation is
Kori Lloyd Hugh Maxwell 849 Carter Road Jonesboro, GA 30238
The director of this dissertation is
Dr. Iman Chafik Chahine
Department of Middle and Secondary Education College of Education
Kori Lloyd Hugh Maxwell
ADDRESS: 849 Carter Road Jonesboro, GA 30238
EDUCATION:
Ph.D. 2014 Georgia State University Teaching and Learning M.S. 2009 Georgia State University
Mathematics
B.S. 2005 University of the West Indies Accounting and Statistics
PROFESSIONAL EXPERIENCE:
2011-present Research Assistant Georgia State University
2010-2011 Adjunct Instructor
Clayton State University
2010-2011 Adjunct Instructor
Bauder College
2008-2009 Teaching Assistant
Georgia State University
2005-2007 Staff Auditor
PricewaterhouseCoopers
PRESENTATIONS AND PUBLICATIONS
Maxwell, K.L.H. and Chahine, I.C. (2013). Cultural immersion and mathematics teacher education: Explorations in Morocco and South Africa. Journal of Humanistic Mathematics, 3(2), 62-75.
Chahine, I.C., Kinuthia, W. and Maxwell, K. (2013). Surveying technologies for integrating indigenous knowledge systems in mathematics teaching in South Africa: Potentials and challenges. Indilinga African Journal of Indigenous Knowledge Systems: Revisiting the Research Paradigm, 12(1), 37-51.
AWARDS
Georgia State University Dissertation Grant (Fall 2013)
Georgia State University College of Education Doctoral Dissertation Grant (Fall 2013) Georgia State University STEM mini-grant (Spring 2014)
Georgia State University College of Education Outstanding Ph.D. Student Award (Spring 2014)
PROFESSIONAL SOCIETIES AND ORGANIZATIONS
THE EFFECTS OF USING VISUAL STATISTICS SOFTWARE ON UNDERGRADUATE STUDENTS’ ACHIEVEMENT
IN STATISTICS AND THE ROLE OF COGNITIVE AND NON-COGNITIVE FACTORS
IN THEIR ACHIEVEMENT by
Kori Lloyd Hugh Maxwell
This study examined the effects of visual statistics software on undergraduate
students’ achievement in elementary statistics and the role of cognitive and non-cognitive
factors in their achievement. An experimental design was implemented using ViSta – a
visual statistics program. A sample of 273 undergraduate students at a leading, urban,
southeastern research university enrolled in six sections of Elementary Statistics were
selected and randomly assigned to experimental and comparison groups. The participants
completed four surveys, with pre and post-test measures, which assessed their attitudes,
statistics self-efficacy, perceptions of their learning environment, and statistical reasoning
abilities. To further guide this study, the modified trichotomous framework
(Beyth-Marom, Fidler, & Cumming, 2008; Elliot & McGregor, 2001) of goals, cognition, and
achievement was used as the theoretical foundation to categorize the cognitive and
non-cognitive predictors in relation to student achievement.
Two quantitative data analysis methods were utilized. Mann-Whitney tests were
employed to determine if there were any statistically significant differences in overall
achievement and cognitive and non-cognitive sub-scales between the experimental and
comparison groups. Correlation analysis was used to determine if there were any
statistically significant associations between the overall grade in the course and the
solving application. Additionally, reliability analysis determined the internal consistency
of the data and fidelity of implementation analysis ensured that the intervention was
being applied appropriately.
In this study, no statistically significant differences in achievement were noted.
However, a significant difference was noted in students’ statistics self-efficacy between
the comparison and experimental groups. Finally, using the Pearson product moment
correlation (r), a statistically significant correlation was found between the overall grade
and attitudes towards the course, attitudes towards statistics in the field, interpreting and
applying statistical procedures, identifying scales of measurement, and the negotiation
scale of students’ learning environment. In order to improve undergraduate statistics
instruction, it was recommended that classes should involve more face-to-face
engagement with the instructor, focus more on student-centered practices through the use
THE EFFECTS OF USING VISUAL STATISTICS SOFTWARE ON UNDERGRADUATE STUDENTS’ ACHIEVEMENT
IN STATISTICS AND THE ROLE OF COGNITIVE AND NON-COGNITIVE FACTORS
IN THEIR ACHIEVEMENT by
Kori Lloyd Hugh Maxwell
A Dissertation
Presented in Partial Fulfillment of Requirements for the Degree of
Doctor of Philosophy in
Teaching and Learning in
the Department of Middle and Secondary Education in
the College of Education Georgia State University
Copyright by Kori L. H. Maxwell
ii
ACKNOWLEDGMENTS
I would like to acknowledge a number of very important people who contributed to and enabled the completion of this dissertation.
First and foremost, I would like to thank God, without whom none of this would be possible.
I would especially like to thank my Dissertation Chair, Dr. Iman Chahine who is a remarkable advisor, mentor, and human being. She has constantly pushed me far beyond what I thought I was capable of. I would not have been able to finish this project without her consistent guidance and support. Words are insufficient to completely express my gratitude and so I would like to simply say thank you.
I would also like to thank my dissertation committee: Dr. Pier Junor Clarke, Dr. Gengsheng Qin, Dr. Kyong-Ah Kwon, and Dr. Wanjira Kinuthia who have contributed valuable strengths and perspectives that have guided and informed me throughout the research process. Thank you for everything.
I thank my parents, Lloyd and Yvonne Maxwell, for the example they provided for me. From an early age I was able to see that if you worked hard and never gave up, you could achieve anything. I thank them for instilling in me the importance of education, hard work, and a strong belief in accomplishing and completing the goals you set for yourself. You both have never taken the credit for your contributions to my
achievements, but no one deserves it more. I share all my success with you. To my family and friends, thank you for all your unconditional support.
iii
Page
List of Tables ...v
List of Figures ... vi
Abbreviations ... vii
Chapter 1 INTRODUCTION ... 1
Statement of the Problem ... 1
Purpose of the Study ...3
Research Questions ...3
Hypotheses ...4
Definitions and Terms...4
Conceptual Framework ... 5
Significance of the Study ...9
2 REVIEW OF THE LITERATURE ... 12
The Development of the Modified Trichotomous Model ... 12
Use of Analytical Tools in Statistics ...19
Cognitive and Non-Cognitive Factors ...22
Strengths and Weaknesses of Methodologies as Cited by the Literature ...24
Focus: Gaps in the Literature ...27
Summary of the Literature ... 28
3 METHODOLOGY ... 29
Research Design... 29
Participants ...32
Data Collection ...33
Procedure ...41
Intervention ...42
Data Analysis ... 44
Limitations of the Study Design ...48
Research Permission and Ethical Considerations ...48
Role of the Researcher ...50
Summary of the Methodology ...51
4 DATA ANALYSIS AND RESULTS ... 53
Research Questions and Hypotheses ... 53
Quantitative Data Analysis ...54
Testing Hypotheses ...61
Fidelity of Implementation Analysis ...69
Qualitative Analysis ...71
iv
Recommendations ...94
Limitations ...101
Conclusions ...103
References ...107
v
Table Page
1 Demographic Data ... 33
2 Data Collection Procedures... 36
3 Cognitive and Non-Cognitive Subscales for Each Instrument ... 40
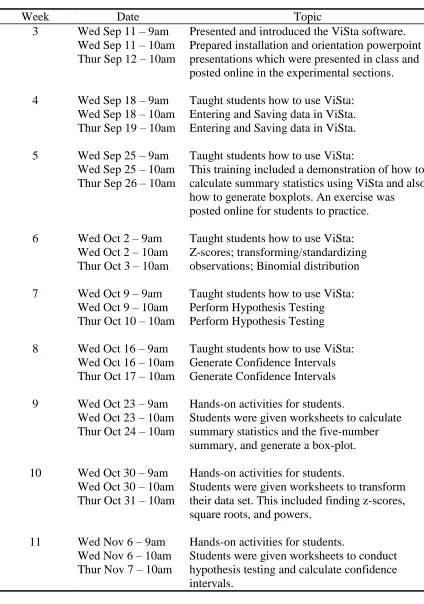
4 Implementation of ViSta Throughout the Semester ... 43
5 Percentage of Attrition for the Cognitive and Non-Cognitive Instruments ... 55
6 Participant Responses to the Instruments ... 56
7 Results of the Normality Tests ... 57
8 Results of the Nonparametric Levene Test…………...………. ... 59
9 Results of the Reliability Analysis ... 61
10 Test Statistics for the Final Grade ... 62
11 A Breakdown of Average Performance on Tests and Homework by Topic ... 63
12 Results of t Test Analysis of Average Performance on Tests and Homework... 63
13 Mann-Whitney and Mean Rank Results for the Tests and Final Exam ... 65
14 Mann-Whitney Results for Each Subscale ... 67
15 Mann-Whitney Mean Rank Results Comparing CSSES Subscales ... 67
16 Correlation Between Independent Variables and Overall Grade ... 69
vi
Figure Page
1 Modified Trichotomous Model of Goals, Cognition, and Achievement ... 6
2 Schematic Relations Among the Three Tenets of Statistical Cognition ... 7
3 Parallel Model of Framework, Factors and Instruments ... 8
4 The 2x2 Achievement Goal Framework ... 14
5 ViSta Screenshots of Various Methods of Analysis ... 21
6 Design of Non-Equivalent Group Study ... 30
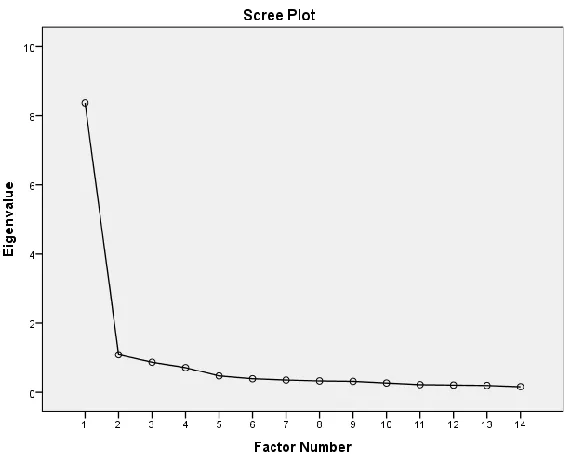
7 Scree Plot Showing the Retained Factors for the CSSES Instrument ... 40
8 Parallel Model of Research Questions, Instruments, and Data Analysis ... 47
9 Participant Attendance Rate for the Comparison and Experimental Groups ... 56
10 Median Test Scores for the Comparison and Experimental Groups ... 64
11 Growth Rate of Tests for the Comparison and Experimental Groups ... 64
12 ViSta Screenshot Showing Student Output Generated for Summary Statistics ... 75
13 ViSta Screenshot Showing Student Generated Boxplots and Line Graphs ... 76
14 ViSta Screenshot Showing Student Output Generated for Transforming Data ... 77
15 ViSta Screenshot Output for Hypothesis Testing and Confidence Intervals ... 78
16 ViSta Screenshot Output for the Topic Correlation ... 78
17 ViSta Screenshot Output for the Topic Regression ... 79
vii
AGT Achievement Goal Theory
ATS Attitude towards Statistics
CLES Constructivist Learning Environment Survey
CSSES Current Statistics Self-Efficacy Survey
SC Statistical Cognition
CHAPTER 1
INTRODUCTION
In this introductory chapter, I will first discuss (a) the statement of the problem,
(b) the purpose of the study, and (c) the research questions that were formulated along
with my hypotheses. I will continue by (d) defining terms and (e) discussing the
conceptual framework that will serve as a foundation for the study. As a conclusion, I
will (f) provide an outline of the significance of the study and a brief summary.
Statement of the Problem
This study investigated the effects of using visual statistics software (ViSta) on
undergraduate students’ achievement in statistics and the role of cognitive and
non-cognitive factors in their achievement. Elementary statistics is an area that most students
come in contact with throughout their undergraduate education. Statistics is usefully
applied in many areas whether it is to analyze and interpret data, or to graphically
represent data. Metz (2010) has indicated that statistics education is an increasingly
important component of mathematics education today. In keeping with this
acknowledgment of the significance of statistics education, Garfield, Hogg, Schau, and
Whittinghill (2002) indicated that a driving force for change in assessing students’
statistics learning has been mathematics education reform, which has established
probability and statistics as integral components within the pre-college mathematics
curriculum, defining new learning goals for students. The guidelines for assessment and
instruction in statistics education (GAISE) were developed in 2005 by the American
Statistical Association in order to address the need of a more statistically literate
guidelines enable high school students to achieve statistical literacy both personally and
professionally. The GAISE conceptual framework for statistics education is pertinent
because it aids in preparing high school students to develop their statistical understanding
and literacy, which will be useful for a successful college experience. Metz (2010) has
identified statistical concepts that are deemed necessary for statistical literacy, one of
which is visual statistics, which was the focus of this study.
Students enter the statistics classroom with varying levels of abilities. They learn
differently and so the factors that affect their learning and achievement also vary.
Cognitive and non-cognitive factors are an important aspect to underscore in research
because they inform teaching and learning. Most college students are only required to
take an elementary statistics course. This course is therefore where statistics instructors
do or do not inspire students to apply the learned statistics in their professions and in their
everyday lives. Specifically focusing on studies related to statistical achievement,
cognitive factors will allow researchers to highlight the reasoning or mental processes
that foster student statistical achievement. Conversely, non-cognitive factors will explore
the areas of student achievement that are not particularly related to mental or reasoning
ability. An examination of both types of factors covered the main contributors of student
learning and achievement in this study.
The overall importance of statistics education is to enable students to make use of
the skills they acquire in statistics outside of the classroom setting. Studies in the
literature have indicated that students need to be able to think about what they learn in
terms of conceptual, verbal, graphical, and mathematical ideas and to understand the
a comprehensive skill for understanding the world, students must also be able to utilize
and analyze visual statistics in its many forms (Cain, 2006). Young, Valero-Mora, and
Friendly (2006) discuss visual statistics as consisting of dynamic interactive graphics,
which are an interface to the traditional statistical analysis tools. Visual statistics
therefore strengthens the way we understand data and, as a result, our application of our
understanding in real-world contexts. Schau (2003) indicated that the definitive purpose
of statistics education is to engage individuals to utilize statistical thinking appropriately.
Purpose of the Study
The purpose of this study was to examine the effects of using a visual statistics
software program (ViSta – an interactive software that engages students in learning visual
statistics) on undergraduate students’ statistics achievement. Additionally, the roles that
cognitive and non-cognitive factors played in students’ statistical achievement were also
examined. This research topic was explored through the use of an experimental design
study, with experimental and comparison groups. In the experimental group, an
intervention was introduced, while the comparison group did not receive this
intervention. The intervention involved administering the visual statistics software, ViSta,
in order to study its effect on students’ engagement and application of visual statistics.
Research Questions
The following research questions were investigated:
What are the effects of the interactive visual statistics software, ViSta, on
What are the effects of the interactive visual statistics software, ViSta, on
cognitive and non-cognitive factors between the experimental and comparison
groups in elementary statistics?
What are the associations between cognitive and non-cognitive factors and
undergraduate statistics achievement in elementary statistics?
Hypotheses
The null hypotheses related to each of the research questions were as follows:
There is no statistically significant difference in achievement between the
comparison and experimental groups.
There is no statistically significant difference in cognitive and non-cognitive
factors or subscales between the comparison and experimental groups.
There is no association between overall achievement in the course and
cognitive and non-cognitive factors or subscales.
It was also hypothesized that using the ViSta program would increase
undergraduate students’ achievement in statistics, mainly through having positive impacts
on their knowledge, self-efficacy, and attitudes toward statistics.
Definitions and Terms
Cognitive Factors
Messick’s (1993) definition of cognitive factors consists of methods of
perceiving, remembering, thinking, problem-solving and decision-making that reflects
information processing and application. In this study, cognitive factors included those
factors related to student thinking, reasoning and problem solving. Garfield (1991, 2003)
thinking, reasoning, and problem solving with statistical ideas. The SRA was adopted as
a quantitative measure of cognitive factors in this study.
Non-Cognitive Factors
Non-cognitive factors have been defined in several ways in the literature and are
identified to be those factors that are not specifically intellectual or analytical in nature.
Kyllonen, Walters, and Kaufman (2011) divided non-cognitive factors into three main
categories: personality factors (for example extroversion), quasi-cognition (for example
meta-cognition), and motivation factors (for example self-efficacy); with two additional
background categories affecting these non-cognitive factors; environmental (for example
mentor support) and group factors (for example gender and ethnicity). For the purpose of
this study, the following non-cognitive factors were tested: students’ attitudes,
self-efficacy, and learning environment perception. The following instruments were used:
ATS, the Attitude towards Statistics scale (Wise, 1985), CSSES, the Current Statistics
Self-Efficacy Survey (Finney & Schraw, 2003), and CLES, the Constructivist Learning
Environment Survey (Taylor, Fraser, & Fisher, 1997). Additionally, a background survey
was administered to collect student demographics.
Achievement
In this study, achievement was measured by the students’ final grade obtained in
the class. Additionally, other areas of achievement were examined including homework
and test grades throughout the semester and final exam grades.
Conceptual Framework
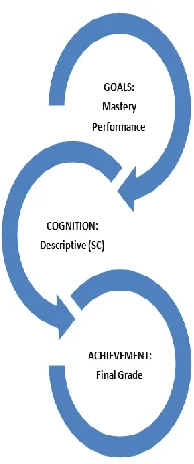
The modified trichotomous model of goals, cognition, and achievement was
Figure 1. Modified trichotomous model of goals, cognition, and achievement.
The modified trichotomous model incorporates 3 major components: a) mastery
and performance goals b) descriptive statistical cognition; and c) achievement. This
modified trichotomous model is appropriate for the research because it facilitates the
examination of cognitive and non-cognitive factors in relation to statistical achievement
in the undergraduate classroom. The modified trichotomous model emerged from a
combination of two theoretical frameworks: the Statistical Cognition (SC) framework and
the Achievement Goal Theory (AGT) framework.
Statistical Cognition Framework
SC is defined as the mental processes, representations, and activities involved in
acquiring and using statisticalknowledge (Beyth-Marom, Fidler, & Cumming, 2008). As
a result, the authors consider SC to be a field of theory research and application that has
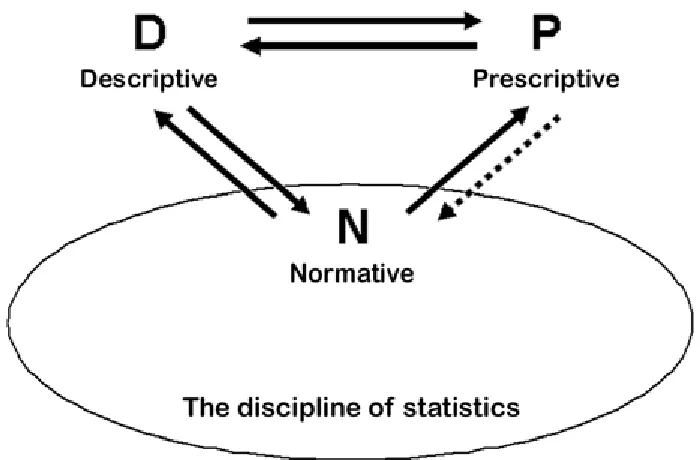
Figure 2. Schematic relations among the three tenets of statistical cognition. Adapted from “Statistical Cognition: Towards Evidence-based Practice in Statistics and Statistics Education,” by R. Beyth-Marom, F.Fidler, and G. Cumming, 2008, Statistics Education Research Journal, 7(2), 20-39.
The normative tenet of statistical cognition focuses on how people should think
about statistical concepts, which is often what individuals encounter in schools
(Beyth-Marom et al., 2008). The descriptive tenet of statistical cognition includes how
individuals obtain and apply statistical knowledge and how they think about statistical
concepts. At the core of the descriptive facet are the assessment of statistical reasoning
and the cognitive processes underlying these reasoning assessments. Finally, the
prescriptive facet of statistical cognition addresses the bridging of the gap between the
normative (what it “should” be) and the descriptive (what it “is”) tenets of statistical
cognition (Beyth-Marom et al., 2008). Prescriptive analyses utilize the logical
consequences of normative theories and the empirical findings of descriptive studies
Achievement Goal Theory
Achievement goal theory (sometimes referred to as the achievement goal
approach, goal orientation, or goal theory) is a theory in social cognition that suggests
that individuals have diverse goals or purposes for engaging in achievement behavior
(Pintrich & Schunk, 2002). In this study, goals are associated with non-cognitive factors
and factors that are related to the environment. Dalton (2010) argues that the key
characteristics of achievement in educational settings are related to the positive intention
to succeed in specifically academic endeavors. This positive intention is influenced by
non-cognitive factors such as students’ attitudes, external environmental factors, and
students’ confidence in their abilities, which produces diverse types of goals related to
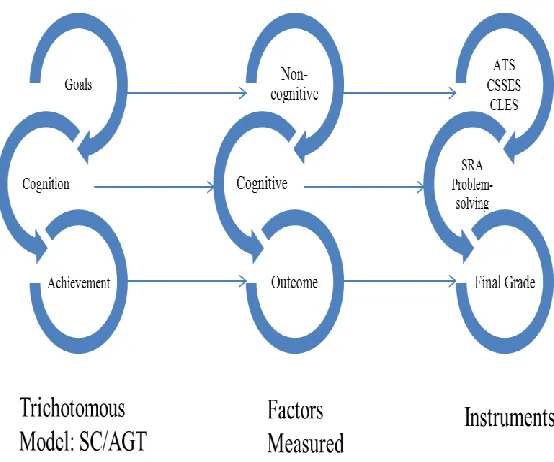
achievement outcomes. Figure 3 displays a parallel relationship among the modified
trichotomous model, the factors that were measured, and the instruments employed in this
[image:23.612.168.445.431.662.2]study.
Significance of the Study
Theoretical Significance
From a theoretical perspective, this study is significant for three reasons. First, the
research adds to previously conducted studies (Adebayo, 2008; Bell, 2008; Budé, Van De
Weil, Imbos, Candel, Broers & Berger, 2007; Chiesi & Primi, 2010; Evans, 2007; Nasim,
Roberts, Harrell, & Young, 2005; Rocheleau, 2004) by investigating the relationship
between cognitive and non-cognitive factors and academic achievement in the
undergraduate statistics classroom. Second, by focusing on visual statistics, an area that
all academic majors will encounter in their chosen professions, this study is set apart
from similar studies due to the use of the intervention – the statistical software ViSta,
which has not been used in studies related to cognitive and non-cognitive factors. Finally,
the study is multidisciplinary in that it calls for the use of higher order level technology
integration in the classroom.
Practical Significance
From a practical perspective, this study is significant for two main reasons. First,
it promotes an engagement and application of statistical learning as many students face
challenges that prevent them from learning and fully engaging in statistics. Visual
statistics is implemented and utilized in many different fields and so students need to be
proficient in the analysis and interpretation of visual displays of data in order to be
successful in their chosen profession. Secondly, the study highlights the importance of
visual statistics. Young, Valero-Mora, and Friendly (2006) posit that statistical data
analysis is a powerful tool for understanding data (where visual statistics presents data in
interface to the traditional statistical analysis tools. Results of hidden tools are presented
in such a way that it facilitates an agreement with our innate visual understanding and
mathematical statistics (Young, Valero-Mora, & Friendly, 2006). In other words, visual
statistics strengthens the way we understand data and how that understanding is applied
in the real world. The authors also indicated that graphics prove more useful when they
are dynamic and interactive, that is capable of smooth motion and instant reaction to the
user’s action, than when they are static and not interactive.
In order for visual statistics to be a useful tool for discovery through the
implementation of dynamic interactive graphics, it must aid the user in being open to
valid visual insight. Young, Valero-Mora and Friendly (2006) delineate the following
four respects that graphics must take into account: 1) Respect people – the graphic must
be dynamic enough to be manageable by various users with varying levels of perceptual
and cognitive abilities, ensuring data will be easily and accurately understood; 2) Respect
data – the nature of the data (for example categorical or numerical) must be taken into
account and must have appropriate representation and visualization; 3) Respect
mathematics – the dynamic interactive graphic must be faithful to the mathematics of the
statistical situation which ensures that the algebra of mathematical statistics translates to
the geometry of statistical visualization; 4) Respect computers – the graphics must
respect the capabilities of the computer or operating system, so much so that the dynamic
and interactive aspects of the graphics are demonstrable for a wide range of datasets.
Visual statistics allows students to be actively engaged in learning statistics
through application of the visual displays of data. How students learn and absorb visual
a high level of cognitive processing may adapt quickly to learning new methods of visual
displays of data, while students who are more influenced by non-cognitive factors (such
as motivation or attitudes) may not have the comparable reasoning skills, but have the
drive to learn what is being taught.
In summary, this study exploring cognitive and non-cognitive factors associated
with achievement was impactful because it engaged students in interactively learning
statistics, which is a departure from the normal lecture classes. The modified
trichotomous model of goals, cognition, and achievement was a useful and pertinent
guide to this study as it focused on cognitive factors, non-cognitive factors, and
achievement, which were the major measures in this study. An examination of both types
of factors covered some of the main contributors of student learning and achievement in
the undergraduate statistics classroom. This leads to an assessment of pedagogical
techniques that can be implemented to enhance the outcome of an improvement in
CHAPTER 2
REVIEW OF THE LITERATURE
In this literature review, I will first discuss (a) the development of the modified
trichotomous model and review, (b) the use of analytical tools in statistics, and (c) the
cognitive and non-cognitive factors of undergraduate student achievement, which will
include a discussion of research in the undergraduate setting, and more specifically, in the
undergraduate statistics setting. I will continue to: (d) argue and make critical notes of the
different methodologies as cited by the literature, (e) focus on the gaps in the literature
that will be addressed by the current study and (f) conclude with a brief summary of the
literature.
The Development of the Modified Trichotomous Model
In the achievement goal theory framework, the trichotomous model was built on
and developed from the dichotomous framework. The dichotomous framework of
mastery and performance objectives failed to acknowledge the valence aspect of
achievement goals. In the dichotomous framework, success and an avoidance of failure
were combined (Elliot & Dweck, 1988) or ignored altogether (Nicholls, Patashnick,
Cheung, Thorkildsen, & Lauer, 1989). Atkinson (1957) suggested that the inattention to
the approach-avoidance distinction indicated that the desire to attain success and the
desire to avoid failure are significant determinants of achievement behavior. A
rectification of this oversight was initially sought by Elliot (1997), Elliot and Church,
(1997), and Elliot and Harackiewicz, (1996) who proposed a trichotomous achievement
goal framework. In this model (which was later adapted by Covington, 2000),
avoidance goals. The trichotomous model therefore comprises
performance-approach, performance-avoidance and mastery-approach goals (Moller & Elliot, 2006).
In 2001, Elliot and McGregor argued that a fourth goal should be added to the
achievement goal framework: mastery-avoidance. Pintrich (2000) was also a proponent
of the addition of mastery-avoidance goals to the framework, which resulted in goal
attitudes being further divided between approach and avoidance attitudes. Students with
an “approach” attitude positively attempt to reach their desired goals and students with an
“avoidance” attitude attempt to avoid failing or unfavorable judgments. Both of these
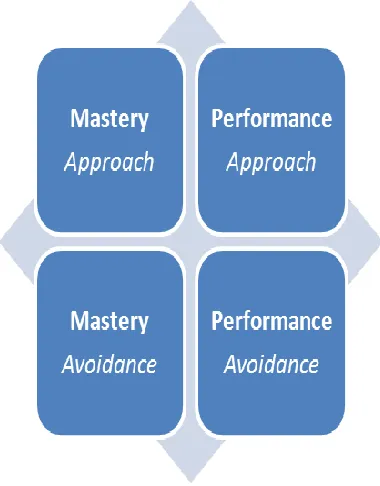
attitudes can be applied to mastery and performance goals (Dalton, 2010). Elliot and
McGregor (2001) developed the following 2x2 achievement goal framework (see Figure
4) which combines the goal orientations and the goal attitudes. The 2x2 achievement goal
framework additionally separates the mastery goal construct, which was typically viewed
as approach-oriented. This provided us with both approach and
mastery-avoidance goals. Within the mastery-goal construct, competence may be defined in terms
relative to an individual’s previous achievement. Mastery-avoidance goals focus on
incompetence relative to task requirements, for example, striving to avoid making an
error on an assignment or trying not to forget what was taught (Moller & Elliot, 2006).
The addition of the mastery-avoidance component to the achievement goal literature was
justified by viewing achievement goals as a function of two salient historical perspectives
(Elliot, 2005; Elliot, McGregor, & Thrash, 2002) involving how an individual defines or
evaluates his or her competence and an individual’s inclination to focus on approaching
Figure 4. The 2x2 achievement goal framework.
An individual’s achievement goals are therefore thought to influence the quality,
timing, and appropriateness of cognitive strategies that control the quality of one’s
accomplishments (Moller & Elliot, 2006). Senko, Hulleman, and Harackiewicz (2011)
pointed out that in the mid-1980s, several theorists distinguished between mastery goals,
aiming to develop one’s competence, and performance goals, to demonstrate one’s
competence by outperforming peers. They agree that even though the theorists had
different theoretical frameworks and used different labels for goals, they were united on
the idea that mastery goals promoted greater educational benefits than did performance
goals, especially for students retaining self-doubts (Senko et al., 2011).
Subsequently, after some studies had revealed unbalanced benefits afforded more
by performance goals, Harackiewicz, Barron, and Elliot (1998) provided a revision of
achievement goal theory emphasizing the positive potential of each goal instead of
and colleagues also revised the achievement goal construct by offering a more specific
definition grounded in competence alone. Elliot (1999) noted that defining achievement
goals in terms of “purpose” lacks precision, because purpose has two different
denotations: (1) the rationale or reason for which something is done or exists, and (2) the
aim; an intended or desired result. Purpose is used in both of these ways in the
dichotomous conceptualization of achievement goals (Elliot, 1999). The reason for
engaging in achievement behavior (to develop or demonstrate competence) is typically
included, and sometimes the aim that is pursued while engaging in achievement behavior
(objective/intrapersonal or normative competence) is also included. In the trichotomous
and 2x2 achievement goal models, Elliot and colleagues overtly separated the reason and
aim aspects of purpose and defined achievement goal solely in terms of aim (Elliot,
Murayama, & Pekrun, 2011).
The goals of the trichotomous and 2x2 achievement goal models are
conceptualized on this basis: a mastery-approach goal which focuses on the attainment of
task-based or self-based competence, a mastery-avoidance goal which focuses on the
avoidance of task-based or self-based incompetence, a performance-approach goal which
focuses on the attainment of other-based competence, and a performance-avoidance goal
which focuses on the avoidance of other-based incompetence. When achievement goals
are interpreted in this manner, the mastery-based goals are indicated to contain two
different standards for evaluation: task-based competence and self-based competence.
This raises the question of whether these two standards are similar enough to belong in a
single goal construct or are different enough to warrant separate goal constructs (Elliot,
Mastery and Performance Goals
Mastery goals have been argued to produce similar or stronger effects than
performance goals on any desirable educational outcome (Dweck, 1986; Nicholls, 1984).
This supposition points to two distinctions between these goals. The first main distinction
is that the two goals partly originate from diverse views of ability. Individuals pursuing
mastery goals tend to consider ability as a malleable attribute, something to be developed
by increasing effort (Dweck, 1986). As a result, these individuals have an affinity for
challenges and respond resiliently to adversity. On the other hand, individuals pursuing
performance goals are more prone, instead, to consider ability as a fixed characteristic
(Dweck, 1986). Consequently, those individuals who consider themselves to have high
abilities should enjoy and respond well to challenges, but those individuals who lack this
self-confidence are more prone to avoiding challenges and respond helplessly to
adversity.
The second main distinction between mastery and performance goals is in how
individuals define success versus failure (Nicholls, 1984). Successful achievement of a
performance goal requires outperforming others. In contrast, successful achievement of a
mastery goal requires meeting either task-based criteria (for example, correctly answering
80% of test questions) or, more typically, self-defined criteria (for example, feeling that
you have learned or improved). Accordingly, not all students can achieve a performance
goal, but every student can, in principle, achieve a mastery goal (Nicholls, 1984).
Mastery goals should therefore be easier to accomplish and allow for greater feelings of
competence than performance goals, which should then translate into positive educational
effects of mastery and performance goals. Some of this research has been experimental
(Elliott & Dweck, 1988; Harackiewicz & Elliot, 1993), with the majority being
conducted in the classroom setting by correlating students’ self-reported goals with a
range of educational outcomes, including achievement (for example, exam or final
grades), interest in the course material, study strategies, self-regulation, and help-seeking
behaviors. In the literature, the findings for mastery goals have been favorably consistent.
It was highlighted that students who pursue mastery goals, as opposed to performance
goals, often find their classes interesting, persevere when difficult situations are
encountered, value cooperativeness, seek help when confused, use deep learning
strategies, which allows individuals to connect what was learned to other concepts, and
perceive tasks as valuable (Darnon, Butera, & Harackiewicz, 2007; Wolters, 2004).
Despite these favorable outcomes, there are still unfavorable results. Mastery goals are
often unrelated to academic achievement. Additionally, students who adopt mastery goals
infrequently perform better in the classroom than students who do not pursue these goals
(Wolters, 2004).
The effects of performance goals may depend on how they are defined.
Performance-avoidance goals tend to produce negative effects (Elliot, McGregor, &
Gable, 1999). Normative goals appear instead to produce a more constrained and unique
set of effects. Some are reasonably unfavorable, such as mild anxiety and the application
of surface learning strategies that focus on rote memorization (Elliot et al., 1999). Others,
however, are relatively desirable, such as high effort, diligence, and most notably, high
attainment in the classroom environment (Hulleman, Schrager, Bodmann, &
displayed both inside and outside of the United States (Cury, Elliot, DaFonseca, &
Moller, 2006), in age groups ranging from middle school students (Skaalvik, 1997;
Wolters, Yu, & Pintrich, 1996) to college students (Harackiewicz, Barron, Tauer, Carter,
& Elliot, 2000), and in classes ranging from introductory courses in which grades are
more often than not determined by multiple-choice exams (Harackiewicz, Barron, Tauer,
& Elliot, 2002) to sophisticated seminars in which grades are determined primarily by
essays and participation (Barron & Harackiewicz, 2003).The originators of goal theory
always contended that performance goals could provide benefits in certain situations,
given that the students possess a high level of confidence (Dweck, 1986; Nicholls, 1984).
Nevertheless, the originators of goal theory also hypothesized that mastery goals would
be equivalent to or exceed performance goals in producing benefits to any desirable
outcome, including classroom attainment. The likelihood that performance goals might
encourage achievement in the classroom more consistently than mastery goals was never
expected. This finding, coupled with experimental evidence that normative goals also
generate greater engagement and interest than mastery goals for individuals
(Harackiewicz & Elliot, 1993), provided the impetus for Harackiewicz et al. (1998) to
propose a revision to achievement goal theory. Particularly, they urged the field to take
into account the prospective benefits of performance-approach goals and mastery goals,
and to recognize how the two goals can combine to optimize motivation. Three statistical
patterns of data were identified by Barron and Harackiewicz (2001) that would result in
favorable combinations. The first one is an interactive model in which the two goals have
a positive interaction effect on an outcome. The second is an additive model in which the
specialized model in which the two goals have unique main effects on different
outcomes. With the interactive model, the maximum benefit occurs when students pursue
both goals, while the additive model reveals the benefits to pursuing both goals. Despite
evidence for all three patterns, depending on the educational outcome being investigated,
Pintrich, Conley, and Kempler (2003) observed significant support for the specialized
model whereby normative goals are associated with achievement, and mastery goals are
associated with interest and several other desirable outcomes (Hulleman et al., 2010). The
multiple goal framework can therefore be acknowledged to rely on three assumptions: (1)
performance goals may provide some benefits more reliably than mastery goals, (2)
students can adopt both mastery and performance goals concurrently, and (3) students
can incur the benefits of each goal by pursuing both. This updated theoretical perspective
departed from the traditional mastery goal perspective that pitted mastery goals against
performance goals in an either–or framework (Hulleman et al., 2010).
Use of Analytical Tools in Statistics
To aid in supporting undergraduate students’ understanding of statistics, there are
several tutorial and analytical tools available.ViSta is an analytical statistics tool which
focuses solely on visual statistics and facilitates an interactive engagement in
visualization graphics (which develops a deeper understanding of visual statistics and
data analysis methods). More notable statistical analytical tools include Microsoft Excel,
R, STATA, SPSS, and SAS. For moderate to large datasets, STATA and SAS are more
appropriate analytical tools and require a high degree of statistical and technological
expertise to operate. The most popular open-source statistical software, R, requires
user-friendly, the statistical output in excel can appear confusing and scattered and SPSS
lacks some control over statistical output (Pope, 2012).
ViSta
ViSta is an interactive analytical tool that facilitates beginning statistics learners’
development of statistical skills. These statistical skills are not only necessary to
successfully complete the elementary statistics course, but they can be applied to
individuals’ professional lives as well, adding to their life skills.ViSta is a
non-commercial, freely available system using a moderated software distribution model. In
addition to the dynamic interactive graphics that are available in other statistical
visualization systems, ViSta contains a visual metaphor for structuring data analysis
sessions, a provision of expert guidance through the graphical tools available, and a
relevant approach to organizing and coordinating multiple dynamic graphics (Young,
Valero-Mora, & Friendly, 2006). Since this software focuses solely on visual statistics, it
provides the user with a structured environment for statistical visualization.
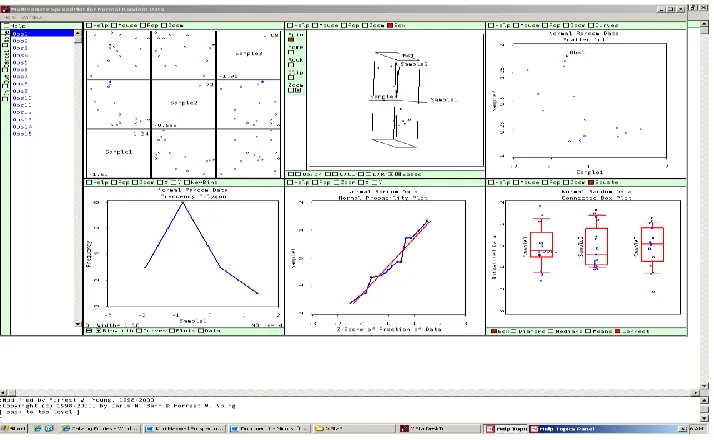
ViSta facilitates four main data analysis methods: 1) Univariate tests (for example
t-tests and z-tests), 2) Analysis of variance (ANOVA), 3) Regression, and 4) Frequency
table analysis. ViSta can also be used in conjunction with Microsoft Excel and SAS and
its most significant attributes consist of its graphical interface, interactive graphics, and
multi-view graphics (see Figure 5). Along with JMP and DataDesk, ViSta has become a
widely used statistical visualization system. JMP and DataDesk, however, are
Figure 5. ViSta screenshots of various methods of analysis.
Recent research on the use of ViSta is limited (Ledesma, Macbeth, & Cortada de
Kohan, 2009; Ledesma & Valero-Mora, 2007; Valero-Mora & Ledesma, 2011) and there
is no literature on the use of ViSta in an educational setting to support students’
understanding of visual statistics. The existing body of literature has focused on using the
visual statistics software to apply statistical methods (Ledesma & Valero-Mora, 2007), to
explore the use of the interactive graphics in ViSta to teach multivariate data analysis
(Valero-Mora & Ledesma, 2011) or to compute statistical measures (Ledesma, Macbeth,
& Cortada de Kohan, 2009). Ledesma and Valero-Mora (2007) highlight the use of
ViSta-PARAN (a plug-in for ViSta) in carrying out parallel analysis. Parallel analysis is a
Monte Carlo simulation that determines the number of factors to retain in Principal
Component and Exploratory Factor Analysis. The ViSta-PARAN program offers two
options for output (visual and numerical) and provides parametric and non-parametric
Valero-Mora and Ledesma (2011) explore the use of ViSta and its interactive
graphics to teach multivariate data analysis to Psychology students. Three techniques
were explored: 1) parallel coordinates/box plots; 2) principal components/exploratory
factor analysis; and 3) cluster analysis. Using interactive graphics, students were able to
perform important parts of the analysis by identifying, selecting and changing or
manipulating observations. This hands-on, interactive experience proved useful for
teaching multivariate data analysis to Psychology students because of their tendency to
have low to moderate proficiency in mathematics and statistics.
There is evidence in the literature supporting the use of interactive and dynamic
graphics for introducing multivariate data analysis, allowing students to apply these
techniques entirely or partially in a graphic/interactive way, and providing insights into
the procedures that do not stem easily from the formulae. Dynamic graphics are special,
computer-based statistical graphics that change in response to direct user manipulation
(Young, Valero-Mora, and Friendly, 2006).
While there has been some evidence reported regarding the potential of ViSta in
visual statistics, the research, however, has not explicitly examined the effect of using the
software on students’ learning. This study is therefore a pioneer study as it will contribute
to the field of statistics education by using ViSta as a tool to enhance students’ learning
and engagement in elementary statistics, measuring the effect of using this tool.
Cognitive and Non-Cognitive Factors
Using the most recent and relevant literature (Adebayo, 2008; Bell, 2008;
Harackiewicz et al., 2002; Nasim et al, 2005; Smith & Schumacher, 2005; Ting, 2009;
achievement in an undergraduate setting were examined. In these studies (see Appendix
A), the researchers employed the use of quantitative techniques to provide answers to
their research questions.
The aforementioned studies examined the impact of cognitive and/or
non-cognitive factors on student achievement in various academic and non-academic
disciplines. Considering research on the impact of cognitive and non-cognitive factors on
general student achievement, several factors were found to be significant, which have
informed this study. The factors that were discovered to be significant predictors of
undergraduate achievement are achievement goals, where performance goals resulted in
an increase in course grades (Harackiewicz et al., 2002; Turner & Lindsay, 2003) and a
realistic and positive self-concept (Adebayo, 2008; Nasim et al., 2005; Ting, 2009). As a
result, the factors that were selected for examination in this study, based on the reviewed
research in the undergraduate setting, are achievement goals, self-efficacy and the
students’ learning environment (which may contribute to students’ objectives and
self-efficacy as their perceived environment may aid or hinder their achievement).
Similar to the previous section on general undergraduate achievement, the most
recent and relevant literature on undergraduate statistics achievement (Bond, Perkins, &
Ramirez, 2012; Budé et al., 2007; Chiesi & Primi, 2010; Evans, 2007; Vanhoof, Castro
Sotos, Onghena, & Verschaffel, 2006) were examined to determine the effects of
cognitive and/or non-cognitive factors on student achievement in statistics. In these
studies, the researchers employed the use of quantitative or mixed methods techniques to
For the mixed methods study of Bond, Perkins, and Ramirez (2012), the
quantitative results showed the relationship between students’ perceptions of statistics
and attitudes toward statistics. The results indicated that there was no significant
difference in mean pre- or post-attitude scores across conceptualization and content
knowledge categories. The qualitative data indicated that students had basic knowledge
of what the word statistics meant, but with varying levels of understanding and
conceptualization of statistics.
These cognitive and non-cognitive studies in the undergraduate statistics setting
have informed this study by highlighting the factors that were significant for
examination. The factors that were discovered to be significant predictors of
undergraduate statistics achievement are mathematical content knowledge (Chiesi &
Primi, 2010) and attitudes (Chiesi & Primi, 2010 & Vanhoof et al., 2006). Bond, Perkins,
and Ramirez (2012) and Evans (2007) reported no significant change in attitudes when
comparing the pre and post- test measures. Nevertheless, Evans (2007) highlighted that
there was a statistically significant difference in attitudes of students across departments
(mathematics, psychology, and sociology). As a result, the factors that were selected for
examination in the current study, based on the reviewed research in the undergraduate
statistics setting, are statistical knowledge and reasoning ability and attitudes.
Strengths and Weaknesses of Methodologies as cited by the Literature
The methodology selected for any study is directly related to the research
questions that have been developed. The methodologies employed in the literature to
examine cognitive and non-cognitive factors and their association with achievement are
sought answers to quantitative research questions. As a result, their focus was on
statistical analysis. On the other hand, the research undertaken by Bond, Perkins, and
Ramirez (2012) employed the use of mixed methods research. Essentially, this is a
combination of both quantitative and qualitative research procedures and so the
researchers had to be fully embedded in both areas of research.
According to Velez (2008), the strengths of quantitative research are that
replication is made possible due to the processes, regulations, and guiding principles of
quantitative research. The theories that are constructed about how and why things occur
are tested and validated and the process of collecting data is fairly quick. The data
collected is exact and numerical and when drawn from large random samples,
generalizations can be made (Tashakkori & Teddlie, 2003).
Velez (2008) also highlighted the strengths of mixed methods studies, which
provide a workable solution to the debate between qualitative and quantitative designs.
The strengths of one method can be used to overcome the weaknesses of another by
including both in a research design (Tashakkori & Teddlie, 2003). Mixed methods studies
allow the researcher to further explore the data as this method possesses objective and
subjective characteristics. Mixed method designs also provide flexibility in the methods
used to investigate various topics and it allows the researcher to narrow or expand the
focus as needed. Because there are no constraints due to a specific research paradigm,
mixed methods research can examine a variety of research questions. Words can be
usefully applied to add meaning to the numerical data and numbers can be used to
through a substantiation of the research findings and presents more comprehensive
information necessary to inform theory and practice (Tashakkori & Teddlie, 2003).
The weaknesses of quantitative methodologies are that the statistical
characteristics of a quantitative report can be technical and difficult to understand for
average users of the reports. Quantitative investigations do not present any descriptive or
narrative explanations of the data, which is sometimes necessary to understand the
context in which the data was analyzed and interpreted. Quantitative inquiry claims to be
free from researcher bias but it is argued that this is not possible because researchers are
human beings and cannot always be neutral in any circumstance. Quantitative inquiry
emphasizes statistical significance (which may be a small representation of what is
actually taking place) without regard for the significance of the effects involved
(Tashakkori & Teddlie, 2003; Velez, 2008).
In terms of mixed method designs, Velez (2008) indicated the weaknesses to be
that mixed methods research can be challenging for a researcher to conduct because he or
she has to be familiar with both quantitative and qualitative research designs and must
know how to appropriately combine the two. It may also be more difficult for a single
researcher to conduct a mixed research if two or more approaches are utilized
concurrently. Mixed methods research is time-consuming and can be quite costly. It also
requires flexibility from the researcher to adapt to the needs of the problem being studied.
Mixed methods research may constrain the researcher in terms of choosing an appropriate
method (or combination of methods) to approach a research project even though there is
some level of flexibility in choosing methods that fit research questions (Tashakkori &
As a result of an examination of the strengths and weaknesses of methodologies
used to study cognitive and non-cognitive factors, I have employed the use of a
quantitative research study with a minor focus on qualitative research methods.
Focus: Gaps in the Literature
Through an examination of the literature (see Appendix A), it can be seen that
most studies on cognitive and non-cognitive factors take on a quantitative approach. The
omissions in the existing literature on cognitive and non-cognitive factors related to
undergraduate statistics achievement were identified and provided the basis for the
current study. Several research studies (Bond, Perkins, & Ramirez, 2012; Budé et al.,
2007; Chiesi & Primi, 2010; Evans, 2007 & Vanhoof et al., 2006) focused on assessing
students as they are, and in some instances, using pre and post- test measures. However,
the studies that were examined did not attempt to enhance and support student learning
by introducing an intervention (which would facilitate the evaluation of achievement for
comparison and experimental groups in addition to pre and post results for both groups).
Most of the studies examined (Bond, Perkins, & Ramirez, 2012; Chiesi & Primi, 2010;
Evans, 2007 & Vanhoof et al., 2006) also did not utilize any guiding theoretical or
conceptual frameworks which would have provided a focus and foundation for their
research. The studies (Bond, Perkins, & Ramirez, 2012; Budé et al., 2007; Chiesi &
Primi, 2010; Evans, 2007 & Vanhoof et al., 2006) were also general in nature and didn’t
focus on a specific aspect of the statistics course.
By focusing on visual statistics, an area that all academic majors will encounter in
their chosen professions, this study is set apart from the aforementioned studies due to the
ViSta, which has not been used in studies related to cognitive and non-cognitive
predictors of undergraduate achievement.
Summary of the Literature
In summary, the studies on the use of ViSta are limited in number and consist
primarily of outlining methods of applying the software to analyze data. Additionally,
major studies have been identified which have contributed significantly to the literature
on cognitive and non-cognitive factors as predictors of undergraduate student learning.
These studies have employed different methodologies, but despite their significant
contribution to the knowledge base of the subject, they all have their strengths and
weaknesses. The studies did not attempt to enhance and support student learning by
utilizing an intervention and subsequent comparative analysis of achievement for the
comparison and experimental groups. There was also a notable absence of a guiding
theoretical framework in most of the studies and in addition, they were general in nature
and did not focus on any specific aspect of the statistics course. This study has explored
and addressed these gaps that have been identified in the existing literature in an attempt
to gain a better understanding of student learning and performance, and to make a
significant contribution to the existing body of knowledge on cognitive and non-cognitive
CHAPTER 3
METHODOLOGY
In this section, I will first discuss (a) the research design of the study which
highlights the methodology and procedures I used to conduct my research. I will then
examine: (b) the participants, (c) the data collection process, (d) the procedure that was
employed, (e) the intervention, and (f) the data analysis methods. These sections provided
a blueprint for my research. I will continue by highlighting (g) the limitations of the study
design, (h) the research permission obtained and ethical considerations, (i) the role of the
researcher, and (j) a brief summary of the methodology that was utilized.
The purpose of this study was to examine the effects of using a visual statistics
software program (ViSta) on undergraduate students’ statistics achievement and
cognitive and non-cognitive factors. The research questions were developed as follows:
RQ1 - What are the effects of the interactive visual statistics software, ViSta, on
undergraduate students’ achievement in elementary statistics?
RQ2 - What are the effects of the interactive visual statistics software, ViSta, on
cognitive and non- cognitive factors between the experimental and comparison
groups in elementary statistics?
RQ3 - What are the associations between cognitive and non-cognitive factors and
undergraduate statistics achievement in elementary statistics?
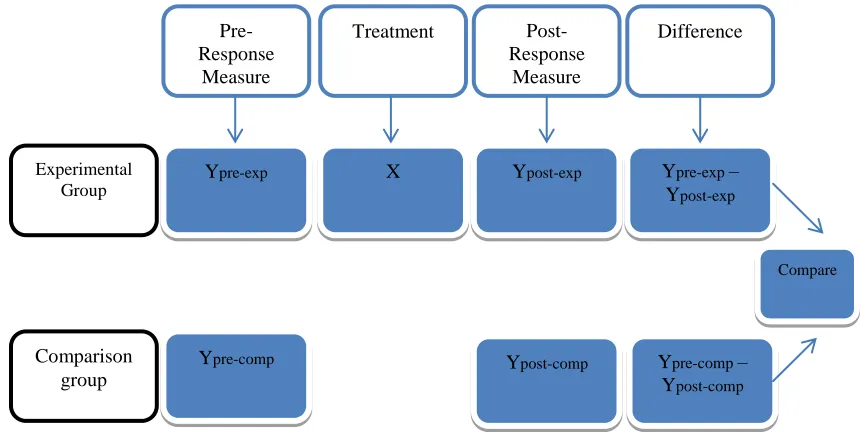
Research Design
This study employed an experimental design. Using an experimental design, the
comparison group design with pre-test and post-test measures (see Figure 6 – adapted and
applied because the study involved the comparison of multiple groups which were similar
in characteristics. In this type of design, both the experimental and comparison groups are
assessed on a pre-test measure, the treatment is then administered to the experimental
group, and finally both groups are assessed on a post-test measure. Credibility is typically
enhanced by adding the pre-test measure (Schweigert, 1998). In this study, the pre-test
measures were used to assess the equivalency of the comparison and experimental groups
and the post-test measures were used to assess the relative effect of the intervention
(Schweigert, 1998). The comparison group with pre-post-test design is therefore a useful
design to determine if a specified intervention produces any additional effects other than
those attributed to the passage of time or the experience of being assessed (Thyer, 2012).
The most obvious way of detecting and accounting for the effects of selection differences
is to make use of pre-test measures that are identical to the post-test measures (Reichardt,
[image:45.612.101.534.432.650.2]2009).
Figure 6. Design of non-equivalent group study.
Pre-Response Measure
Ypost-exp
Difference Treatment
Ypre-exp X
Post-Response
Measure
Experimental Group
Ypre-comp –
Ypost-comp
Ypost-comp
Ypre-exp –
Ypost-exp
Ypre-comp
Comparison group
The dependent variable or outcome is the students’ achievement in the course as
reflected in their final overall grade. The independent variables, that is, those variables
that could influence achievement (the dependent variable) include cognitive ability
(reasoning and problem-solving skills), attitude, statistics self-efficacy, and student
perception of the learning environment. In this study, the intervention (use of ViSta) was
assigned exclusively to the experimental group. According to Reichardt (2009) “[a]
theory is put to the test by deriving its empirical implications and seeing if they hold
true….a theory’s most telling implications entail predictions about the effects of
treatments or interventions” (p. 46).
Sample Selection
The sample was selected through the use of a multi-level random sampling
procedure and random assignment. At the first level, the population was divided into
already existing class sections. There were 30 sections of the course offered during the
semester. At this institution, the instructors are randomly assigned to classes (by the
coordinator of the course) and are assigned before students register to preserve
comparability. With the classes and instructors assigned, the four instructors who taught
six sections of the course were identified and one instructor was randomly selected for
the study. Three of the sections taught by this instructor were then randomly assigned to
the experimental group and the other three were randomly assigned to the comparison
group. Since the groups (or class sections) were already created prior to the research,
every possible precaution was made to ensure that the characteristics of both groups were
as similar as possible. Students shared characteristics in that they must satisfy the same
Additionally, using six classes taught by the same instructor reduces or eliminates
instructor bias in the results that occur.
Participants
In this study, 273 undergraduate students, enrolled in a statistics course at an
urban university in the southeast, and consisting of a diverse population, were invited to
participate in the study. The participants in this research study are college students who
were enrolled in Elementary Statistics, a 3-credit course offered every semester. The
course is required for undergraduate students majoring in Accounting, Business
Economics, Finance, Computer Information Systems, Geography, Hospitality
Administration, Marketing, Nursing, Public Policy, Real Estate, Respiratory Therapy and
Social Work. A typical enrollment in a section of Elementary Statistics is a maximum of
47 students. In this course, students examine descriptive statistics, basic probability and
distribution of random variables, estimation and hypothesis tests for means and
proportions, regression and correlation, analysis of count data, and prepare a Microsoft
Excel project. Participants were at least 18 years old and were not excluded on the basis
of any characteristics (for example gender or ethnicity). Students participated in the study
during the course of a semester where the duration of each class was 50 minutes, with 3
hours of lab time required per week. Demographic information such as gender, ethnicity,
parents’ education and major were also collected (see Table 1).
The instructor is a graduate student of statistics who teaches 6 sections of the
elementary statistics course each semester while taking classes and conducting research.
Since the classes only meet for 50 minutes, the instructor holds office hours each week
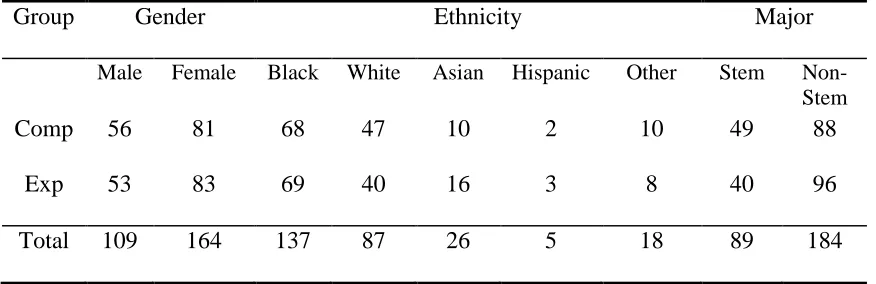
Demographic Data
Table 1
Demographic Data
Group Gender Ethnicity Major
Male Female Black White Asian Hispanic Other Stem Non-Stem
Comp 56 81 68 47 10 2 10 49 88
Exp 53 83 69 40 16 3 8 40 96
Total 109 164 137 87 26 5 18 89 184
Note. N = 273; Comp = comparison; Exp = experimental
Table 1 shows the demographic data of the sample in this study. Approximately
40% of the participants were male and 60% were female. The most common ethnicity
was “Black” as 50% of the participants identified themselves, with 32% “White” and
18% a combination of “Asian,” “Hispanic,” and “Other” (which is identified to be a
mixture of ethnicities). Thirty-three percent (33%) of the participants identified STEM
fields as their majors, which include, for example, Computer Science, Biological Science,
and Chemistry, while the majority of the participants, 67%, are enrolled in non-STEM
majors, including Sociology, Journalism, Art, Political Science, and Education.
Additionally, the majority of participants indicated that they were full-time students
(47%), Sophomores (26%), and their parents’ received a college education (31%).
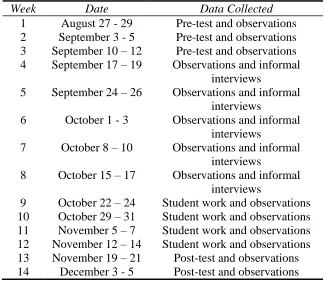
Data Collection
Data collection was facilitated over the course of the semester (14 weeks) and
consisted of several phases. First, there was the collection of the pre-test responses which