Hydrol. Earth Syst. Sci., 17, 3397–3419, 2013 www.hydrol-earth-syst-sci.net/17/3397/2013/ doi:10.5194/hess-17-3397-2013
© Author(s) 2013. CC Attribution 3.0 License.
EGU Journal Logos (RGB)
Advances in
Geosciences
Open Access
Natural Hazards
and Earth System
Sciences
Open AccessAnnales
Geophysicae
Open AccessNonlinear Processes
in Geophysics
Open AccessAtmospheric
Chemistry
and Physics
Open AccessAtmospheric
Chemistry
and Physics
Open Access DiscussionsAtmospheric
Measurement
Techniques
Open AccessAtmospheric
Measurement
Techniques
Open Access DiscussionsBiogeosciences
Open Access Open Access
Biogeosciences
DiscussionsClimate
of the Past
Open Access Open Access
Climate
of the Past
Discussions
Earth System
Dynamics
Open Access Open Access
Earth System
Dynamics
DiscussionsGeoscientific
Instrumentation
Methods and
Data Systems
Open Access
Geoscientific
Instrumentation
Methods and
Data Systems
Open Access DiscussionsGeoscientific
Model Development
Open Access Open Access
Geoscientific
Model Development
DiscussionsHydrology and
Earth System
Sciences
Open AccessHydrology and
Earth System
Sciences
Open Access DiscussionsOcean Science
Open Access Open Access
Ocean Science
DiscussionsSolid Earth
Open Access Open Access
Solid Earth
DiscussionsThe Cryosphere
Open Access Open Access
The Cryosphere
DiscussionsNatural Hazards
and Earth System
Sciences
Open Access
Discussions
Bayesian networks modelling in support to cross-cutting analysis of
water supply and sanitation in developing countries
C. Dondeynaz1,2, J. L´opez Puga3, and C. Carmona Moreno1
1Institute for Environment and Sustainability, Joint Research Centre, Ispra, Italy 2School of Engineering, Liverpool University, Liverpool, UK
3Departamento de Psicolog´ıa, Facultad de Ciencias de la Salud, Universidad Cat´olica San Antonio de Murcia, Murcia, Spain Correspondence to: C. Dondeynaz ([email protected])
Received: 1 February 2013 – Published in Hydrol. Earth Syst. Sci. Discuss.: 28 February 2013 Revised: 5 July 2013 – Accepted: 17 July 2013 – Published: 5 September 2013
Abstract. Despite the efforts made towards the Millennium Development Goals targets during the last decade, improved access to water supply or basic sanitation still remains un-available for millions of people across the world. This paper proposes a set of models that use 25 key variables and coun-try profiles from the WatSan4Dev data set involving water supply and sanitation (Dondeynaz et al., 2012). This paper suggests the use of Bayesian network modelling methods be-cause they are more easily adapted to deal with non-normal distributions, and integrate a qualitative approach for data analysis. They also offer the advantage of integrating pre-liminary knowledge into the probabilistic models. The sta-tistical performance of the proposed models ranges between 20 and 5 % error rates, which are very satisfactory taking into account the strong heterogeneity of variables. Proba-bilistic scenarios run from the models allow an assessment of the relationships between human development, external support, governance aspects, economic activities and water supply and sanitation (WSS) access.
According to models proposed in this paper, gaining a strong poverty reduction will require the WSS access to reach 75–76 % through: (1) the management of ongoing urbanisa-tion processes to avoid slums development; and (2) the im-provement of health care, for instance for children.
Improving governance, such as institutional efficiency, ca-pacities to make and apply rules, or control of corruption is positively associated with WSS sustainable development. The first condition for an increment of the HDP (human de-velopment and poverty) remains of course an improvement of the economic conditions with higher household incomes.
Moreover, a significant country commitment to the envi-ronment, associated with civil society freedom of expression
constitutes a favourable setting for sustainable WSS services delivery. Intensive agriculture using irrigation practises also appears as a mean for sustainable WSS thanks to multi-uses and complementarities. With a WSS sector organised at na-tional level, irrigation practices can support the structuring and efficiency of the agriculture sector. It may then induce rural development in areas where WSS access often is set back compared to urban areas1. External financial support, called Official Development Assistance (ODA CI), plays a role in WSS improvement but comes last in the sensitivity analyses of models.
An overall 47 % of the Official Development Assistance goes first to poor countries, and is associated to governance aspects: (1) political stability and (2) country commitment to the environment and civil society degree of freedom. These governance aspects constitute a good framework for aid im-plementation in recipient countries.
Modelling is run with the five groups of countries as de-fined in Dondeynaz et al. (2012). Models for profile 4 (es-sential external support) and profile 5 (primary material con-sumption) are specifically detailed and analysed in this paper. For countries in profile 4, fighting against water scarcity and progressing desertification should be the priority. However, for countries in profile 5, efforts should first concentrate on consolidation of political stability while supporting diversifi-cation of the economic activities. Nevertheless, for both pro-files, reduction of poverty should remain the first priority as previously indicated.
1JMP statistics, 2004 http://www.wssinfo.org/data-estimates/
1 Introduction
On 6 March 20122, the UN announced that the millennium target for safe access to drinking water was reached, while sanitation target was still out of reach. Only 63 % of the World has improved sanitation access, and this figure is pro-jected to increase only to 67 % by 2015, far from the 75 % requested by the Millennium Development Goals (MDGs). At the same time, the UN estimates that by 2015, 92 % of the global population will have improved access to drinking water. Behind these global figures, disparities remain across regions and urban/rural areas: “Only 61 % of the people in sub-Saharan Africa have access to improved water supply sources compared with 90 % or more in Latin America and the Caribbean, Northern Africa, and large parts of Asia” (WHO, 2012). Access to basic sanitation still represents a challenge for the coming years with “1.1 billion people who still practice open defecation. The vast majority (949 million) lives in rural areas. This affects even regions with high levels of improved water access” (WHO, 2012).
Upstream to these targets towards water supply and san-itation (WSS), an integrated water resources management (IWRM) approach was adopted by the international commu-nity in 1992 at Dublin’s conference. This considers the whole water cycle, from water withdrawal to restitution to the envi-ronment, including sanitation, the involvement of users and the preservation of the natural resources. IWRM promotes an inclusive water resources management. This approach has shifted efforts from infrastructure development and opera-tional maintenance to a wider management including, for ex-ample, all users depending on the same water source. San-itation, often neglected, is to be handled jointly with water supply because of its negative impacts on water quality at the end of the cycle.
The IWRM echoes the complexity of the water sector. Therefore, tools are needed to better understand and make mechanisms clearer, in particular to support decision mak-ing. In line with these international concerns and approach, this work aims at analysing and modelling variables involved in the access to WSS at country level. A better understanding of which and how variables impact WSS will help to ori-ent efforts and set priorities for intervori-ention. To do so, the analyses performed previously on the WatSan4Dev database (Dondeynaz et al., 2012) are used as a basis for the modelling phase proposed in this paper. WatSan4Dev was developed by the Joint Research Centre (JRC) of the European Commis-sion (EC) and contains 42 indicators (called variables) repre-senting environmental, socio-economic, governance and fi-nancial aid flows data in developing countries. As explained in Dondeynaz et al. (2012), a subset of 25 variables is used for analysing WSS behaviour because of the correlations observed through multivariate analyses of the WatSan4Dev
2http://www.who.int/mediacentre/news/releases/2012/
drinking water 20120306/en/, last access: 22 July 2013.
database. The description of the data and multivariate analy-ses performed both on variables and observations (countries) are detailed in Dondeynaz et al. (2012). In line with this pre-vious analytical work, this paper proposes various probabilis-tic models based on Bayesian network methods. Scenarios are tested to describe relationships and map processes behind WSS behaviours and country development. Five country pro-files are modelled, and scenarios run.
In Sect. 2, this WatSan4Dev subset is briefly described. The modelling methods, namely Bayesian networks are de-scribed in Sect. 3. The description of models and simulations are presented in Sect. 4.
2 The data: WatSan4Dev database
The WatSan4Dev database is used for this modelling phase. The data set consists of indicators characterising socio-economic and environmental status at national scale. Fur-ther details and description of WatSan4Dev variables, ap-plied data pre-processing and coherency verification are fully described in Dondeynaz et al. (2012). The next two sections (Sects. 2.1 and 2.2) briefly summarise the variables and the methodologies used to build the WatSan4Dev database and the 25 variables subset used in this work.
2.1 The variables
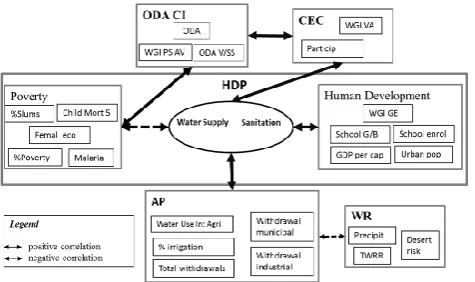
The WatSan4Dev indicators are collected from international providers like the World Bank, FAO, universities such as Harvard, Colombia and Yale or recognise non-governmental organisations such as Transparency International. The na-tional scale is chosen, as most of the data are mainly sup-plied at this level. The data set for 2004 is used in this work because this was the last release of the Joint Monitoring Pro-gramme (JMP) report on WSS access levels at the beginning of this research. Building on the several country profiles de-fined during the analytical phase of the WatSan4Dev subset, 25 variables are thematically clustered under five thematic areas: water resources (WR), human activity pressure on wa-ter resources (AP), country environmental concern (CEC), human development and poverty (HDP) and Official Devel-opment Assistance (ODA CI). The reduction of the number of variables to 25 results from preliminary multivariate anal-yses: collinearity between variables or no significant correla-tions with any other variables constitute the exclusion criteria from the variable subset. Figure 1 outlines the organisation and main correlations between selected variables.
Fig. 1. Organisation and main correlations between selected vari-ables.
consequences of the variations of simple variables related to WSS, which are the objective of this paper.
Throughout this paper, Worldwide Governance Indicators of governance effectiveness (WGI GE), which also repre-sents control of corruption (WGI CofC), rule of law (WGI RofL), regulatory quality (WGI RQ), and environmental governance (Env gov), are called advanced governance. The last two governance indicators (WGI PS AV; WGI VA) are called basic governance because they ensure political sta-bility; moreover, accountability towards citizens appears as an important basis for the development of other measures of governance.
The observations include 101 developing countries (our target group), therefore developed countries but also small states and islands are excluded.
2.2 Data pre-processing and coherency
Missing data are processed using multivariate imputa-tion3 and normalised using standard normalization meth-ods, namely square roots, logarithm and linear regression (Dondeynaz et al., 2012). The WatSan4Dev data set should be considered for qualitative analysis and not for quantitative interpretation purposes because of the strong heterogeneity of the sources and the data collection methods used by the official data providers.
Dondeynaz et al. (2012) uses the principal component analysis (PCA) and factor analysis (FA) for analysing rela-tionships among and clustering of variables (Fig. 1). In this paper, the Bayesian models are built based on these previous multivariate analyses and conclusions.
3Software used: Amelia II by Honaker, King and Blackwell
(Honaker et al., 2011).
3 Methodology
3.1 Description of Bayesian networks
Bayesian networks are statistical tools that originated in the field of artificial intelligence as models to manage uncer-tainty. A Bayesian network (also known as belief network, causal network, influence diagram or probabilistic expert system) is a statistical graphical model pertaining to highly structured stochastic systems (Cowell et al., 1999) conceived to represent probabilistic conditional relationships between variables. Following Aguilera et al. (2011), a Bayesian net-work could be formally specified through two different di-mensions. Firstly, a Bayesian network is a graphical repre-sentation of a problem containing a set of related variables and, on the other hand, the network is defined by a set of probability distributions. The following section technically defines each of these dimensions and highlights the advan-tages of using such methods.
3.1.1 Graphical representation
A Bayesian network is a graph which represents a problem. In this context of modelling, the graph, called a directed acyclic graph (DAG), is defined a as a pairG=(V , E)where V refers to a finite set of vertexes, nodes or variables andE is a subset of ordered pairs in the Cartesian product (V×V) called links or edges.
The term directed refers to a directionality concept, im-plying that the edges or links between variables are directed. For instance, if (A, B)∈Ebut (B, A) /∈E, that means there is a directed link betweenAandB and it is represented as A→B.
The term acyclic refers to the fact that loops are forbidden in the network. A directed connection between two variables in a Bayesian network is interpreted as statistical or relevant dependency. Referring to the example above, it is said that Bdepends onA. Talking in causal terms,AcausesBor, the other way around,Bis the effect ofA.
The principle of conditional independence is the con-cept which is used to spread evidence within the model. Let us consider three variables or a set of variables, x, y and z;x and y are (conditionally) independent given z if p(x|z)=p(x|yz). In other words, two variablesx,yare in-dependent given a third variablezif and only ifp(xy|z)= p(x|z)×p(y|z). This principle is important because it makes probability updates possible in the three basic types of sub-structures (converging, diverging and serial) of a Bayesian network.
3.1.2 Qualitative dimension
1. The Bayesian networks are based on a vision con-sidering probability as a subjective issue (so-called bayesian) (Cox, 1946; Cowell et al., 1999; Dixon, 1964; Heckerman, 1995). It considers that probability is just a degree of belief with regards to the occurrence of events. The probability is understood as a subjective evaluation based on our state of knowledge about nature or reality (Dixon, 1964). The probability is a measure to quantify uncertainty and Bayesian networks use it in subjective terms.
2. A Bayesian network is perimetrically determined by a set of conditional probability functions. Generally, those parameters are specified in a conditional probability ta-ble (CPT). The CPT contains a set of probability val-ues corresponding to all possible combinations of node states and parent node states. These probabilities or pa-rameters are the bases on which the Bayesian theorem is founded.
3. The Bayesian theorem is a useful rule derived from the concept of conditional probability applied to the inter-section of events. Derived from Thomas Bayes’ work (1763), it is a valuable tool when willing to update the knowledge about an event based on evidence related to another linked event. In its simplest form, Bayesian the-orem can be formulated as follows:
p(B|A)=p(A|B)×p(B)
p(A) . (1)
The principle of conditional independence allows factoris-ing probabilistically the whole model, meanfactoris-ing, in practical terms, the assessment of probabilities given the evidence. Given a Bayesian network, the factorisation processes are carried out according to the following Eq. (1):
p(x)=Y vV
p(xv|xpa(v)), (2)
where xv refers to the variables in the model and xpa(v) stands forxv’s parents or ancestors (i.e., Aguilera et al., 2011; Hoeting et al., 1999; Nadkarny and Shenoy, 2001).
3.1.3 Advantages and limits of Bayesian networks
The most important advantage of the use of Bayesian net-work (BN) modelling in environmental science is that they are able to differentiate and efficiently manage the quantita-tive and qualitaquantita-tive dimensions of a problem (i.e., Edwards, 1998; Heckerman, 1995). Bayesian networks can also op-timally manage missing data (Nadkarni and Shenoy, 2004; Jansen et al., 2003) and this is particularly relevant when analysing data from developing countries because of the high proportion of missing data. Additionally, Bayesian networks allow: (1) the combination of prior knowledge with empir-ical data to develop models (Nadkarny and Shenoy, 2004);
and (2) taking into account the interaction effects among variables. It is also possible to carry out local computations to avoid the re-estimation of the whole joint distribution of a model. This makes the inference task a relatively low computing-demanding process (Pearl, 2001; Xiang, 2002). It is also to be noted that non-linear relationships are modelled efficiently (Lee et al., 2005).
However, Aguilera et al. (2011) noted that there are sev-eral drawbacks associated to the use of Bayesian networks in the field of environmental sciences: (1) the building pro-cess might be challenging when the ratio between cases and variables is low; (2) problems to model time series and fuzzy-based models have also been noted.
Concerning the specific application of Bayesian networks (BN) to the water sector, these have extensively been used from ecological applications to their integration in decision support systems at local/river basin level. Bayesian networks are used to model strains from which the water ecosystems suffer, such as climate change (Varis and Kuikka, 1997) and farming/irrigation practices (Batchelor and Cain, 1999; Borsuk et al., 2004; Mart´ın de Santa Olalla et al., 2005), for instance. On another side, Baran and Jantunen (2004), Bromley et al. (2005), Castelletti and Soncini-Sessa (2007b), Zorilla and al. (2009) and Carmona et al. (2011) highlight the use of Bayesian networks as tools to facilitate stake-holders’ participation and planning. BN modelling has been used alone but also combined with other statistical tech-niques to support the management and decision-making pro-cesses at river-basin level. This was the case, for instance, in Castelletti and Soncini-Sessa (2007a), Molina et al. (2010), and Suˇsnik et al. (2012). These works combined BN to model socio-economic components within a hydrological model in a decision-making framework at local level. Gin´e Garriga et al. (2009) uses BN at river basin level to model several di-mensions (physical availability of water resources, extend ac-cess to water supply (WS), people’s ability and capacity for sustaining access, various uses of water resources and envi-ronmental factors that impact water resources) following the framework of the Water Poverty Index (Sullivan et al., 2003). The work proposed in this paper follows this applied multi-dimensional modelling approach and takes advantage of the flexibility of BN methods mainly at the level of miss-ing data management and non-linear behaviour modellmiss-ing. It aims at scaling it up to national level to support regional or worldwide cross-country analysis as JMP monitors WSS at this scale.
3.2 Bayesian networks: processing steps
This section describes the necessary four processing steps to model our subset with the Bayesian networks method:
the problem tractable and to homogenise the data set. The objective is to create three categories or levels (low, medium, high) matching with the qualitative nature of the selected variables. Table A1 indicates the limits of each class for each variable used in this paper. Water supply, sanitation and WGI (Worldwide Governance In-dicators) variables show only two levels (high and low), because of the shape of their distribution: this increases the classification error rate.
2. Building thematic composite indicators: composite in-dicators are built for each thematic pillar namely, HDP, CEC, AP, WR and ODA CI (Fig. 1). The first compo-nent of the PCA, which includes the pillar subvariables, is categorised in three levels, using thekmeans cluster-ing method as it was done for the variables.
3. DAG design: two different modelling strategies are used to develop the general and specific models. Firstly, global or general models are built using the PCA/FA results and using expert knowledge (literature and field experience) to specify link directions. This expert and statistically guided method to develop graphs allows testing different structures in order to assess the good-ness of fit for each of them. The DAGs for specific mod-els are created using the generic structure of the na¨ıve Bayes classifier or simple Bayesian classifier. Those structures are considered appropriate to model relation-ships between the composite indicator (CI) and its sub-variables. This method is used as a non-parametric al-ternative to regression models trying to generate more parsimonious (in terms of the number of parameters to estimate) and usable models from the decision-making point of view.
4. Beliefs computation: the Bayesian theorem is applied and probabilities are computed for each variable and each level (HIGH, MID, LOW) according to the input data set (101 developing countries) or country observa-tions from a specific profile.
Different probabilistic scenarios are then run to describe the interrelations between variables or in the frame of a spe-cific country profile.
4 Modelling WatSan4Dev subset
The data set modelling is done in two mains steps: (1) the in-tegration of thematic composite indicators in a global model; and (2) the creation of a specific model for each pillar. Sep-arated models are built for water supply and sanitation. The global models offer a synthesis of the mechanisms involved in the WSS level and its articulation within a national con-text. The modelling by pillars scales down the analyses.
4.1 General models: structure, statistical validation and scenarios
Statistical validation is carried out4 and measured by the error rate, logarithmic loss (LL), quadratic loss (QL) and spherical payoff (SP) coefficients (Pearl, 1978). The error rate represents the percentage of cases incorrectly classified; the lower the value, the better the predictive validity of the model. The logarithmic loss (LL) ranges between zero and infinity where zero is the best fit. The quadratic loss (QL) ranges between zero and two (zero is the best fit). The spher-ical payoff (SP) varies between zero and one (one is the best fit).
A sensitivity analysis is carried out to evaluate the rela-tive impact of each variable in the model. Entropy reduction (ER) (or mutual information) refers to the expected reduc-tion in the query variable due to a finding in any other vari-able of the model (Pearl, 1991). Its value varies between zero (meaning complete independence between the query and the instantiated variable) and the entropy value of the query with-out any evidence abwith-out the model. The variance of node be-lief (BV) and the root mean square (RMS) change of bebe-lief are also computed (Neapolitan, 1990). Both statistics range from zero to one (the closer the value to zero, the stronger the independence between the query and instantiation variable). The global model is based on composite indicators com-piled from the previously defined pillars of variables: human development and poverty (HDP), water resources (WR), hu-man activity pressure on WR (AP), Official Development Assistance (ODA CI) and country environmental concern (CEC). It is to be noted that WR variables as well as ODA CI are poorly correlated with the WSS variables. Therefore, WR variables are set with an indirect link via the AP pillar, with WS and S (sanitation) as dependent variables (Fig. 2). The reason resides in the existing correlation between the amount of water resources available (TWRR) and water use intensity in agriculture (Water Use Int Agri).
Financial aid flow (ODA CI integrating variables ODA, ODA WSS and WGI PS AV) is included in the models fol-lowing clues given by previous PCA analysis: (i) ODA shows higher positive correlations with poverty variables than with development variables and shows a negative correlation with WS (−0.450) and S (−0.412); (ii) ODA WSS is correlated with the political stability and absence of violence index (WGI PSAV, correlation 0.363). The non-significant corre-lation with WSS may be due to a scale bias; ODA WSS disbursements were 8 % of the total ODA between 2004– 2005 (OECD, 2007); and (iii) WGI PSAV is positively cor-related with other governance variables such as the indicator measuring voice and accountability within a country (WGI VA – correlation 0.524). Therefore, ODA CI is linked with HDP, CEC and WSS (Fig. 2).
4To build and test the models, the Netica Application (Norsys
Fig. 2. WS general model, DAG shows the relationships between the WS and pillars and initial probabilities computed.
After developing the Bayesian networks, several simula-tions are run to measure the probabilistic variasimula-tions of key variables. The interpretation of these results constitutes a hypothesis on the potential underlying mechanisms which are introduced in the following paragraphs. Hypotheses are mainly formulated from the simulation but also according to relevant scientific literature and international field related ex-periences.
4.1.1 Water supply (WS) general model
The general model correctly classifies 86 % of the Wat-San4Dev subset (Table 1a). Figure 2 presents the direct acyclic graph (DAG) of this model.
The sensitivity analysis provides the influence (probability change) of the pillars on the WS variable (Table B1a). The variable influencing the most WS access level is the devel-opment of the country (HDP). Poverty reduction, as a com-ponent of the HDP pillar, is a key result of the increased ac-cess to an improved water supply. WR is excluded from the sensitivity analysis because of its indirect link with WS. Ta-ble 2 presents the initial probabilities (IP) of each variaTa-ble of the model for a specific level. For each simulation, a spe-cific variable is set at 100 % probability for one category. The model then computes the new probability distributions of the other variables according to this change. The results of sim-ulations are reported in Table 3. The positive increments of variables (recomputed probability minus initial probability) are represented in bold and the negative increments in italic. Simulations are ordered according to WS variation (HDP im-plies the highest change, ODA-CI the lowest).
Simulation 1 (HDP set to 100 %) directly regards the es-timation of improvement on WS needed to support poverty reduction efforts. Indeed, in line with the Millennium Devel-opment Goals initiative, countries should halve the poverty worldwide through the improvement of WS access (halv-ing the population without access to improved water supply and basic sanitation – target 7C). Simulation 2 (CEC set to 100 %) estimates the influence of the WS access and WS management on the environmental concern indicator.
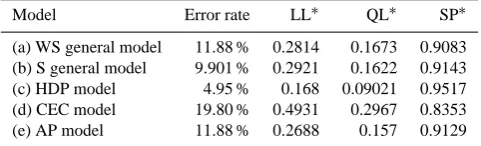
Table 1. Performance and error analysis for WS, S, HDP, CEC and AP models.
Model Error rate LL∗ QL∗ SP∗
(a) WS general model 11.88 % 0.2814 0.1673 0.9083 (b) S general model 9.901 % 0.2921 0.1622 0.9143 (c) HDP model 4.95 % 0.168 0.09021 0.9517 (d) CEC model 19.80 % 0.4931 0.2967 0.8353 (e) AP model 11.88 % 0.2688 0.157 0.9129
∗LL = logarithmic loss, and QL = quadratic loss where best value is 0, SP = spherical payoff where best value is 1.
Simulation 3 examines the type and level of pressure of human activity (water demand according to sectors) on re-sources in the light of WSS development. Simulation 4 (ODA CI set to 100 %) observes Official Development Assistance flow (ODA CI) to measure the impact of such financial mo-bilization.
Simulation WS1 (HDP set to 100 %): pushing poverty reduction to foster development
In this simulation, increasing HDP calls for major efforts on poverty reduction. In that case, high access to WS needs to reach almost 85 %, thus a very important improvement of WS access when compared to IP. Various mechanisms can be suggested to explain it:
– Safe access to a source of drinking water close to cus-tomers is a primary basic service that enables health, social and ultimately economic development of a coun-try. Indeed, the impact on health is well known (i.e. on waterborne disease, or child mortality), but its posi-tive impact goes far beyond by participating in the cre-ation of favourable context for economic development (Sect. 4.2.1).
– Governments engage in WSS programs as an impor-tant component of their poverty reduction strategy (to increase their HDP). Associated to the state efforts, the international donors finance programs fighting against poverty, and mobilise resources to WSS services. In 2004, DAC donors committed to 4.4 billion USD (bi-lateral and multi(bi-lateral ODA) and disbursed around 2.4 billion USD in Official Development Assistance for WSS improvement (OECD-DAC, 2007).
The current model estimates the contribution of WS to HDP but the relationships between HDP and WS can be multiple. Indirectly, in a context of economic development, households tend to dedicate financial resources to improve their WS ac-cess when this is possible.
[image:6.595.309.550.92.165.2]Table 2. General model – water supply simulations. In bold, positive variations of probabilities.
Initial Simulation 1 Simulation 2 Simulation 3 Simulation 4
Variables Levels Probabilities HDP CEC AP ODA CI
HDP HIGH 21.8 % 100 6.9 5.5 0.7
ODA CI LOW 29.8 % 1 2.1 2.3 100
CEC HIGH 31.0 % 10.5 100 5.1 3.1
AP HIGH 34.4 % 8.8 5.4 100 2.6
WR HIGH 29.8 % (=) (=) (=) (=)
WS HIGH 48.6 % 84.5 % 70.3 % 66.3 % 59.4 %
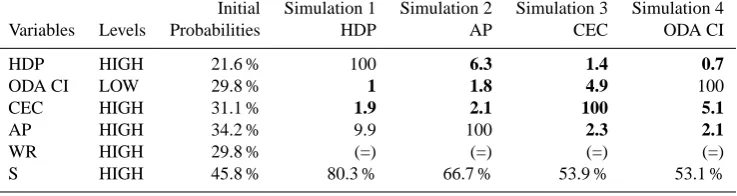
Table 3. General model – sanitation simulations. In bold, the positive variations of probabilities.
Initial Simulation 1 Simulation 2 Simulation 3 Simulation 4
Variables Levels Probabilities HDP AP CEC ODA CI
HDP HIGH 21.6 % 100 6.3 1.4 0.7
ODA CI LOW 29.8 % 1 1.8 4.9 100
CEC HIGH 31.1 % 1.9 2.1 100 5.1
AP HIGH 34.2 % 9.9 100 2.3 2.1
WR HIGH 29.8 % (=) (=) (=) (=)
S HIGH 45.8 % 80.3 % 66.7 % 53.9 % 53.1 %
impacts are a priori undermined. The indicator of inequality could not be integrated into these models. Indeed, the Gini index that measures the inequality of income at country level showed too many missing values when considering devel-oping countries. The advanced governance included in HDP (control of corruption, government efficiency, policy mak-ing capacities) is definitely favourable to WSS sustainabil-ity: “The strength and quality of government institutions and a strong policy environment are just as important to achiev-ing success in the environment sector as they are to other sectors” (Burtaine and Parks, 2012).
Simulation WS2 (CEC set to 100 %): WS management fostering environmental concern and civil society role
In this simulation, the increment of environmental concern (CEC) implies an increment of WS up to 70.3 %. CEC ex-presses the country commitment towards major environmen-tal issues (Particip). The degree of civil society freedom of expression and the level of accountability of government (WGI VA) are also included. The bigger the increment of CEC, the more the country is committed towards its environ-ment and citizens. According to the model, the improveenviron-ment of safe water facilities reinforces the commitment associated with a strong civil society. A management of the water ser-vices made in a participatory way, with for instance water user associations and/or consultation processes5, directly re-inforces CEC. Indeed, water services management opens room for discussion and participation of citizens, at least at
5Principle no. 2 of IWRM, formalised in DUBLIN Statement
1992: http://www.wmo.int/pages/prog/hwrp/documents/english/ icwedece.html#principles (last access: 28 August 2013).
local scale. The water sector can be a starting point, call-ing citizens to organise themselves to participate in decision-making and management processes beyond its warning role, i.e. pollution or WSS services interruption (Sect. 4.2.2).
Simulation WS3 (AP set to 100 %): WS related to the development of human activities
According to the model, the increment of activity pressure on WR (AP) entailed an increment of WS access up to 66 %. AP composite index should be interpreted as follow: the big-ger the increment of the AP factor, the more the agriculture monopolises available water resources, often through irriga-tion practices. It is important to remember that the AP be-haviour is related to countries where agriculture often rep-resents an important economic activity. The municipal water supply network (called by FAO municipal demand) is still used to draw a small part the water in the areas considered. Agriculture is the main consumer of drawn water resources (consuming above 50 % of water resources) in 80 % of the se-lected countries. Low values indicate that a significant part, still not a main part, of water consumption goes for industrial activities, including raw material extraction (implying a spe-cific water supply) and/or domestic/municipal uses (served by network supply).
[image:7.595.114.483.215.313.2]the population, the priority, but the sector (capacities, market organisation. . . ) can be beneficial to agriculture and in par-ticular irrigation plants. However, irrigation practices (above 20 % of irrigated areas) concerned exclusively South East Asia, Middle East and Egypt. Latin America and Africa are little concerned.
Simulation WS4 (ODA CI set to 100 %): the multiple relations between ODA CI, and HDP, WS CEC
The first group: ODA CI, HDP and WS
In this simulation, high donors’ investments (ODA CI) to support partner countries indicate a low-medium HDP situa-tion (78 % probability) and therefore, there is a 61 % proba-bility that access to WS is poor. This is compliant to the pur-pose of Official Development Assistance: providing financial support to less advanced countries (low HDP).
In 2004, investments in social infrastructures and services (government and civil society support, education, and health issues) represented 37 % of the Official Development As-sistance provided by all DAC donors and the EU (OECD statistics in 20046). Humanitarian, emergency aid is excluded from ODA. The model shows that poor countries (with low HDP) received high Official Development Assistance with almost 45 % of probability. In a general way, the lower the HDP of the country is, the higher the ODA CI is. However, the model estimates that 21 % of the countries that benefit from relatively high ODA CI show high HDP. This may raise questions about the motivations behind ODA delivery. Over the last decades, there has been a rather polemical stemming from donor’s visions and strategies of cooperation (Carbon-nier, 2010). In addition, excessive dependence on external financial support can imply negative effects on the quality of governance like “corruption in government, bureaucratic quality, and the rule of law” (Knack, 1999): all elements in-cluded in the HDP variable. The ways in which external aid is delivered may complement the explanation of the ODA CI, HDP, and WS observed behaviour. For instance, donor frag-mentation combined with the low capacities of a country to fund implementation can favour corruption practices. The second group: ODA CI, WS and CEC
The model estimates that the increment of ODA CI (also including political stability, WGI PS AV indicator) induces an increment of high CEC (also including civil society voice, WGI VA indicator) from 31 to 34.3 %, but with the majority of countries (43.9 %) showing a medium CEC level.
Several hypotheses can be formulated to understand this link:
6OECD: http://stats.oecd.org/qwids/, last access: 15 February
2013.
– Programs/projects supported by external aid include activities for citizen involvement in management of WSS services because the IWRM participatory ap-proach pushes in that direction.
– Minimum political stability (WGI PS AV) and civil so-ciety voice (WGI VA) facilitate financial efficiency of the funds and sustainable infrastructure implementa-tion. In fact, the experience in cooperation has shown that external aid has been conditioned to political stabil-ity, democratisation and more generally to governance (Santiso, 2001). Good context facilitates the mobilisa-tion of funds while poor governance represents a risk. These two hypotheses may coexist depending of the gov-ernance context and donors’ strategy in a specific country. Donors may deliver aid despite risks in some countries be-cause of their long-term or geo-political strategy. Necessity of supporting less advanced countries can also prevail over high aid effectiveness expectations.
4.1.2 Sanitation (S) general model
The S model follows the same structure as WS (Fig. 3). Model performance reaches up to 90 % of correct classifi-cation (Table 1b).
Table 3 includes computed probabilities of the different simulations made as for WS. Simulations are ordered by their level of impact.
As for water supply, sanitation is mainly sensitive to human development and poverty (HDP) (Table B1b). The development of sanitation services participates in the im-provement of living conditions as a key element of the slums’ formalisation, health improvement and education (see Sect. 4.2.1). Commitment towards the environment and good governance is improved in a context of high sanitation ac-cess. Financial external aid (ODA CI) is mainly (44.5 %) de-livered in countries with low HDP and low S. The main dif-ference stands in the relatively higher sensitivity to the hu-man activity pressure variable (AP) and therefore to agricul-ture pressure.
Agriculture and sanitation can develop synergies like, for instance, the reuse of human excreta for soils fertilisation. This opportunity of valorisation of sanitation/wastewater products in agriculture is available both in rural and urban areas. This is easier in rural areas where sanitation products can be collected and transformed into fertiliser at affordable prices with composting toilets7 or by a solar drying pro-cess. Regarding urban areas, wastewater sludge, if treated correctly, can be reused as well for agriculture. However, it is difficult to estimate the extension of such practices because statistics regarding sanitation or wastewater products reuse
7See composting toilet fiche: http://www.sswm.info/
Fig. 3. S general model, DAG shows the relationships between the S and pillars.
in developing countries are seldom available. Raschid-Sally and Jayakody (2008) studied wastewater reuse in agriculture in 53 cities across the world.
4.2 Specific models for thematic pillars
General models provide the core idea about the relationships between the thematic pillars and WSS while specific mod-els refine this analysis. In this section, the analysis of rela-tionships is scaled down and submodels for each pillar are described.
The specific models’ DAGs are set with the composite in-dicator (HDP, CEC or ODA CI) as a parent node to its sub-variables nodes. As a consequence, the variation change on the subvariables is estimated according to the CI behaviour within the global model. This allows measuring the associa-tion between subvariables and the corresponding CI. There-fore, the link between CI and its subvariables is rather a mat-ter of strength of relationship than a conditional link between two variables. An indirect link is created from WSS variables to subvariables with the CI as intermediate variable. As for global models, each following section summarises the sen-sitivity analysis results (described in Table B1), and details several simulations run.
Note that the order of variation can be different between the sensitivity analyses and the simulations tables. The sen-sitivity analyses report the cumulated variation across all cat-egories (high, mid, low). The simulation table reports the probability variations for a specific category.
4.2.1 Human development and poverty model (HDP)
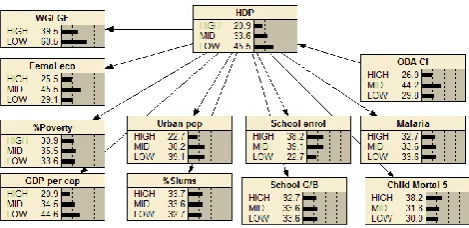
The statistical analyses establish a model with direct links between HDP, the variables in the HDP pillar, and the ODA CI pillar. The suggested model explains the variability up to 95 % (Table 1c). Figure 4 shows the structure of the HDP model and initial probabilities calculated for all variables.
[image:9.595.49.286.62.179.2]The three main variables influencing HDP are the in-come per capita, child mortality under 5 yr (fighting effi-ciently against mortality) and the proportion of slums (push-ing the organisation of urbanisation) (Table B1c). These are
Fig. 4. Probabilities in % for the variables involved in the HDP pil-lar, discretised in high (HIGH), medium (MID) and low (LOW) lev-els.
the variables where authorities and/or donors should focus their efforts to foster development. Two other important as-pects are the support of school enrolment and the control of malaria.
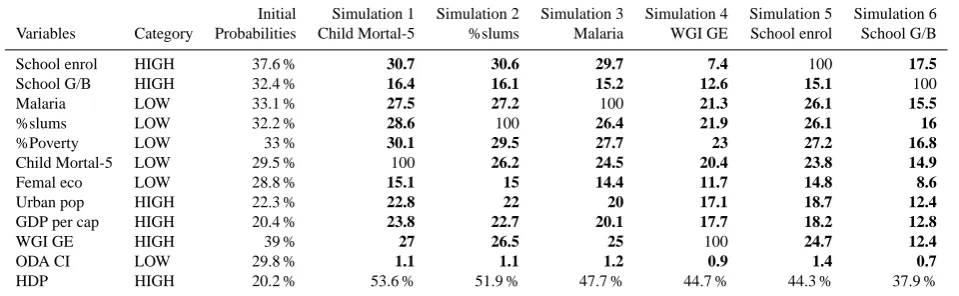
Table 4 sums up the probabilities computed according to several scenarios presented in this paper. Simulation 1 esti-mates the HDP level when significantly reducing child mor-tality under 5 yr. Simulation 2 estimates the improvement of HDP necessary to support the reduction of informal urbanisa-tion (% slums). Simulaurbanisa-tion 3 observes how the improvement in human development is translated in terms of malaria con-trol. Simulation 4 observes the benefits of good development on governance conditions. Simulation 5 examines the associ-ation between human development and educassoci-ation (from pri-mary level to university). Finally, simulation 6 examines the role of gender through girls’ primary education (School G/B) and female economic participation (Femal eco) variables. Simulation HDP1 (Child Mortal-5 % set to 100 %): WSS is essential for reducing child mortality
Table 4. Thematic model-HDP Simulations. In bold, the positive variations of probabilities.
Initial Simulation 1 Simulation 2 Simulation 3 Simulation 4 Simulation 5 Simulation 6 Variables Category Probabilities Child Mortal-5 %slums Malaria WGI GE School enrol School G/B
School enrol HIGH 37.6 % 30.7 30.6 29.7 7.4 100 17.5
School G/B HIGH 32.4 % 16.4 16.1 15.2 12.6 15.1 100
Malaria LOW 33.1 % 27.5 27.2 100 21.3 26.1 15.5
%slums LOW 32.2 % 28.6 100 26.4 21.9 26.1 16
%Poverty LOW 33 % 30.1 29.5 27.7 23 27.2 16.8
Child Mortal-5 LOW 29.5 % 100 26.2 24.5 20.4 23.8 14.9
Femal eco LOW 28.8 % 15.1 15 14.4 11.7 14.8 8.6
Urban pop HIGH 22.3 % 22.8 22 20 17.1 18.7 12.4
GDP per cap HIGH 20.4 % 23.8 22.7 20.1 17.7 18.2 12.8
WGI GE HIGH 39 % 27 26.5 25 100 24.7 12.4
ODA CI LOW 29.8 % 1.1 1.1 1.2 0.9 1.4 0.7
HDP HIGH 20.2 % 53.6 % 51.9 % 47.7 % 44.7 % 44.3 % 37.9 %
Simulation HDP2 (low% slums set to 100 %): the role of urbanisation development
The type of urbanisation plays a central role, as already men-tioned (Dondeynaz et al., 2012). If slums (%slums) are re-duced, that suggests major efforts to control and organise urbanisation processes; in that case, high HDP probability is estimated to rise to 52 %. Organising and implementing services in such suburbs/districts is an obvious priority. The availability of WSS services represents a good leverage for improving living conditions. The consequences of lack of sanitation are even more amplified in terms of health and water contamination because of the density of the popula-tion. The limitation of slums’ extension from high to medium level is translated in the model by the reduction of probabil-ity that countries have a low level of HDP from 91.2 % to 38.3 %. This increment positively impacts on essential vari-ables: school enrolment, household income (GDP per cap), child mortality rate and malaria prevalence.
The level of urbanisation (Urban pop) presents a nega-tive correlation (−0.650) with urban slums (% slums) ac-cordingly to the dynamics of the rural-urban population tran-sition. World urbanisation prospects (UNPD, 2001) analyse urban and rural population growths, providing detailed infor-mation on this transition at regional level. Before the begin-ning of this transition, the majority of the population lived in rural areas with agriculture as the principal activity and child mortality rates were relatively high. For economic and de-mographic reasons, the population started moving from rural areas to urban centres. Therefore, at this time, the urban pop-ulation represents proportionally a small percentage but its growth is significant. The population migrating to cities often resides in informal settlements around urban areas, there-fore incrementing the slums. Progressively, as the proportion of urban population increases, urban development should be more and more organised and as a consequence, slum pro-portion is supposed to be reduced. This process ends up with the majority of the population living in formal urban areas
with an urban population growth mainly due to demographic and economic dynamics. The model proposed in this paper estimates that in 2004 almost 40 % of developing countries present a low urban population rate, while the level of pop-ulation living in slums is high in 34 % of cases. Generally speaking, urbanisation represents an opportunity for develop-ment of WSS services as the concentration of the population provides the necessary critical mass for collective infrastruc-tures and improves cost effectiveness. The organisation and development/rehabilitation planning of urban areas is crucial to limit the extension and the population living in slums. Simulation HDP3 (low Malaria set to 100 %): WSS improvement limits malaria prevalence
The reduction of malaria prevalence (Malaria) means an in-crease of HDP up to 47.7 %. According to the CDC8, the ma-jority of the countries included in the WatSan4Dev database is affected by malaria either on the whole or on part of their territory. Among other socio-economic aspects, WSS ser-vices availability also contributes to reduce malaria preva-lence (HDP as connecting variable). The lack of water supply infrastructure leads to outdoors water storage that facilitates the development of mosquitoes and therefore dissemination of malaria (Lewis, 2011). Limiting inappropriate storage is essential, and avoided in the case of piped water and rainwa-ter harvesting infrastructure.
Malaria prevalence can also be considered as a proxy of good and efficient sanitation. The existence of sanitation fa-cilities reduces the development of mosquitoes by reducing favourable conditions. Improving sanitation, and by exten-sion wastewater collection, reduces stagnant and potentially pathogenic water areas. Indeed, in the case of pipe infras-tructure “when population growth outpaces the existing in-frastructure, wastewater treatment systems are unable to cope with the influx, garbage; sanitation facilities cannot contain
8CDC malaria map: http://cdc-malaria.ncsa.uiuc.edu/, last
the increased refuse, and access to clean, treated drinking water may not be available. All of these conditions con-tribute to create the perfect environment for disease causing mosquitoes to breed” (Lewis, 2011).
Simulation HDP4 (WGI GE set to 100 %): advanced governance and HDP relationships
In the case of simulation of high advanced governance (WGI-GE), HDP increases to 44.5 %, more than doubling the ini-tial probability. In fact, the capability of a nation to organise public services, to be committed towards implementation of suitable policies, and to fight corruption (as represented by the WGI-GE) is associated with good development of the country. This positive association can appear as a chicken-egg situation. Corruption practices in a context of weak in-stitutional authorities are favoured in a poverty background. As the same time, country development is also boosted by good governance.
Applied to the WSS sector, the development and mainte-nance of WSS services can build capacities and create partic-ipatory management rules, at least at local level. Good gov-ernance supports a sustainable WSS delivery (Transparency International, 2008), while the interest and participation of users pushes for better governance.
Simulation HDP 5 and HDP 6: WSS role in education and gender issues (school enrolment, ratio girls to boys at school and female economic activity analysis)
In the HDP 5 simulation, school enrolment (School enrol) is fostered, and HDP is enhanced to reach up to 44.3 % proba-bility. In the HDP 6 simulation, the improvement of the girls’ schooling rate (School G/B) shows a positive correlation with an increment of HDP which reaches up to 37.9 %. A rather good HDP (High HDP with 36.6 % probability) indicates a limited female economic participation (Femal eco) (Boserup, 1989). Beyond the HDP improvement, several hypotheses on the relationships with WSS can be depicted:
– Water availability in households is an important factor in the enrolment, attendance and drop-out rates of chil-dren. When water access is improved in communities, school enrolment rates increased in Tanzania, India and Bangladesh by up to 15 per cent (UNDP and UNICEF, 2006). Back-to-school campaigns in countries in transi-tion are especially dependent on water supplies: “Teach-ers are hesitant to relocate to communities without a re-liable and safe source of water” (UNDP and UNICEF, 2006).
– Girls in the developing world are generally in charge of the daily water fetching, setting time barriers to school attendance. Separate sanitation facilitates school attendance of girls even more, particularly after reach-ing puberty thanks to privacy, and security advantages.
Despite of these advantages, “in some countries in Africa and Asia as few as 10 per cent of schools have ad-equate and separate sanitation facilities, while student-to-latrine ratios can be as high as 150 : 1” (UNDP and UNICEF, 2006).
– In a context of poverty, women are massively active in the economy to sustain their families, which mean, translated in statistics, high female economic activity rate. With the increment of household income, this rate drops to a certain threshold, before rising up in a sec-ond phase because of a completely different dynamic (Boserup, 1989). Women in most developing countries handle both domestic work, including water fetching, and an economic activity: “Providing water sources frees up time for women and leads to both direct and indirect opportunities to engage in activities which pro-vide an income” (UNDP and UNICEF, 2006). There-fore, the level of women’s activity remains more or less the same, but the benefit resides in the qualitative im-provement of women’s daily lives.
4.2.2 Country Environmental Concern model (CEC)
The performance of the CEC model is higher than 80 % (Ta-ble 1d). Figure 5 shows the initial probabilities of varia(Ta-bles in the CEC model following the same methodology as for HDP. The World Governance Voice and Accountability index (WGI VA) only presents two levels (high and low), following the structure of the variable: its range is [−2.5, 2.5], where 0 can be considered as the limit between poor and good gover-nance.
Table B1d provides the CEC sensitivity to subvariables in a decreasing order: participation in international environ-mental agreement (Particip), government accountability and citizen freedom of expression (WGI VA) and finally the ODA CI (including ODA, ODAWSS and WGI PS AV).
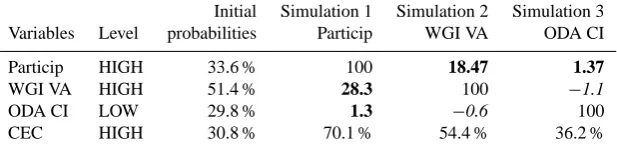
Simulation 1 analyses the country commitment towards in-ternational environmental concerns. Simulation 2 estimates the impact of citizens’ freedom of action and expression on environment issues and, more widely, democratic conditions and government accountability. Simulation 3 considers ODA CI relations with environmental and democratic commitment (Table 5).
Simulation CEC1 (Particip set to 100 %): commitment towards environment includes WSS management
Table 5. Thematic model, CEC simulations. In bold, positive variations and in italic, negative variations of probabilities.
Initial Simulation 1 Simulation 2 Simulation 3 Variables Level probabilities Particip WGI VA ODA CI
Particip HIGH 33.6 % 100 18.47 1.37
WGI VA HIGH 51.4 % 28.3 100 −1.1
ODA CI LOW 29.8 % 1.3 −0.6 100
[image:12.595.144.453.85.160.2]CEC HIGH 30.8 % 70.1 % 54.4 % 36.2 %
Fig. 5. Probabilities in % for the variables involved in the CEC pillar discretised in high (HIGH), medium (MID) and low (LOW) levels.
the Transboundary Movement of Hazardous Waste. This in-dicator may reveal the national commitment toward environ-ment and environenviron-mental services such as water sanitation, energy, and waste. Water and sanitation delivery starts with infrastructure implementation, but rapidly calls to integrated and environmental management to ensure its sustainability.
However, this positive association between international concern and WSS may be different according to the prior-ity and different perception given to WS and S. Safe drink-ing water supply directly supports human survival, hence it is a priority, while sanitation is often perceived as very much secondary. Sanitation is generally neglected by govern-ments/public institutions even when it is a good leverage for the improvement of livelihood and health. With the launch of the “International Year for Sanitation 2008”, the UN tried to push countries to fight the lack of sanitation and to make progress towards the MDGs. In 2012, the sanitation target was still not reached. This mechanism is supported by global models: CEC is more important in the sensitivity analysis for WS than for S (See Table B1a and b).
Simulation CEC2 (WGI-VA set to 100 %): the role of the freedom of expression and accountability to citizens in the country commitment towards environment
The model estimates that an improvement of the degree of civil society freedom (WGI VA) means an increment of CEC from 30.8 to 54.4 %. A country in which citizens are able to express their criticisms and put pressure on their govern-ments according to their interest is key in the construction of an efficient environmental management.
As mentioned in Dondeynaz et al. (2012), the voice of cit-izens both directly or indirectly pushes the government and other economic actors to sustainably manage the environ-ment. The population is primarily concerned by lack of water resources, poor waste management, ecosystems degradation and impact of pollution. Being first in line, civil society plays a major role in control, alerting and pushing for sustainable management of the environment (Barrett and Graddy, 2000) if allowed by the institutional and political context.
Simulation CEC3 (ODA CI set to 100 %): external aid impacts on country environmental concern
The relationship between ODA CI and the CEC is not lin-ear. The main trend is that high external aid flow (ODA CI) mainly indicates a context of medium (45 %) or good (34 %) CEC. The model estimates that high financial external flows are less invested in contexts where environmental concern is poor (only in 21 % of cases). It reveals the attention paid by international donors to intervene in relatively stable politi-cal context, support lopoliti-cal population involvement and more general governance aspects (Sect. 4.1.1-simulation WS4). 4.2.3 Activity pressure on water resources (AP)
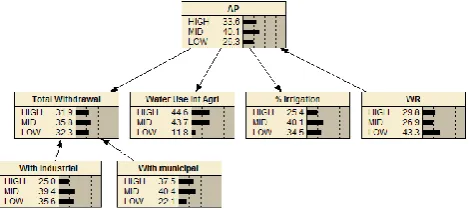
The structure of the AP model is set differently accord-ing to the correlations found out by a principal compo-nent analysis (Dondeynaz et al., 2012). Municipal and in-dustrial withdrawals variables are correlated with total with-drawal (Fig. 6). The model shows a classification perfor-mance higher than 88 % (Table 1e).
The sensitivity analysis is computed for the four directly linked variables: water use intensity in agriculture (Water Use Int Agri), proportion of irrigated areas (% irrigation), the total amount of water withdrawn (total withdrawal) and water resources composite index (WR). In agreement with Dondeynaz et al. (2012), the weight of the water resources (WR) is the lowest in the model and therefore, it counts little in AP (Table B1e).
Fig. 6. DAG and initial probabilities for the variables involved in the AP pillar discretised in high (HIGH), medium (MID) and low (LOW) levels.
of water through their respective withdrawal amounts (total withdrawal, industrial withdrawal, municipal withdrawal). Simulation 3 observes the impact of potential reduction of available WR, under the pressure of climate change, on eco-nomic activity (Table 6).
Simulation AP1 (% irrigation and Water Use Int Agri set to 100 %): WSS sector and the water intensity in
agriculture
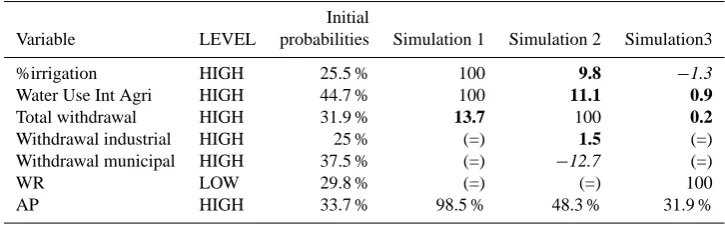
Intensive agriculture practices are represented in this model by the percentage of irrigated areas (% irrigation) and the amount of water provided per hectare (Water Use Int Agri). In the simulation, an increment of intensive agriculture prac-tices means an increment of AP up to 98.5 %.
The positive association between WSS and the intensive agriculture activities can be explained by several hypothe-ses: (1) the amount of water resources mobilised by such practices underlies the existence of facilities, and capacities. An organised sector at national level (providers with appro-priated technical skills, institutional organisations. . . ) can be the common denominator between WSS and Irrigation prac-tices. (2) intensive agriculture practices allow multiple uses of water supply infrastructures developed for both crops and population in rural areas.
Looking at the WatSan4Dev subset, only 23 % of the countries considered present an irrigation rate higher than 10 %, mainly in Southeast Asia, the Middle East and some Maghreb countries. These countries show high WS ac-cess (but not neac-cessarily high S) associated with irriga-tion schemes. These practices even small irrigairriga-tion plants, structure rural areas and thus facilitate organisation of WSS services. For the rest of developing countries, the exclusive use of water resources for agriculture (high AP) can reveal an economy based on rainfall agriculture with low and weather-driven harvests. In this context, the population is poor and lives in rural areas where WSS access is generally low (Low WSS is estimated with around 33 % of probability despite high AP). Dissemination of population over rural areas can reinforce the effect of barriers to WSS delivery.
Simulation AP2 (Total withdrawal set to 100 %): the analysis of the water withdrawals by usage
The AP model estimates that an increase of the total wa-ter withdrawal increments AP up to 48.3 %; the municipal withdrawal variable decreases to 24.6 % and industrial with-drawal goes slightly up, to 26.5 %. This means that the indus-trial variable has a slightly different behaviour than munici-pal withdrawal with respect to Total Withdrawal: a certain industrial water demand can co-exist with dominant agricul-tural pressure.
Indeed, the behaviour of the total amount of withdrawals mainly depends on the agriculture water needs as confirmed by the AP model. Therefore, the relation between municipal and industrial withdrawal (in percentage of the total with-drawal) with the total amount of water withdrawals (amount of water drawn per capita) are negatively correlated (respec-tively−0.553 and−0.251). Looking at WatSan4Dev subset, the majority of developing countries (80 %) dedicate more than 50 % of available water to agricultural purposes with three main profiles: (i) 35 % of the countries dedicate wa-ter almost exclusively to agriculture (above 85 %); (ii) 40 % of the countries dedicate the majority of water resources to agriculture but this proportion is slowly being taken over by household consumption (corresponding to classification at AP medium level); (iii) 25 % of countries present sub-stantial industrial/mining/forestry activities, i.e. higher than 10 %, often combined with high municipal consumption, sig-nificantly reducing the share dedicated to agriculture. This is the case, for instance, of Lesotho with 40 %, or Papua New Guinea with 42 % of water withdrawals dedicated to mining activities. Therefore, the total withdrawals variable is mainly driven by water agriculture demand, which competes with municipal and industrial demands.
Simulation AP3 (WR set to 100 %): the availability of water resources impacts on the activity development
According to the AP model, the reduction of water re-sources due to, for instance, climate change, slightly de-creases the probability of high activity pressure (AP), from 33.6 % to 31.9 % (−5 %). At the same time, the proba-bility of low human activity pressure still decreases from 26 % to 19.1 % (−26.5 %) to aliment also medium AP cate-gory (+20 %). This suggests that countries can find solutions adapted to mitigate the consequences of declining resources. This mechanism may be also confirmed by inputting obser-vation data: arid countries such as the ones in the Middle East show high WSS access thanks to economic activities less conditioned by water resources. Therefore, these countries have funds available to implement infrastructures adapted to water scarcity such as desalination plants.
Table 6. Thematic model-AP simulations. In italic, negative variations and in bold, the positive variations of probabilities.
Initial
Variable LEVEL probabilities Simulation 1 Simulation 2 Simulation3
%irrigation HIGH 25.5 % 100 9.8 −1.3
Water Use Int Agri HIGH 44.7 % 100 11.1 0.9
Total withdrawal HIGH 31.9 % 13.7 100 0.2
Withdrawal industrial HIGH 25 % (=) 1.5 (=)
Withdrawal municipal HIGH 37.5 % (=) −12.7 (=)
WR LOW 29.8 % (=) (=) 100
AP HIGH 33.7 % 98.5 % 48.3 % 31.9 %
policies, investments, agronomic and management skills rather than the amount of water resources. In that sense, the FAO published recommendations encouraging the rein-forcement of policies for planning and infrastructure devel-opment, including social aspects and capacity building for staff and farmers (FAO, 1987). As a concrete case, Kweku Baah Inkoo and Zomanaa Nangu (2011), analysed the rea-sons of under-utilisation of irrigation infrastructures in the upper west region of Ghana. They highlighted the impor-tance of non-environmental factors such as lack of owner-ship, management and skills. The development of irrigation and the intensive use of water resources are the results of rather complex processes and factors, even if water scarcity or desertification may be a starting point for such intensive practice in agriculture.
Summarising the analyses of the AP model, the WSS sec-tor supports agriculture, particularly in the case of intensive practices. In that case, agriculture participates in rural devel-opment and the structuring of these areas can then favour the development of WSS. However, this positive effect can be undermined when agriculture monopolises water resources and/or expresses poor economic development (e.g. agricul-ture does not generate enough income above survival). 4.3 Modelling country profiles
Dondeynaz et al. (2012) proposed five country profiles that were built around 5 axes corresponding to the first five PCA components: (HDP – human development and poverty, AP – human activity pressure, WR – water resources, ODA CI – Official development Assistance, CEC – country environ-mental concern). Profile 1 (towards well-being) is considered as the most favourable profile with high values on the WR, HDP and CEC pillars. Profile 2 (freedom/democracy black spot) shows weaknesses in terms of accountability and civil society’s freedom, associated with a low commitment to-wards environment (CEC). Profile 3 (agricultural economy) presents an economy mainly driven by agricultural activities in a context of abundant natural resources. Profile 4 (essen-tial external support) and profile 5 (primary material con-sumption) are the less favourable profiles with regards to human development and poverty (HDP). However, profile 4
benefits from higher levels of freedom, environmental con-cern (CEC), political stability and high external aid support (ODA CI). Profile 5 shows an economy mainly based on nat-ural resources exploitation, often in a context of political in-stability.
The general models, described in Sect. 4.1, are used to model each country profile defined in Dondeynaz et al. (2012). The advantage of the models is to refine the anal-ysis of each country profile, which improves the interpreta-tion related to water supply and sanitainterpreta-tion status. They also complete the characterisation of each group of countries by providing the probabilistic distribution of each axis. Finally, they allow to measure mechanisms specific to a profile and to run different scenarios. The statistical performances of coun-try profile models are greater than 79 % (Table 7).
4.3.1 Analysing WSS behaviours across profiles
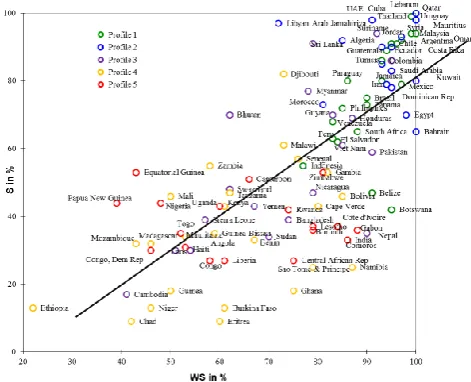
In a general way, as shown in Fig. 7, WS and S in Wat-San4Dev database show a coarse linear behaviour that can be expressed by the following equation:
S=1.0285 WS−21.82, (3)
with adjustedR2=0.5265.
This linear model only explains 52.65 % (R2)of data vari-ability, but it highlights the general gap existing between S and WS (−21.82 %) as often observed in data and on the field (UNICEF and WHO, 2008). Some examples of an in-creased gap between WS and S are: Botswana (53 % between WS and S), Nepal (55 %) and Namibia (62 %). Conversely, Libya in 2004 experienced a negative gap between WS and S (72 % versus 97 %, respectively). These latter examples are part of those that cannot be explained by the linear model introduced in this paper.
In the top right-hand corner of Fig. 7, countries belong-ing to profile 1 (91 % for WS and 75 % for S) and profile 2 (93 % for WS and 86 % for S) show high-average WSS lev-els. On the bottom left corner, instead, countries from profiles 4 (62 % for WS and 35 % for S) and profile 5 (65 % for WS and 38 % for S) show low average WSS levels.
Table 7. Statistical performance of country profile models for WS and S.
Nb. of
Model name observations error rate LL∗ QL∗ SP∗
WS-profile1 23 4.35 % 0.084 0.033 0.98
S-profile1 23 8.7 % 0.31 0.18 0.90
WS-profile2 17 5.88 % 0.16 0.079 0.96
S-profile2 17 0 % 0.054 0.0071 0.998
WS-profile3 19 21.05 % 0.42 0.27 0.85
S-profile3 19 10.53 % 0.32 0.19 0.91
WS-profile4 24 0 % 0.096 0.036 0.96
S-profile4 24 8.33% 0.24 0.14 0.93
WS-profile5 18 16.67 % 0.37 0.22 0.88
S-profile5 18 0 % 0.034 0.0052 0.998
∗LL = logarithmic loss, QL = quadratic loss where best value is 0, SP = spherical payoff where best value is 1.
case are less homogeneous, showing higher standard devia-tions: the WS average value is 73 % with 15.2 % standard de-viation while S reaches 55 % with 22 % standard dede-viation. Profile 3 is built around the AP pillar with the predominant role being played by agriculture. WSS services show higher or lower levels of development according to the agriculture sector and its organisation/dynamics. In this group, irrigation practices are linked to relatively high WS: all countries with a high irrigation level show a high access to WS (above 75 %). However, countries like Guatemala, Honduras, Nicaragua, and Suriname show good access to WS as well, without irri-gation use. This can be explained by an ongoing urbanisation that favours WS access in a context where agriculture is still dominant. In fact, these countries show an urban population rate around 45–50 % and informal slums are relatively lim-ited (below 45 %). This relationship is less clear regarding sanitation. Country profiles: analysis of Profile 4 (essential external support) and 5 (primary material consumption).
The modelling is run for all five profiles, but because of the limited space in this paper, only profile 4 and 5 will be analysed in this section, since they show a less favourable status regarding WSS (Fig. 7).
4.3.2 Model running Profile 4 (essential external support)
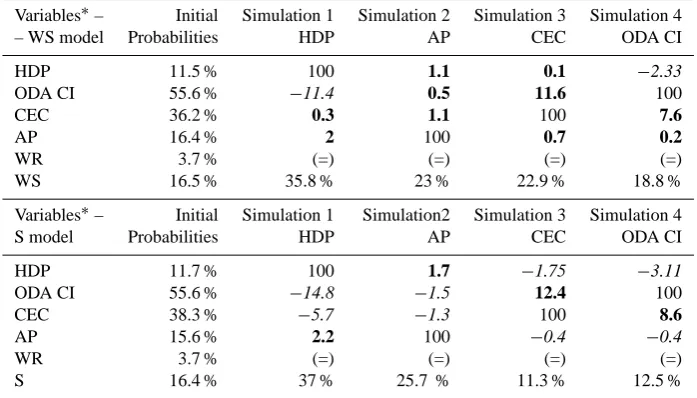
[image:15.595.49.288.91.224.2]For these countries, the sensitivity analyses of the WS model classify the HDP variables as the most important, followed by AP CEC and finally ODA CI. In the case of the S model, AP ranks fourth for S model switching with ODA CI. Countries belonging to this profile are in a less advantageous situation regarding WSS access than countries from profile 5 (see Sect. 4.3.1). However, they benefit from a stable polit-ical context which attracts external financial flows: 56 % of countries show a high ODA CI. The environmental concern is also good: 73 % of these countries show a medium-high level for CEC.
Fig. 7. WS versus S according to 5 country profiles with linear equa-tion as S=1.0285WS−21.82 andR2=0.5265.
Countries in this profile are first affected by poverty de-scribed in the model by the organisation of urbanisation (% slums), health access (Child Mortal-5, Malaria), education from basic to college (school enrol, school G/B) and ad-vanced governance (WGI-GE). Simulation 1 estimates the increment of WS going up to 35.8 % and S up to 37 % with an increment of the HDP pillar (high HDP set to 100 %).
Water resources availability is also limited with around 96 % of countries having low (66 %) or medium (30 %) WR. In fact, 23 out of 24 countries are in Africa and have part of their territories under desertification threat. All countries had part of their national territory at risk of desertification in 2004; except Djibouti which is already a desertified area (FAO statistics). Sustaining adaptation or mitigation mea-sures appears essential to fight against this constraint and en-sure long-term WSS services.
In simulations 3 and 4, ODA CI highlights some differ-ences from the general model (Sects. 4.1.1 and 4.1.2) regard-ing S and CEC. With the increment of ODA CI, high S drops down to 12.5 % and CEC increases up to 46.9 % (note that Table 8 is computed for High ODA CI category). In contrast with WS model, high S still increases up to 20 %, while CEC is concentrated on the medium-low category (34 % probabil-ity) when incrementing ODA CI at a medium level (100 % probability). In addition, an increment of ODA CI pushes the CEC at a higher level (46.9 % high probability) with respect to the S global model (34.9 % probability). This suggests that ODA CI has a better efficiency either on S and/or CEC than in a general behaviour.