Effects and consideration of storm movement in
rainfall–runoff modelling at the basin scale
Shahram Khalighi Sigaroodi1,2and Qiuwen Chen2,3
1Faculty of Natural Resources, University of Tehran, Tehran, Iran 2RCEES Chinese Academy of Sciences, Beijing, 100085, China 3CEER Nanjing Hydraulics Research Institute, Nanjing, 210023, China Correspondence to:Qiuwen Chen ([email protected])
Received: 21 July 2016 – Published in Hydrol. Earth Syst. Sci. Discuss.: 7 September 2016 Revised: 25 November 2016 – Accepted: 29 November 2016 – Published: 21 December 2016
Abstract.A number of studies have emphasized the effects of rainfall movement on runoff simulation; nevertheless, due to the lack of rain gauges inside sub-basins, a method using a hyetograph of the nearest gauges to a sub-basin is usually employed. This study investigated the effects of neglecting rainfall movement on overland simulation results in even a middle-sized basin. Simulations were carried out under two conditions: (1) stationary conditions where the nearest gauge hyetograph was used and rainfall movement was ignored, which is quite common in the case of a lack of data, and (2) moving conditions where a shifted hyetograph based on hyetograph timing recorded in the basin was used. The simu-lation results were compared with the measured discharge at the outlets. The results revealed that using the shifted hyeto-graph, which could consider the rainfall movement over sub-basins, decreased the mismatches between the simulated and observed hydrograph. In some of the cases, the shifted hyeto-graph reduced the relative difference more than 20 %. The study provided a useful method to cope with rainfall move-ment in runoff modelling of sparsely gauged large water-sheds.
1 Introduction
Since the first reports in the 1960s (Maksimov, 1964; Yen and Chow, 1968; Lee et al., 2015) emphasized that higher peak flows are generated whenever the precipitation moves from upstream toward downstream; conversely, rainfall pass-ing from down- to upstream results in a rounded hydrograph, a great deal of research has investigated the effects of
Figure 1.Barandoozchay basin and hydrometeorological gauges.
and flumes were used to simulate the hydrograph response to moving storms and subsequently soil erosion (de Lima et al., 2003). They applied different hyetograph patterns to study the effects of rainfall characteristics on the runoff hydro-graph. The simulation outputs of hypothetical storms moving upward and downward over a laboratory impervious plane revealed that the peak discharges and hydrograph shape were highly affected by storm movement. In particular, they high-lighted that runoff under moving rainfall is a non-linear pro-cess, essentially different from stationary rainfall. Saghafian et al. (1995) used a two-dimensional runoff model and a Monte Carlo method to investigate storm movement effects on runoff. The results indicated that when storm movement is slow, a stationary rainstorm could be used in simulations. However, when storm movement is fast, a stationary rain-storm was not acceptable. Ogden et al. (1995) showed that the runoff hydrograph was more sensitive to storm speed than direction in two-dimensional basin topography. Based on Manning’s equation, the peak maximum occurred when the storm moved toward downstream at a critical speed equalling half the flow velocity.
Although there is a well-known background on the effects of moving storms on overland flow generation, most of the interest has focused on laboratory experiments (Singh, 1997, 1998; de Lima et al., 2003; de Lima and Singh, 2002) or mathematical approaches (Costabile et al., 2012; Kim and Seo, 2013; Saghafian et al., 1995; Ogden et al., 1995). These studies emphasized the effects of movement on runoff gener-ation via a synthetic hyetograph whose direction, speed and intensity were well-controlled by the researchers. However, few studies are available about rainstorm movement effects on runoff in natural environments of real basins, especially
in the case of data deficiency. Therefore, it is essential to develop an approach that supports hydrologists bridging the gap between mathematical models and real conditions. The objective of this study was (1) to precisely examine the ef-fects of moving storms on hydrograph simulation at the basin scale using real recorded rainfall–runoff and (2) to provide an approach to consider storm movement under the conditions of data shortage in sparsely gauged basins.
2 Materials and methods
2.1 Study area and data availability
Barandoozchay basin, one of the Lake Urmia sub-catchments, is located in the northwest of Iran. The study area lies in between Lake Urmia and the Iran–Iraq–Turkey international border from 44◦450 to 45◦140E and 37◦060to 37◦290N. The area of the basin is about 1146 km2.
The basin is divided into seven sub-basins (B1 to B7), based on the river branches and topographic futures. Fig-ure 1 shows the Barandoozchay map and hydrometeorolog-ical gauges. This mountainous basin is mostly covered by grasslands, followed by farmland and orchard land. The hu-mid air often (not always) comes from the west, originating from the Mediterranean Sea.
There are six daily rain gauges and four stream gauges inside the basin (Fig. 1), and three hourly rain gauges (35010, 34013 and 34019) around the basin.
Figure 2.Schematic of rainfall movement effect on runoff forma-tion.
nearby rain gauges and the hydrometric runoff data from the stream gauges.
2.2 Estimation of sub-basin hyetograph
When the cloud is stationary, most of sub-basins that are cov-ered by the cloud react to the rainfall simultaneously, imply-ing that the start time and end time of the rainfall event are approximately the same for all sub-basins. However, in the case of a moving cloud, the sub-basins that are located in the wind direction start to generate runoff earlier than the others (Fig. 2).
Since there is no record from the rain gauge inside the basin, the start and end time of the events were unknown. Therefore, the residence time of the storm cloud over each sub-basin and its role in outlet runoff generation were esti-mated and examined.
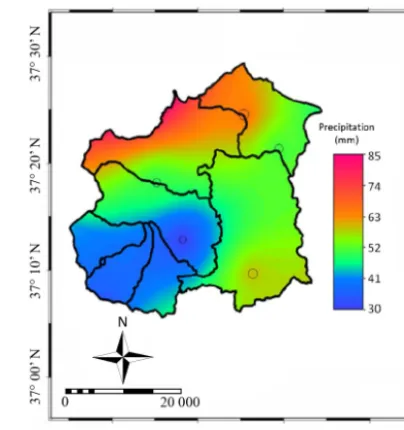
As the first step, the total daily rainfall of each sub-basin was estimated using Kriging and inverse-distance-weighting methods, based on the rain gauges inside the basin. Figure 3 shows the raster map of generated rainfall for the event on 12 May 2010.
The total daily rainfall was then disaggregated into hourly rainfall. Since there is no hourly recording gauge inside the basin, the nearest recording gauges at Urmia, Oshnavieh and Naghadeh (35010, 34013 and 34019) were used. The hourly rainfall for sub-basins was obtained through the following steps:
– First, we determine the best hyetograph from one of the stations for disaggregation. The best hyetograph was se-lected based on daily rainfall amounts in stations and sub-basins.
– Second, we calculate the ratio of total rainfall in a sub-basin to the total daily rainfall recorded in the selected station with the best hyetograph.
Figure 3.Spatial distribution of rainfall event on 12 May 2010.
– Third, we multiply the calculated ratio to the best hyeto-graph to obtain hourly rainfall of a sub-basin (Choi et al., 2008; Gyasi-Agyei, 2005; Gyasi-Agyei and Parvez Bin Mahbub, 2007). Figure 4 illustrates the procedures to disaggregate the daily rainfall into each sub-basin’s hyetograph.
Due to dynamic motion of the cloud, the rainfall duration, start and end time, and intensity, as well as other character-istics, change. These parameters are known for the gauge locations but unknown in other locations as well as in sub-basins. To determine the cloud arrival time of each sub-basin and the time of rainfall occurrence (start, end and duration), the recorded hyetograph was concentrated on a unique time named the time of gravity centre of hyetograph (TGCH) (Khalighi et al., 2009). Since the TGCH is specified in gauge locations, it can be calculated for sub-basins through the fol-lowing procedures:
1. TGCH for recorded rainfall was calculated as a momen-tum of the rainfall component around the horizontal and vertical axis. Figure 5 shows that the recorded event at station 35010 started at 04:00 LT and ended at 14:30 LT, and the calculated TGCH was at 09:00 LT (8.981). 2. When a cloud moves over a basin, the rainfall time at a
[image:3.612.324.526.66.281.2]Figure 4.Schematic of rainfall hyetograph determination in sub-basin centroid.(a)Hourly hyetograph at nearest gauge,(b)daily precipita-tion at nearest gauge,(c)daily precipitation in sub-basin centroid,(d)derived hyetograph for sub-basin.
Figure 5.Calculation of hyetograph centroid (TGCH) on 22 April 1995 at station 35015 (Gx: temporal coordinates of concentrated event, Gy: average of incremental rainfall).
coordinates of the stations (X,Y) are considered as in-dependent variables, and the TGCHs are considered as a dependent variable, and then the coefficients (a,bandc) of the flat plane are calculated using algebraic functions (Howard, 2010).
3. The coordinates of the sub-basin centroids were placed in the above equations to determine the TGCH of each sub-basin.
4. The previously derived hyetograph was shifted as its gravity centre conformed to the TGCH of each sub-basin centroid (Fig. 7).
For example, the TGCH for the event on 22 April 1995 was recorded at 8.98, 6.48 and 5.33 at the sta-tions 35010, 34019 and 34013 respectively (Table 2). Then the equation of the TGCH plane of this event is TGCH=0.000077×X+0.000069+Y−317.457. Based on this equation and the coordinates of the B1 sub-basin centroid, the TGCH was 08:00 LT, implying that the TGCH at B1 occurred almost 1 h earlier than at station 35010, which was 08:59 LT.
Figure 6.Flat plane passing through the TGCH for the event on 22 April 1995.
Figure 7.Shifting the hyetograph to the estimated TGCH.
2.3 Rainfall–runoff modelling
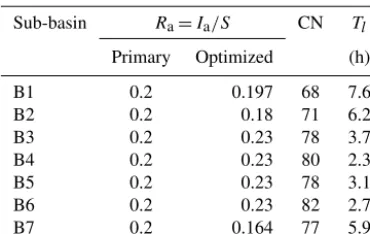
[image:4.612.310.547.226.419.2] [image:4.612.309.543.471.546.2]B5 0.2 0.23 78 3.1
B6 0.2 0.23 82 2.7
B7 0.2 0.164 77 5.9
optimized parameters in sub-basins. The validation was con-ducted using the events on 12 May 2010 and 22 April 2014. The results of peak discharges are shown in Table 2.
After the calibration and validation, the simulations were carried out for all events using two hypotheses: (1) stationary cloud where the sub-basin hyetograph timing is equal to the nearest recording gauge and (2) moving cloud where the sub-basin rainfall hyetograph shifted based on cloud movement direction and sub-basin location.
A Taylor diagram (Taylor, 2001, 2005; Sigaroodi et al., 2014) and root mean square of relative difference (RD) were used to compare the results of two hypothesized conditions:
RD= s
P O−PS
PO 2
+100, (1)
where the PO and PS are observed and simulated peak dis-charge respectively.
3 Results
Figure 8 shows the planes of TGCH for different events. Al-though the basin is mainly affected by the eastern humid Mediterranean air, the results indicated that each selected rainfall event had different directions and speeds.
Based on the gauge locations and TGCH of each event, a plane equation TGCH=aX+bX+cwas obtained for each event. Table 3 shows the equation coefficients.
The gravity centre coordinate of each sub-basin is used in the equations to calculate the TGCH for the sub-basin centroid of each event. Figure 9 shows how the sub-basin hyetograph is shifted to obtain the TGCH for the event on 3 April 2003. The measured TGCH at the gauges and the calculated TGCH for sub-basins are shown in Table 4.
Figure 10 presents the HEC-HMS modelled results for the event on 22 April 2014 at gauge 35005. The right part shows the model performance under stationary conditions where all sub-basins react to the hyetograph simultaneously. The grey and brown lines are the modelled outputs for upper sub-basins, which make the simulated total output (blue line). The hydrograph is sharp and the time to peak is quite
differ-ent compared to the observed hydrograph (red line). The left part presents the modelled result using a shifted hyetograph, which matches better with the observed hydrograph.
For comparison, the modelled peak discharges of the seven selected events under the two conditions are presented to-gether with the observations in Table 5.
Figure 11 displays the standard deviation (SD) and corre-lation coefficientR2of the modelled results under stationary and moving conditions on the Taylor diagram. It is clearly seen that the moving-condition results are closer to the ob-servation points than the stationary-condition results.
4 Discussion
To achieve accurate hydrological modelling, high-quality and spatially explicit rainfall data should be accessible; how-ever, in many cases uniform hyetographs are used for all sub-basins due to lack of sufficient gauges. If the cloud motion is neglected, it means that the differences between the times of runoff generated by sub-basins are ignored. In this case, to compensate for the difference and achieve better matching between simulated and observed runoff, other basin factors such as curve number (CN) or time lag have to be modified, which most probably cause artifacts in the coefficients (Kha-lighi et al., 2006, 2009).
[image:5.612.76.261.85.202.2] [image:5.612.307.548.96.154.2]Figure 8.Precipitation time occurrence plane in different events.
Figure 9.Hyetograph of sub-basins before shift (left panel) and after shift (right panel). (Red arrows show the timing position of TGCH before and after shifting.)
Figure 10.HEC-HMS output for rainfall event on 22 April 1995, under two different conditions: moving simulation (left panel) and stationary simulation (right panel).
When the cloud movement is slow, consideration of move-ment is more important than during fast movemove-ment condi-tions. During the event of 22 April 2014, the time difference between gauges 35010 and 34019 (Table 4) shows that the cloud movement is very low. Thus the sub-basin B1 gener-ates runoff much earlier than B7. This result was not consis-tent with the findings of Saghafian (1995), who stated that a stationary rainstorm could be used in low-speed storms. This study showed that, for small basins or laboratory scales, where the cloud covers the whole basin, the storm motion ef-fect could be ignored. However, in the case of middle-size to large basins, the runoff of low-speed storms passing over the basin has an obvious role in determining hydrograph shape. It can then be concluded that when the time difference be-tween the recorded rainfall around the area is small, the
dif-ferences between stationary and moving runoff simulations are slight. These results were consistent with the findings of previous studies, which showed the impacts of cloud motion on hydrographs by using rainfall simulators at different lab-oratory scales (Sing, 1997, 1998; de Lima and Singh, 2002; de Lima et al., 2003; Marzen et al., 2015) or the kinematic wave method (Mizumura and Ito, 2011).
[image:6.612.100.494.364.485.2]Table 4.TGCH measured at the gauges and calculated for the sub-basins.
Location UTM Precipitation events
X Y 22
Apr
1995
21
Apr
2002
3
Apr
2003
18
Apr
2006
7
Apr
2008
12
May
2010
22
Apr
2014
Gauges
35010 507 361 4 155 960 8.98 20.4 7.3 14.7 3.0 8.3 15.9
34019 534 124 4 091 310 6.48 26.7a 6.2 23.4 6.2 1.6 25.5
34013 510 374 4 100 492 5.33 20.7 1.1 17.3 4.8 4.0 25.9
Sub-basins
B1 510 820b 4 139 365 8.0 21.1 6.3 16.1 3.7 6.8 18.7
B2 495 670 4 134 355 6.5 17.2 4.5 12.6 3.1 7.6 20.9
B3 493 644 4 123 015 5.6 16.6 3.7 12.5 3.3 6.9 23.2
B4 483 585 4 118 992 4.5 14 2.8 10.1 3 7.3 24.9
B5 486 806 4 113 932 4.4 14.8 2.9 11.1 3.3 6.7 25.5
B6 493 217 4 112 538 4.8 16.4 3.2 12.7 3.6 6.1 25.2
B7 508 969 4 120 830 6.6 20.5 5.1 16.3 4.1 5.6 22.3
aNumbers over 24 refer to the next day.bCoordinate of centroid of sub-basin.
Table 5.Modelled peak discharges under two conditions and differences. The bold numbers show the better results.
Peak discharge Difference (%)
Date Hydrological Obs. Stationary Moving Stationary Moving
station
22 Apr 2014 35005 297.9 352 315.3 18.2 5.8
12 May 2010 34.8 31.5 34.4 9.5 1.1
7 Apr 2008 61.4 70.15 65.6 14.3 6.8
18 Apr 2006 96.15 100.5 100.13 4.5 4.1
3 Apr 2003 20.1 20.4 20.3 1.5 1
21 Apr 2002 65.9 42.9 41.6 34.9 36.9
22 Apr 1995 37.45 51.2 42.58 36.7 13.7
12 May 2010 35003 12.2 14.4 13.4 18 9.8
7 Apr 2008 51.9 65.16 63.4 25.5 22.2
18 Apr 2006 85.4 93.8 93.57 9.8 9.6
3 Apr 2003 3.7 3.5 3.8 5.4 2.7
21 Apr 2002 24.3 28.8 26.1 18.5 7.4
22 Apr 1995 113.2 127.7 127.3 12.8 12.5
22 Apr 1995 35001 83 83.3 83.3 0.4 0.4
It should be noted that the effects of cloud movement on hydrograph modelling become visible only when the study area is divided into sub-basins. In addition, lack of gauges in this study resulted in the use of a flat plane to calculate the
[image:7.612.121.475.191.389.2] [image:7.612.128.470.439.645.2]hydro-Figure 11.Scatter plot of the simulated peak discharge for station-ary and moving conditions on a Taylor diagram.
graph shapes as well as peak discharges indicated that the proposed method could significantly improve runoff mod-elling accuracy in sparsely gauged large basins.
In conclusion, although there are many laboratory experi-ments on the effects of rainfall movement on runoff simula-tion, this study developed an important method to determine how the spatial–temporal dynamics of rainfall can be consid-ered at the real watershed scale, in particular for large areas without sufficient gauges.
5 Data availability
The data used in this research were collected from the Min-istry of Energy of Iran. The data are provided in the supple-ment, which can be freely used for research purposes.
The Supplement related to this article is available online at doi:10.5194/hess-20-5063-2016-supplement.
Acknowledgements. This research was supported by the National Nature Science Foundation of China (no. 91547206, 51425902). The authors are grateful to Catharine Rice for proofreading the manuscript.
Edited by: Y. Chen
Reviewed by: G. Wang and one anonymous referee
equations, Hydrol. Process., 27, 554–569, 2012.
de Lima, J. L. M. P. and Singh, V. P.: The influence of the pattern of moving rainstorms on overland flow, Adv. Water Resour., 25, 817–828, 2002.
de Lima, J. L. M. P., Singh, V. P., and de Lima, M. I. P.: The influ-ence of storm movement on water erosion: storm direction and velocity effects, Catena, 52, 39–56, 2003.
Gyasi-Agyei, Y.: Stochastic disaggregation of daily rainfall into one-hour time scale, J. Hydrol., 309, 178–190, 2005.
Gyasi-Agyei, Y. and Parvez Bin Mahbub, S. M.: A stochastic model for daily rainfall disaggregation into fine time scale for a large region, J. Hydrol., 347, 358–370, 2007.
Howard, A.: Elementary Linear Algebra, 10th Edn., John Wi-ley & Sons, Hoboken, NJ, USA, p. 1276, 2010.
Khalighi, S., Mahdavi, M., and Saghafian, B.: Land use change effects on potential flooding, using NRCS model (Case study: Barandoozchay Basin), Iran. J. Nat. Resour., 58, 733–742, 2006. Khalighi, S., Zinati, T., Salajegheh, A., Kohande, A., and Mortezaee, G.: Estimation of Storm Movement Effect on rainfall–runoff Modeling (Case study: Latian basin), Iran. J. Nat. Resour., 62, 363–375, 2009.
Kim, D. H. and Seo, Y.: Hydrodynamic analysis of storm move-ment effects on runoff hydrographs and loop-rating curves of a V-shaped watershed, Water Resour. Res., 49, 6613–6623, 2013. Lee, T., Shin, J., Park, T., and Lee, D.: Basin rotation method for
analyzing the directional influence of moving storms on basin response, Stoch. Environ. Res. Risk A., 29, 251–263, 2015. Maksimov, V. A.: Computing runoff produced by a heavy rainstorm
with a moving center, Soviet Hydrol., 5, 510–513, 1964. Marzen, M., Iserloh, T., de Lima, J. L. M. P., and Johannes, B. R.:
Particle transport patterns of short-distance soil erosion by wind-driven rain, rain and wind, Geophys. Res. Abstr., 17, 6075-1, 2015.
Mizumura, K. and Ito, Y.: Influence of moving rainstorms on over-land flow of an open book type using kinematic wave, J. Hydrol. Eng., 16, 926–934, 2011.
Ngirane, K. G. G. and Wheater, H. S.: Hydrograph sensitivity to storm kinematics, Water Resour. Res., 21, 337–345, 1985. Ogden, F. L., Richardson, J. R., and Julien, P. Y.: Similarity in
catch-ment response, 2, Moving rainstorms, Water Resour. Res., 31, 1543–1547, 1995.
Saghafian, B., Julien, P. Y., and Ogden, F. L.: Similarity in catch-ment response, 1, Stationary rainstorms, Water Resour. Res., 31, 1533–1541, 1995.
Sigaroodi, S. K., Chen, Q., Ebrahimi, S., Nazari, A., and Choobin, B.: Long-term precipitation forecast for drought relief using at-mospheric circulation factors: a study on the Maharloo Basin in Iran, Hydrol. Earth Syst. Sci., 18, 1995–2006, doi:10.5194/hess-18-1995-2014, 2014.
[image:8.612.68.264.64.225.2]