Cognitive Function in Type 2 Diabetes: A Study
Using Younger Adults
Katy Lucas
A thesis submitted in partial fulfillment of the requirements of
the University of East London for the degree of Professional
Doctorate in Clinical Psychology
TABLE OF CONTENTS
1. INTRODUCTION, AIMS & JUSTIFICATION ... 1
1.1 LITERATURE SEARCH ... 1
1.2 WHAT IS DIABETES? ... 1
1.3 HISTORY OF DIABETES ... 2
1.4 DIFFERENT TYPES OF DIABETES ... 2
1.4.1 T1DM ... 2
1.4.2 T2DM ... 3
1.5 DIAGNOSTIC CRITERIA ... 3
1.5.2 Hba1c ... 4
1.5.3 Variation in diagnosis around the world ... 5
1.6 EPIDEMIOLOGY OF DIABETES ... 5
1.7 MANAGEMENT OF DIABETES ... 6
1.8 COMPLICATIONS OF DIABETES ... 7
1.8.1 Microvascular complications ... 7
1.8.2 Macrovascular complications ... 8
1.8.3 Metabolic Syndrome ... 9
1.9 RISK FACTORS IN DEVELOPING DIABETES ... 9
1.9.1 Obesity and Overweight ... 9
1.9.2 Preventing diabetes and its complications ... 10
1.10 OLDER PEOPLE WITH DIABETES ... 10
1.11 COGNITIVE FUNCTION ... 11
1.11.1 Processing Speed ... 11
1.11.2 Attention ... 12
1.11.3 Executive Function ... 12
1.11.4 Memory ... 12
1.12 FACTORS CONTRIBUTING TO COGNITIVE FUNCTION ... 13
1.12.1 Premorbid functioning ... 13
1.12.2 Mood and Anxiety ... 13
1.13 CORRELATES OF COGNITIVE FUNCTION IN DIABETES ... 14
1.13.1 Cognition and Hba1c ... 14
1.13.2 Cognition and hypertension ... 15
1.13.3 Cognition and cardiovascular risk factors ... 16
1.13.4 Cognition and High Cholesterol ... 16
1.13.5 Cognition and obesity ... 17
1.14 DIABETES AND CNSNEUROPATHOLOGY ... 18
1.14.1 Structural Changes ... 18
1.14.2 Glucose ... 18
1.15 EFFECTS OF COGNITIVE DECLINE IN MANAGING DIABETES ... 19
1.15.1 Research into the impact of cognitive decline on managing diabetes ... 19
1.15.2 Cognitive domains that matter in diabetes management ... 19
1.16 INTERSECTION OF DIABETES,COGNITION AND CONTEXT ... 20
1.16.1 Diabetes and Poverty ... 20
1.16.2 Cognition and Poverty ... 21
1.17 YOUNG PEOPLE WITH T2DM ... 22
1.18 RATIONALE ... 23
1.19 AIMS AND RESEARCH QUESTIONS: ... 25
2.1 EPISTEMOLOGY ... 26
2.1.1 Positivism ... 26
2.1.2 Critical Realism ... 26
2.1.3 Pragmatism ... 27
2.1.4 Neuropsychology ... 27
2.1.5 My position ... 27
2.2 DESIGN ... 28
2.2.1 Control group ... 28
2.3 RECRUITMENT ... 28
2.3.1 Eligibility Criteria ... 29
2.3.2 Recruitment Process ... 31
2.4 SAMPLE SIZE ... 32
2.5 ETHICAL ISSUES ... 32
2.5.1 Ethical Approval ... 32
2.5.2 Confidentiality & Anonymity ... 33
2.5.3 Informed Consent ... 33
2.5.4 Harm Minimisation ... 33
2.6 PROCEDURE ... 33
2.7 MATERIALS ... 34
2.7.1 Optimal Ability ... 35
2.7.2 Verbal Attention ... 35
2.7.3 Processing Speed ... 36
2.7.4 Learning and Memory ... 37
2.7.5 Executive Function ... 37
2.7.6 Verbal and Visuo-spatial Functions: ... 38
2.7.7 Mood ... 38
2.8 ANALYSIS ... 38
2.9 PARTICIPANT CHARACTERISTICS ... 39
2.9.1 Sex of Participants ... 39
2.9.2 Birth Country and Language ... 40
2.9.3 Employment status ... 40
2.9.4 Comorbidities ... 40
2.9.5 Diabetes-related health indicators ... 40
2.9.6 Cognition related health indicators ... 41
3. RESULTS ... 42
3.1 EXPLORATORY DATA ANALYSIS ... 42
3.2 ANALYSIS OF COGNITIVE FUNCTION ... 42
3.3 ANALYSIS OF CONTRAST TO ESTIMATE OF PREMORBID FUNCTIONING ... 47
3.4 RELATIONSHIP BETWEEN DIABETES-RELATED HEALTH INDICATORS ... 49
3.5 RELATIONSHIP BETWEEN DIABETES MARKERS AND COGNITIVE FUNCTION ... 49
3.5.1 Hba1c ... 49
3.5.2 Lipid profile ... 49
3.6 SUMMARY OF RELATIONSHIP BETWEEN DIABETES CLINICAL MARKERS AND COGNITIVE FUNCTION 50 3.7 CASE SERIES ANALYSIS ... 50
3.7.1 Participant One ... 51
3.7.2 Participant Two ... 53
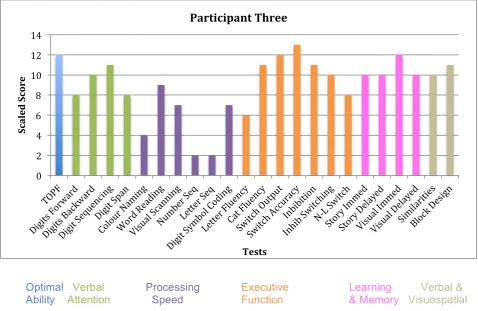
3.7.3 Participant Three ... 54
3.7.4 Participant Four ... 56
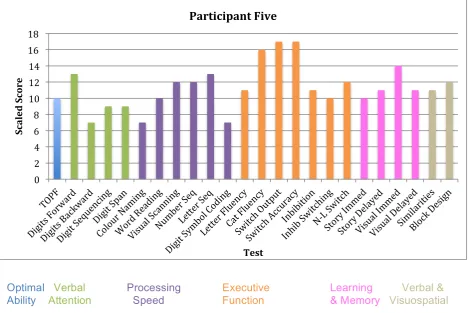
3.7.5 Participant Five ... 58
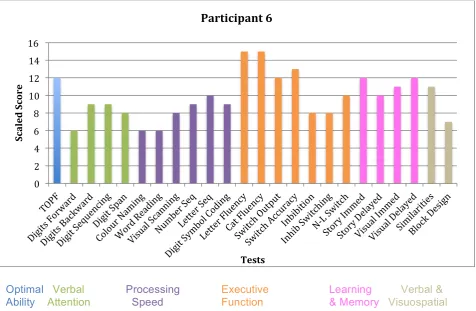
3.7.6 Participant Six ... 60
3.7.7 Participant seven ... 62
3.7.9 Participant nine ... 66
3.7.10 Participant 10 ... 68
3.8 SUMMARY OF CASE SERIES ANALYSIS ... 70
3.8.1 Comparison to TOPF ... 70
3.8.2 Comparison to other group sample findings ... 70
3.8.3 Summary ... 70
4. DISCUSSION ... 72
4.1 SUMMARY ... 72
4.2 POPULATION DEMOGRAPHICS ... 72
4.3 AREAS OF RESEARCH INTEREST ... 73
4.3.1 Optimal Ability ... 73
4.3.2 Diabetes-related health indicators and cognitive function ... 73
4.3.3 Relationship of demographic factors with cognitive function ... 75
4.4 CASE SERIES ANALYSIS ... 75
4.4.1 Tests of premorbid functioning ... 75
4.4.2 Cognitive function ... 76
4.4.3 Comparisons to previous work in the field ... 76
4.4.4 Application to the research questions: ... 77
4.4.5 Summary ... 78
4.5 STUDY LIMITATIONS AND RECOMMENDATIONS ... 78
4.5.1 Limitations ... 78
4.5.2 Recommendations ... 80
4.6 CRITICAL REVIEW ... 85
4.6.1 Personal reflections ... 85
4.7 CONCLUSION ... 89
5. REFERENCES ... 90
6. APPENDICES ... 109
6.1 APPENDIX A:PARTICIPANT INFORMATION SHEETS FOR THE CAMDEN RESEARCH SITE ... 109
6.2 APPENDIX B:NHSRESEARCH ETHICS COMMITTEE PROVISIONAL APPROVAL ... 112
6.3 APPENDIX C:LETTER TO ADDRESS ISSUES FROM RECBOARD ... 118
6.4 APPENDIX D:NHSRESEARCH FAVOURABLE OPINION LETTER ... 120
6.5 APPENDIX E:HRAAPPROVAL LETTER ... 125
6.6 APPENDIX F:LETTER OF ACCESS FROM THE ROYAL FREE HOSPITAL ... 133
6.7 APPENDIX G:UELETHICAL APPROVAL ... 136
6.8 APPENDIX H:URECSPONSORSHIP CONFIRMATION LETTER ... 139
6.9 APPENDIX I:CONSENT FORM FOR CAMDEN RESEARCH SITE ... 141
CONSENT FORM.VERSION 1.2(1STSEPTEMBER 2016) ... 141
6.10 APPENDIX J:INTERVIEW PROTOCOL ... 142
PROTOCOL VERSION 1.1(4THAUGUST 2016)IRAS203389 ... 142
6.11 APPENDIX K:PARTICIPANT DEBRIEF SHEET ... 145
6.12 APPENDIX L:BLANK RECORD FORM ... 147
V1.2(1STSEPTEMBER 2016)IRAS:203389 ... 147
RECORD FORM ... 147
LIST OF TABLES
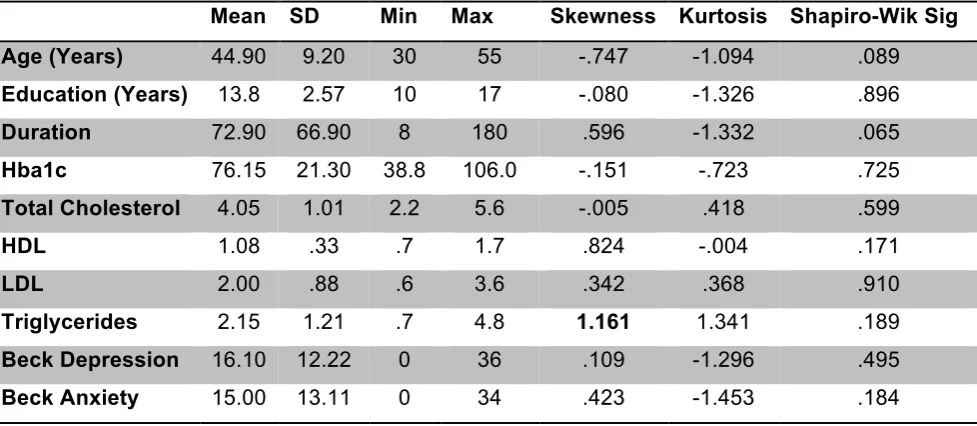
Table 1 Descriptive Statistics for Participant Characteristcs ... 39
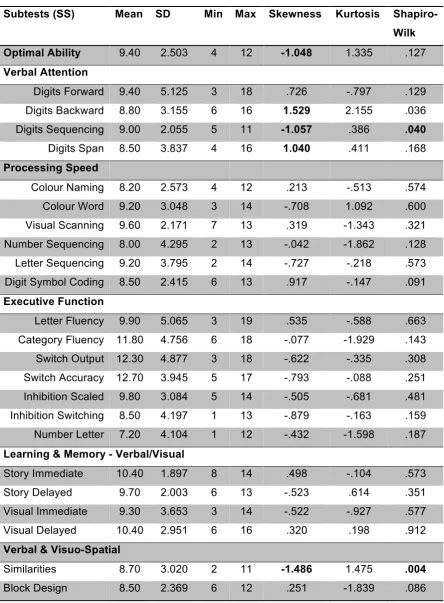
Table 2 Descriptive and Distribuition Statistics for Particiants Test Scores ... 44
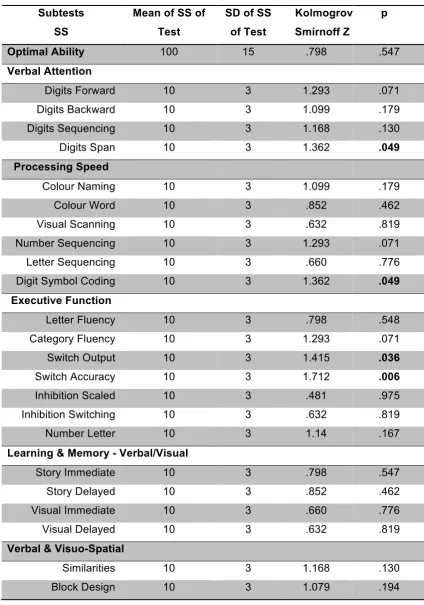
Table 3 Neuropsychologcial Tests Compared to Normative Data ... 46
LIST OF FIGURES
Figure 1 Scaled test scores for participant one. ... 51
Figure 2 Scaled test scores for participant two. ... 53
Figure 3 Scaled test scores for participant three. ... 54
Figure 4 Scaled test scores for participant four. ... 56
Figure 5 Scaled test scores for participant five. ... 58
Figure 6 Scaled test scores for participant six. ... 60
Figure 7 Scaled test scores for participant seven. ... 62
Figure 8 Scaled test scores for participant eight. ... 64
Figure 9 Scaled test scores for participant nine. ... 66
LIST OF ABBREVIATIONS
BBB Blood Brain Barrier BAI Beck Anxiety Inventory BDI Beck Depression Inventory
BMI Body Mass Index
CVD Cardiovascular Disease DAT Dementia Alzheimer’s Type
DKEFS Delis Kaplan Executive Function System
DM Diabetes Mellitus
EF Executive Function
FG Fasting Glucose
FGT Fasting Glucose Test
GA Glycated Albumin
HBA1c Glycated Haemoglobin
HDL High Density Lipoproteins IFG Impaired Fasting Glucose IGT Impaired Glucose Tolerance
K-S Komogrov-Smirnov
LDL Low Density Lipoproteins MI Myocardial Infarction
MMSE Mini Mental State Examination MOCA Montreal Cognitive Assessment
MS Muscular Sclerosis
NCD Non Communicable Diseases
NICE National Institute for Health and Care Excellence OGTT Oral Glucose Tolerance Test
PIS Patient Information Sheet
PS Processing Speed
SES Social Economic Status
SPSS Statistical Package for the Social Sciences TOPF Test of Premorbid Functioning
TG Triglycerides
VD Vascular Dementia
VF Verbal Fluency
WAIS Wechsler Adult Intelligence Scale
WM Working Memory
ACKNOWLEDGMENTS
I would like to thank all the patients at the Camden Diabetes Integrated Practice Unit who kindly took part in my research, and gave up their valuable time. I also want to thank all the staff there for their support, and for speaking with me even when they were extremely busy (which was most of the time!)
Special thanks to Dr Clare Crawford, Dr Paul Chadwick and Shantell Naidu for your supervision and support with recruitment; also to the administrative team, Simone Hurley, Portia Gray and Penny Taylor, who helped me enormously in the logistics of testing and never once complained about my numerous requests.
To Dr Matthew Jones-Chester – I cannot thank you enough for your support over the past three years. Your guidance has always been constructive and your patience knows no limits, for which I will be forever grateful.
ABSTRACT
Background: The rising rates of Type 2 diabetes (T2DM) around the world have serious economic and health implications, often related to the complications of the condition. One such problem is the impact of diabetes on cognitive function. In older adults with T2DM, there is an established relationship between diabetes and cognitive impairment in people with and without dementia. Emerging
evidence suggests this may also be the case for younger adults, as the
occurrence of cognitive deficits in people with T2DM is related to the severity and duration of the condition. In some parts of the world, T2DM has become the most common diabetes phenotype in children. Therefore, exploring the cognitive function of younger adults with T2DM is important, to understand the pathogenesis and sequelae of the condition across the lifespan.
Aims: To investigate if younger adults with T2DM show signs of cognitive impairment, and how this relates to diabetes-related health indicators.
Method: Ten people with T2DM were recruited from a diabetes clinic in London, and completed a battery of cognitive tests assessing processing speed, attention, executive function, learning and memory. Estimates of optimal (premorbid) ability were also derived. Clinically relevant markers for diabetes were recorded,
including Hba1c and lipid profiles.
Results: Scores on cognitive tests suggested deficits in attention and processing speed, but executive function was a relative strength. Scores were not declined relative to one measure of optimal ability across the group. Health markers related to diabetes were correlated with several cognitive domains, although not consistently: total cholesterol levels showed the strongest associations, and not always in the direction anticipated.
1. INTRODUCTION, AIMS & JUSTIFICATION
1.1 Literature Search
The search strategy used to inform the literature presented here was undertaken in four stages. The first was a scoping search, by finding existing reviews and becoming familiar with which databases would be included in the final search.
Secondly, key search terms for each database were defined, and further terms were sought using pearl-growing, and this formulated a search strategy.
Third, the database search was performed, using PubMed, PsycInfo, Science Direct, Scopus and Google Scholar, employing free text and thesaurus searching methods (where thesaurus was permitted).
Finally, a bibliography search was conducted by looking at reference lists of papers, key authors and within highly cited or key articles for additional references.
1.2 What is Diabetes?
Diabetes Mellitus (DM) is a metabolic syndrome in humans that is characterised by chronic hyperglycaemia, or high levels of glucose in the blood, that the body is unable to use. In order to use glucose or blood glucose insulin is required, which is a hormone that regulates blood sugar. There are lots of different types of diabetes, but developing the condition is most likely due to one of two reasons: either the body does not produce insulin - Type 1 Diabetes Mellitus (T1DM), or the insulin it produces is ineffective - Type 2 Diabetes Mellitus (T2DM). The ability to regulate glucose in the body is known as glycemic control. Once termed a disease of the West, T2DM is now a global issue and has been called the biggest health epidemic of this century (Tabish, 2007). Whilst it is treatable and
1.3 History of Diabetes
The symptoms of diabetes were first mentioned in Egyptian manuscripts in 1500 B.C., when it was observed that ants were attracted to the urine of people with an emaciating disease (MacCracken & Hoel, 1997). The condition did not come to have the name ‘diabetes’ until around 250 B.C. Diabetes, comes from the Greek word for a siphon, as the condition was characterised by liquid leaving the body in the form of excessive urination. The word ‘mellitus’ (honeyed) was added when a London physician in the late 18th century tasted the urine of his patients with diabetes, and noted that it was sweet (Tatersall, 2010). This was actually a re-discovery as in India 400 B.C., the term ‘honeyed urine’ was first used. Although the link between diabetes and the pancreas was identified in the 1800s, the connection between diabetes and insulin was discovered later. In 1921, it was established after many years of speculation that an insulin deficiency was implicated in diabetes (Barnett & Krall, 2005).
The subdivision of diabetes into different types was first recognised in the 1700s onwards, noting that leanness (T1DM) or obesity and later onset (T2DM) was commonly associated with the condition (Alberti, 2010). However, the diagnostic terms were established in the mid 60’s (World Health Organisation, 1964).
1.4 Different types of diabetes
Although there are several different types of diabetes, for the purpose of the thesis, I will be focusing on explaining the two most common types, T1DM and T2DM, in greater detail.
1.4.1 T1DM
T1DM is an autoimmune disorder that destroys insulin-producing beta cells in the pancreas, and people with the condition can also have insulin resistance (Alberti, 2010). It typically develops in childhood or early adolescence, is normally
1.4.2 T2DM
Historically, T2DM (referred interchangeably with diabetes from this point on) was known as the older adults’ disease. This was due in part to the higher incidence in the older population, estimated as one in four in some countries (Gambert & Pinkstaff, 2006). However, T2DM is now very common in middle-aged adults. It is the most common form of diabetes, with around 90-95% of people with diabetes having T2DM (American Diabetes Association, 2008). It is characterised by either not making enough insulin or the insulin generated being ineffective. Unlike
T1DM, people with T2DM do not usually need insulin for survival, but as the condition progresses, people may require insulin to ensure they control their blood sugar effectively (Alberti, 2010).
1.5 Diagnostic Criteria
Typically, people who present with symptoms of diabetes such as thirst, polyuria (excessive urination), weight loss, or recurrent infections would be tested for diabetes. In the last 10 years, there have been three ways in which people around the world have been tested for diabetes by: casual, fasting, and oral glucose load.
1.5.1.1 Casual glucose load: can be measured by a one-off measurement of
blood glucose and a definite diagnosis would be given to someone with a blood plasma level greater than 11.1 mmol/L (200mg/dL) or 12.2 mmol/L (220mg/dL) in capillary plasma. Any values between 5.0-11.0 would be uncertain and may constitute ‘Prediabetes’ or Impaired Glucose Tolerance (IGT) (see below).
1.5.1.2 Fasting glucose test (FGT): is a blood taken after fasting. It is usually
1.5.1.3 Oral glucose tolerance testing (OGTT): was developed in the 19th century, but only became more common when blood testing became easier to conduct. It was recommended in the first diagnostic criteria defined by the World Health Organisation (1964), who stated that glycosuria – raised sugar in urine - was insufficient to confirm or rule out diabetes. Before the test, patients are asked to eat at least 250g carbohydrates for three days prior to testing, and to refrain from eating or drinking certain fluids, eight to 12 hours before testing. As part of the test, the patient will have their blood tested, then be given a glucose drink, and their blood will be tested again two hours later.
1.5.1.4 ‘Borderline diabetes’ or ‘Prediabetes’: is a concept that has emerged
since the late 1970s, where people without diabetes had blood plasma levels of glucose, which were higher than normal. The World Health Organisation (1980) named this Impaired Glucose Tolerance (IGT). Later, the concept of Impaired Fasting Glucose (IFG) was added, to indicate blood glucose that was high but below the threshold for a diabetes diagnosis. The presence of both IGT and IFT in a person, has led to the introduction of a label known as ‘prediabetes’,
although not everyone affected will go on to develop diabetes. In this sense, the label is seen as less helpful and some relevant bodies prefer the term
‘intermediate hypoglycaemia’ (World Health Organisation, 1999).
1.5.2 Hba1c
Hba1c is a cut off of 6.5% for diagnosing diabetes, but anything below this does not rule out diabetes diagnosed via glucose testing.
1.5.3 Variation in diagnosis around the world
As the implications of diabetes can be lifelong and difficult, it is important that diabetes is diagnosed correctly. However, as mentioned previously, the criteria that has been used for diabetes diagnosis has varied worldwide – in part due to availability of Hba1c testing. As such, when evaluating relevant studies of people with diabetes, the accepted diagnosis will either be using Hba1c or by casual, fasting or oral glucose testing.
1.6 Epidemiology of Diabetes
Using the above diagnostic criteria, in 2015, there were 2.8 million people in the UK and 415 million people worldwide with diabetes. By 2040, that is estimated to rise to 3.5 million people and 642 million respectively (International Diabetes Federation, 2015). Currently, those figures equate to 1 in 11 having diabetes, rising to one in 10 in less than 30 years time. The global cost of diabetes annually is estimated as $825 billion (NCD Risk Factor Collaboration, 2016), with
approximately 12% of global health expenditure on diabetes. The healthcare cost of people with diabetes is calculated as around two to three times higher than a person without diabetes (International Diabetes Federation, 2015). The reason for this difference is partially explained by the rising cost of medication, but also the increase in numbers of people with diabetes and diabetic related
1.7 Management of Diabetes
As every person with diabetes is different, the management of the condition is done in various ways. However, in the UK there are several aspects of diabetes care that are standardised. According to the National Institute for Health and Care Excellence (2016b), as someone with T2DM, one should expect the following from your diabetes healthcare professional:
• Advice about local support groups
• The opportunity to attend a diabetes education group • Diet and lifestyle advice
• An annual blood pressure check • Regular blood glucose check
• Quarterly to bi-annual Hba1c check
• Discussions about medication to control your blood glucose
• Where necessary, discussions about insulin and how to inject properly • Explanations about hypoglycaemia or ‘hypos’, and the symptoms, risks
and treatment
• Exploring risk of cardiovascular disease now and in the future • Offering regular eye screening and foot checks
• Checking other possible complications such as kidney disease or nerve problems
As a result, the burden of diabetes is high and this is on several levels: to the individual in terms of health-related burden e.g. medication (Black et al., 2015), social burden – including the impact on the family and retaining gainful
1.8 Complications of Diabetes
As part of the global health agenda, diabetes is the most common of four non-communicable diseases (NCD) (cannot be transmitted from person to person) that are focused on by world leaders due to the disability and premature death they cause. People with diabetes are at increased risk of developing
complications if their blood glucose levels remain high. These complications can make diabetes more difficult to manage but can also cause life altering disabilities or even death. Whilst diabetes care is aimed at making sure that hyperglycaemia is avoided, a secondary aim of diabetes management is preventing damage to the human vascular tree of the body (Fowler, 2008) - including microvascular (small) and macrovascular (large) blood vessels.
1.8.1 Microvascular complications
1.8.1.1 Retinopathy: is an eye disease affecting the blood vessels, which can
lead to vision loss or blindness. The cause of retinopathy in diabetes is
consistently high blood glucose. Retinopathy can be at an advanced stage before symptoms are detected so regular eye screening is recommended for people with diabetes.
1.8.1.2 Diabetic foot and nerve damage: can develop in people with diabetes
1.8.2 Macrovascular complications
1.8.2.1 Hypertension: is defined as high blood pressure which is considered to
comprise a systolic pressure (the force at which your heart pumps blood around your body) of 140 or above and a diastolic pressure (the resistance to the blood flow in the vessels) of 90 or above e.g. 140/90 or higher. It affects between 67% and 71% of people with T2DM (Suh, Kim, Choi, Plauschinat, & Barone, 2009; Centers for Disease Control and Prevention, 2014). As such, hypertension is often seen as a condition that interacts with diabetes, and shares several underlying risk factors, including ethnicity, familial risk and lifestyle (Long & Dagogo-Jack, 2011). Whilst hypertension has been highlighted as a
macrovascular complication, like diabetes, it can have implications on a
microvascular level as well. Hypertension without diabetes is best managed by blood pressure monitoring, medication and lifestyle changes, such as a healthy diet and regular exercise, and reducing smoking, alcohol, salt and caffeine intake (National Institute for Health and Care Excellence, 2016c). Hypertension that is concurrent with diabetes is managed similarly, but focuses on medication, improved glucose and lipid control (National Institute for Health and Care Excellence, 2016b).
1.8.2.2 Cardiovascular disease (CVD): refers to several conditions affecting the
heart such as angina, myocardial infarction (MI or heart attack), congestive heart failure, peripheral artery disease and stroke. These conditions do not develop exclusively as a result of high blood glucose, but are also affected by
dyslipidaemia (abnormal levels of lipids in the blood) and hypertension. CVD is the biggest risk factor for people with diabetes and they have a two to four fold risk of developing CVD across their lifetime compared to people without diabetes (Kannel, 1985), with men more likely than women to develop it (Kannel & McGee, 1979). CVD is the leading cause of disability and death of people with diabetes. However, there are a number of factors that can mitigate this risk and research has focused on aspects of how someone comes to develop CVD.
1.8.2.3 Dyslipidemia: is defined as an abnormal level of lipids in the blood. This
low level of high-density lipoprotein cholesterol (HDL) in the blood. Both LDL and HDL are implicated in the development of CVD as the former seems to be
atherogenic (it promotes the formation of fatty deposits in the arteries) while the latter is atheroprotective (it protects from atherosclerosis) where the arteries become blocked by fatty deposits (Viljoen & Wierzbecki, 2010). Dyslipidemia in diabetes is characterised as the pattern of having decreased HDL, increased LDL and triglycerides (TG) (fat in the blood), (Musunuru, 2010), and all three combine to be an independent risk factor of CVD (Manjunath, Rawal, Irani, & Madhu, 2013).
Targets for optimum lipid control in someone with diabetes should be total plasma cholesterol <4.5-mmol/L (~175 mg/dL) and LDL <2.5mmol/L (~100mg/dL), at least. Whilst no targets are set for HDL and TG, HDL concentrations in men <1.2mmol/L (~40mg/dL) and women <1.2mmol/L (~40mg/dL) and TG >1.7mmol/L (~150mg/dL) would be an indication of increased CVD risk (Graham et al., 2007).
1.8.3 Metabolic Syndrome
T2DM is connected with ‘metabolic syndrome’ – a set of cardiovascular risk factors, including hypertension, hyperinsulinemia (abnormal glucose tolerance), visceral abdominal adiposity, dyslipidaemia, and pro inflammatory states. These risk factors are inextricably linked and once combined in an individual, are
sometimes indistinguishable as distinct conditions. Each condition that is present in a person exponentially increases their risk of developing chronic heart disease and mortality (Ali et al., 2015).
1.9 Risk factors in developing diabetes
1.9.1 Obesity and Overweight
One of the most important and modifiable risk factors for developing T2DM is obesity. Obesity accounts for 80-85% of the overall risk for developing diabetes (Huner, 2015). Obesity is defined as an excess of adipose tissue or fat, to the extent that health may be impaired (World Health Organisation, 1999). This
abdomen. This central adiposity is seen as more serious than fat that is distributed more evenly around the body.
In fact, the relationship between diabetes and overweight also indicates that abdominal fat distribution is an independent risk factor for developing diabetes (Ohlson et al., 1985). This is because the presence of excess body fat seems to promote insulin resistance and prevent insulin secretion, or it can produce a pro-inflammatory chemical response that modulates insulin sensitivity (Shoelson, Herrero, & Naaz, 2007). It seems whichever mechanism body fat affects insulin, it is essential in metabolising glucose (Huner, 2015).
1.9.2 Preventing diabetes and its complications
Despite all these conditions being preventable, these complications have become so common that in the USA, only 14% of people with T2DM did not have a
comorbid condition (Suh, Choi, Plauschinat, Kwon, & Baron, 2010). Therefore, research has focused on the impact of diabetes, including understanding effective management, treatment and how to intervene earlier to minimise and reduce the complications of the condition (Hu, 2011; Lam & LeRoith, 2012). As mentioned previously, T2DM used to be more commonly associated with older adults. Therefore, much of the research into the pathophysiology i.e. how it affects the body, have focused on diabetes in older populations.
1.10 Older people with Diabetes
Older people are at an increased risk of diabetes as aging is associated with the gradual loss of glycemic control (Resnick, Harris, Brock, & Harris, 2000).
The link between aging and developing diabetes is thought to be more complex than originally thought. Research indicates there is a connection between how Alzheimer’s Disease (Dementia Alzheimer’s Type or DAT) and diabetes both progress in the brain, to the extent that there have been calls to rename DAT ‘Type 3 Diabetes’ (De la Monte & Wands, 2008). DAT can be considered akin to a metabolic condition, which shares many of the characteristics of diabetes: namely that insulin and IFG resistance and deficiency drive DAT, mimicking the development of diabetes (De la Monte & Tong, 2014). Furthermore, it has long been known that having diabetes is a risk factor for vascular dementia
(MacKnight, Rockwood, Awalt, & McDowell, 2002). This would indicate that insulin not only has endocrine implications in the body, but that it has a significant impact on the brain and its functioning (Cholerton, Baker, & Craft, 2013).
Therefore, another dimension that should be considered in diabetes is cognitive function.
1.11 Cognitive Function
Cognitive function is a term that refers to the ability to think, remember and process information. In diabetes, one way cognition may be affected is because the functioning of the brain relies on a healthy blood supply. As diabetes is
characterised by higher blood glucose, the ‘blood quality’ may be compromised if the diabetes is not well controlled.
We can measure the extent to which we are functioning cognitively in several ways, but most often this is measured by neuropsychological assessments. There are several domains that can be assessed in neuropsychology, but there are certain areas that are seen as more important to assess in people with conditions such as diabetes.
1.11.1 Processing Speed
neurons have the highest energy demand and require constant delivery of glucose via the blood, the processing power is determined by this energy supply (Howarth, Gleeson, & Attwell, 2012). Research over the last 15 years into
diabetes has shown that in terms of cognitive impairment, processing speed is most typically affected by the presence of T2DM (Stewart & Liolitsa, 1999; Awad, Gagnon, & Messier, 2004; Manschot et al., 2006), although there is some
suggestion that vascular complications e.g. heart failure, or smoking status mediate this association (Arvanitakis, Wilson, Li, Aggarwal, & Bennet, 2006).
1.11.2 Attention
Attention is our ability to focus on information, as well as divide and sustain it, often involving mental manipulation and being impervious to distraction from external stimuli. There is no test that measures attention in itself but it is regarded as a building block for other cognitive skills, so it is a necessary thing to measure as a foundation for all cognitive skills (Hebben & Milberg, 2009). Some studies have indicated that attention can be compromised in people with T2DM
(Manschot et al., 2006), although other more longitudinal research into the effects of diabetes on attention did not find a direct association between T2DM and attention (Degen, Toro, Schönknecht, Sattler, & Schröder, 2016).
1.11.3 Executive Function
Executive function (EF) is ability to take in information, hold it in mind and do something with it, and it is connected to self-control and regulation. EF also compromises other domains such as inhibition, regulation, working memory and switching between tasks. Meta-analyses assessing the impact of T2DM on EF in older or middle age populations have found EF significantly lower in people with diabetes compared to non-diabetic controls (Vincent & Hall, 2015). This
relationship between EF and T2DM has been observed in both Eastern and Western populations that are 65 and older, but also that cognition overall was compromised compared to non-diabetic controls (Zhao et al., 2015).
1.11.4 Memory
alongside other cognitive domains, verbal memory was most impacted in people with diabetes compared to non-diabetic controls. A cross-sectional sample of older adults without dementia found that deficits in semantic memory (and processing speed) were also associated with the presence of diabetes
(Arvanitakis et al., 2006). However, in other research using a control group, a significant difference was not found for memory once presence of hypertension was controlled for (Van Harten et al., 2007). More recently, research into which memory processes are affected by diabetes has shown that explicit memory (e.g. consciously remembering previous experiences) is most compromised in people with T2DM compared to cognitively normal older adults (Redondo, Beltrán-Brotóns, Reales, & Ballesteros, 2015).
1.12 Factors contributing to Cognitive Function
1.12.1 Premorbid functioning
Usually, information about a person’s cognitive function is not available before they develop a condition or an injury. Skills such as vocabulary and word reading correlate highly with general level of ability and are hypothesised to remain intact after an illness develops in some neurological conditions. Therefore, premorbid functioning estimates the optimal ability of someone before the onset of illness (Hebben & Milberg, 2009). In the context of diabetes, very little information is available in the literature about T2DM and premorbid functioning, One study that specified in the title that its focus was premorbid functioning did not use any measures to assess it (Wong, Scholey, & Howe, 2014), and others were small scale samples (N=<40) which found no differences between middle aged and older people with T2DM and a control group (Cosway, Strachan, Dougall, Frier, & Deary, 2001; Asimakopoulou, Hampson, & Morrish, 2002). Therefore, there is very little literature available about optimal ability and people with T2DM.
1.12.2 Mood and Anxiety
2006). Although depression is thought to be more common in people with
diabetes (Fisher et al., 2008), having diabetes is associated with the development of other affective disorders, such as anxiety (Kruse, Schmitz, & Thefeld, 2003). Indeed, self-report research of people with diabetes has put the estimated
prevalence of anxiety symptoms as double that of the general population (Collins, Corcoran, & Perry, 2009).
Developing mental health problems whilst having diabetes has been linked to the treatment burden of the condition, both psychological and physical, as the
treatment regime relies heavily on strict self-management. Experiencing
comorbid depression and diabetes is also associated with higher use of health services and entails increased cost (Egede, Zheng, & Simpson, 2002).
Furthermore, the relationship between depression and diabetes control is thought to be bi-directional, with one impacting the other in a vicious cycle (Adriaanse & Pouwer, 2016). Despite this understanding, the process of how they come to affect each other in neurological terms is yet to be disentangled.
1.13 Correlates of Cognitive Function in Diabetes
Whilst there is extensive research into how T2DM affects the brain, there are no definitive neurological areas that are always affected by it. This is most likely due to the fact that firstly, the pathophysiology of the condition is still not well
understood in this context (Kodl & Seaquist, 2008); and secondly, it may be in part due to T2DM being a syndrome rather than an established set of symptoms that can vary widely from person to person. Therefore, it is useful to summarise what is understood by considering relevant clinical markers in diabetes and their potential relationship to cognition:
1.13.1 Cognition and Hba1c
found that the ratio of Hba1c to Glycated Albumin (GA) was negatively correlated with cognitive function in a non-diabetic population.
Research into memory and diabetes in older adults has found that whilst diabetes can accelerate memory loss, a higher Hba1c in people without diabetes can also predict memory decline (Marden, Mayeda, Tchetgen, Kawachi, & Glymour, 2017). However, despite the large sample size of nearly 9000 older adults, the test of memory selected – the Informant Questionnaire for Cognitive Decline - was not typically used in neuropsychology and therefore, cannot be compared to other tests in a meta analyses, nor directly to Western constructs of tests of memory e.g. Wechsler Memory Scale.
As with much of the research in the area, the conclusions drawn rely on crude means of measuring cognition typically used by psychiatrists, such as the Mini Mental State Examination (MMSE) and the Montreal Cognitive Assessment (MoCA). Brief screenings for dementia such as the MMSE, are not widely considered as suitable to sensitively measure cognitive defects (Tombaugh & Mcintyre, 1992). It would seem there are some methodological issues with existing research into diabetes that are yet to be addressed.
1.13.2 Cognition and hypertension
As around 2/3 of people with T2DM also have hypertension (Suh et al., 2009), it has not always been easy to establish hypertension as an independent risk factor for cognitive decline. In a systematic review of evidence into hypertension, Van den Berg, Kloppenborg, Kessels, Kappelle, & Biessels (2009), found that high blood pressure was associated with a poorer cognitive performance in seven out of 11 cross-sectional studies and ten out of 13 studies. Interestingly, some studies also found an inverse U-relationship with low and high blood pressure impacting negatively on cognitive performance. According to the review, the domains affected by hypertension in order of most to least were memory,
Although using medication to treat hypertension has been associated with improved cognitive function (Guo et al., 1999), a Cochrane review found that treating people for hypertension does not protect against cognitive impairment or dementia in later life (McGuinness, Todd, Passmore, & Bullock, 2009).
Subsequent studies have found that hypertensive medication could be protective against vascular dementia and other types of dementia, other than DAT (Chang-Quan et al., 2011), although they lack the methodological robustness of a
Cochrane review. However, the relationship between hypertension and cognitive decline is still not well understood (Liou et al., 2015). This is possibly explained by the variation used in instruments of measurement e.g. parameters of
hypertension diagnosis or cognitive assessment tools chosen.
1.13.3 Cognition and cardiovascular risk factors
Cardiovascular risk factors refer to smoking, hypertension, and diabetes, that seem to mediate the development of cardiovascular conditions e.g. CVD, stroke, ischemic heart attack and so on. Over a period of eight years in a community sample, Anstey, Sargent-Cox, Garde, Cherbuin and Butterworth (2014) found that considered collectively, these risk factors were associated with cognitive decline, and specifically with processing speed, which has already been implicated as a domain that may be affected in diabetes.
A recent meta-analysis has used the data from 19 different studies, involving 54,000 participants, and used cardiovascular risk factors to compute an overall composite cardiovascular risk score. This score was highly correlated with lower cognitive test performance and was deemed to be a useful as a predictive measure of cognitive functioning (DeRight, Jorgensen, & Cabral, 2015).
1.13.4 Cognition and High Cholesterol
High cholesterol in middle age has been found to have a deleterious affect on cognitive function in later life (Whitmer, Sidney, Selby, Johnston, & Yaffe, 2005). However, as people get older, the relationship between high levels of cholesterol and cognition is not clear. The majority of research indicates there is no
association between cognitive impairment and cholesterol in older people
lack of relationship between cognition and lipids in older people may be because of existing vascular pathologies in this population (Ancelin et al., 2014). More recently, this lipid-cognition relationship has been explored in Chinese
populations, and it was concluded that high cholesterol was associated with faster global cognitive decline in older people (Ma et al., 2017).
1.13.5 Cognition and obesity
Early research had indicated that the relationship between obesity and cognitive decline, particularly dementia, was unclear. There is some evidence to suggest that as with hypertension, a u-shaped association has been found between BMI status and dementia, specifically being underweight or overweight – that both are risk factors for developing dementia (Beydoun, Beydoun, & Wang, 2008).
Furthermore, when controlling for other dimensions of metabolic syndrome e.g. impaired fasting glucose, hypertension and dyslipidemia, obesity seems to be an independent risk factor for the development of DAT. Indeed, over a 10-year period examining the connection between metabolic status and BMI, individuals with obesity who were otherwise metabolically healthy showed a similar rate of cognitive decline to their metabolically disturbed counterparts, with an
acceleration of cognitive decline associated with increasing BMI (Singh-Manoux et al., 2012). The association between obesity and cognition is also seen in later older age, with waist circumference being positively correlated with poorer cognition in elderly women (West et al., 2016).
1.14 Diabetes and CNS Neuropathology
1.14.1 Structural Changes
There are certain areas of the brain and structural changes that are typically affected in diabetes. For example, research has found a relationship between diabetes and a reduction in grey matter density, changes in white matter, atrophy, and brain volume loss (Seaquist, 2010; Erus et al., 2015). However, these are general changes that are usually secondary to primary problems, and so making a direct causal link between diabetes and these structural changes is difficult because of the confounding aspects of the comorbid conditions of diabetes. Manschot et al. (2006) found that people with T2DM showed cognitive
impairment and structural changes, including increased brain atrophy – e.g. brain wasting, compared to people that did not have diabetes. They hypothesise that these cognitive deficits were related to these structural changes in the brain, most likely due to vascular problems and/or cognitive aging. Later research has also implicated brain atrophy as a mediating factor in developing cognitive impairment in T2DM, rather than cerebrovascular lesions (Moran et al., 2013). Therefore, it is still unclear as to how brain structure interacts with cognition and diabetes.
1.14.2 Glucose
There is still some uncertainty as to where in the brain may be affected by high levels of glucose, and therefore the skills or intelligence that it may impact. The brain uses about 20% of all sugar energy in the body, despite only
1.15 Effects of cognitive decline in managing Diabetes
To effectively manage diabetes, one is required to employ a rigorous self-management program (Peel, Douglas, & Lawton, 2007). A daily regime may include medication, injections, carbohydrate counting, daily blood glucose monitoring, and exercise, although this list is not exhaustive. In order to comprehend why one would need to employ such a regime, requires a basic understanding of the condition. Furthermore, to cope with the multiple
components of managing diabetes requires patients to be cognitively intact to a sufficient level. In people that have had the condition a long time, this is even more important because of the complication risks associated with increased duration of illness (Hewitt, Smeeth, Chaturvedi, Bulpitt, & Fletcher, 2011).
1.15.1 Research into the impact of cognitive decline on managing diabetes The issue of the impact of cognitive impairment on diabetes self-management was highlighted over 15 years ago. Sinclair, Girling, & Bayer (2000) found that in older adults with T2DM who were cognitively impaired, patients employed worse self-management behaviours, needed more professional support and were more likely to have been admitted to hospital in the last 12 months, than those with intact cognition. There is thought to be some variation in the impact of cognitive impairment on daily living for people with diabetes and most of the evidence currently focuses on older adults. In younger adults, cognitive impairment could be linked to severe episodes of hyperglycaemia, but much of the evidence for which domains are affected is variable (Kodl & Seaquist, 2008). Therefore, it is difficult to ascertain what cognitive skill is most compromised by poorly controlled diabetes.
1.15.2 Cognitive domains that matter in diabetes management
increased risk of making mistakes when implementing these changes. There could be a similar issue with any problems in processing speed, as this requires ability to attend to information flexibly and within a given time frame, for example, at a clinic appointment. Finally, problems with attention could entail that a patient cannot focus wholly on the instructions they have been given. Whilst Munshi (2017) does not emphasise which of these domains is most important, there is an indication that each domain has implications in managing diabetes effectively. Of concern is that the relationship between cognitive dysfunction and well-controlled diabetes in older adults is bi-directional (Munshi et al. 2006): the more cognitively impaired one is, the worse your glycemic control tends to be, developing into a potential vicious cycle (Ojo & Brooke, 2015). This is one of several factors that may not be currently accounted for in typical diabetes management regimes. 1.16 Intersection of Diabetes, Cognition and Context
Within the epidemiology of diabetes, there has been a focus on individual risk factors and ascribing them to a resulting biological outcome, in a causal link. However, this can overlook some of the more social factors that can lead to the ‘fundamental causes’ of disease (Link & Phelan, 1995). The term fundamental in this context refers to factors that cannot be eliminated by a healthcare
intervention, such as low income or geographical location.
1.16.1 Diabetes and Poverty
better care continuity with these patients. Yet, disproportionately more resources were given to the higher SES clinic than the lower SES clinic, entailing worse diabetes management for the latter group.
More recently, the Commission on Social Determinants of Health (2008) has highlighted that many health outcomes are socially determined. In order to tackle these issues, they suggest the intervention should be focused not just on the biological risk factors of developing conditions but also at addressing these inequities. In a population study of Latinos in the United States with T2DM, Chaufan, Davis, & Constantino (2011) found that whilst participants were fully aware of what they needed to do to manage their diabetes (e.g. eating healthily, exercise and other diabetes-related treatment), they were prevented by doing so because of their ‘poverty trap’ and their circumstances were often precarious. Despite their personal efforts in attempting to ‘treat’ their diabetes, they were unlikely to succeed in their endeavours because of the structural inequities at play in their lives.
1.16.2 Cognition and Poverty
Research has also focused on the ways that being in a low SES group can further perpetuate poverty. One hypothesis proposed by Mani, Mullainathan, Shafir, & Zhao (2013) was that poverty requires a different process of thinking that is distinguishable from people who are affluent. Therefore, the mental resources required to think about financial management leave little capacity to think about anything else. In both laboratory and field tests, the authors
supported this claim and emphasised that being poor means having less cognitive capacity, in addition to having a lack of funds. They argue that their conclusion is not about poor people per se but about the people who find themselves in poverty.
Some attempts have also been made to explore the sequelae affected by
independently associated with lower processing speed. The authors concluded that improving SES would also improve some domains of cognitive functioning in older adults. Looking across the life span, in a cross sectional study, Latin
American children who did not have their basic needs met and those who did, were compared on performance in cognitive tests. It was indicated that those children who were in poverty showed a significantly lower performance in
executive function, namely working memory and word fluency, and also attention (Lipina et al., 2013). These environmental factors are important to consider, especially with the increased prevalence of physical health problems as a result of social and structural inequalities.
1.17 Young people with T2DM
Until recently, T1DM was considered the form of diabetes that children and young people were most likely to develop and diagnoses of other phenotypes was quite a rare phenomenon (Constantino et al., 2013). However, an epidemiological study in the last two years found the incidence of T2DM had been
underestimated and was now the most common type of diabetes in in young people aged 5-29 in some parts of the world (Ke, Sohal, Qian, Quan, & Khan, 2015).
a nationwide diabetes prevention program as they estimated that over 10% of people under 16 were at risk of developing T2DM (Public Health England, 2015).
One area where there seems to be more evidence regarding is in retinopathy in young onset T2DM. Research in the UK has found that developing T2DM in younger age, e.g. onset under 40, leads to aggressive retinopathy in around 80% of participants after 15 years, irrespective of the age of diagnosis (Song, 2016). Of concern was that this debilitating condition would affect people during their working years and that younger people may be at higher risk of developing other diabetes-related conditions (Pulgaron & Delamater, 2014). In the wider research community, there is an acknowledgement that it will take some time to better understand the pathogenesis and impact on services of younger onset T2DM (Constantino et al., 2013; Wilmot & Idris, 2014).
1.18 Rationale
Understanding diabetes and how it develops is of great importance in the world today, because of the multifaceted impact the condition has on health, economy and society at large. When the onset of T2DM is at a younger age, the comorbid conditions one can develop are thought to have a greater impact, such as
aggressive retinopathy. Young people will experience the debilitating effects of these conditions during a period in which they are expected to be most active.
is likely to complicate people’s ability to manage their diabetes, as it does in older adults (Sinclair et al., 2000).
If this relationship is found in younger adults, then cognitively impaired individuals may struggle with the diabetes treatment regime as currently recommended (National Institute for Health and Care Excellence, 2016b). To address this issue in older adults, there are adapted forms of treatment suggested for those affected cognitively (Kirkman et al., 2012) and younger adults could need their care
package adapted accordingly. In the instance that no cognitive impairment is observed in working age adults with T2DM, then this could indicate a crucial period in which interventions could ‘preserve’ cognitive functioning. There have also been suggestions for more routine screening for cognitive impairment in older adults as part of diabetes management (Sinclair et al., 2000; Cukierman, Gerstein, & Williamson, 2005), and this research could contribute toward similar conclusions for younger populations.
1.19 Aims and Research Questions:
There is an identified link between T2DM and cognitive impairment in later life and from middle age. However, it is unclear if this link will be observed in younger adults with T2DM, as current literature does not focus on this age range.
Therefore, this study aims to investigate the cognitive function of working age adults with T2DM aged 18-55. Using cognitive assessments, the questions I will pose are:
• Do working-age adults with T2DM show reduced cognitive function in scores from a battery of neuropsychological measures, compared to the established norms of cognitive tests?
• As existing literature in the field has tended to neglect the formal
assessment of premorbid functioning, do working-age adults with T2DM exhibit reduce cognitive function to their own optimal/premorbid ability level?
• If cognitive impairment is observed, to what extent is this related to health indicators related to diabetes, specifically Hba1c and lipid profile?
2. METHODOLOGY
2.1 Epistemology
Epistemology is defined as the study of how we have acquired knowledge and view the world as we do. All types of research attempt to investigate and evaluate aspects of the world. Therefore, in order to conduct research, one has to adopt an epistemological position. Hamlyn (1970) outlines four epistemological positions: correspondence theory – which states a belief is true if it matches reality; coherence theory – a belief is true if it is logical and internally consistent; consensus criterion – something is true if a group of people hold it; and the pragmatist criterion – a belief should be upheld if it is useful. I will outline positions akin to these in more detail:
2.1.1 Positivism
Scientific and quantitative research has tended to adopt a positivist approach that purports the world has properties, which are observable and measurable, via sensory phenomenon. This empirical approach – that knowledge is derived from the abstraction of mental states – has led to the assumption that science is objective and free from values (Barker, Pistrang, & Elliott, 2002). This approach has been widely critiqued in social sciences, for obscuring contextual factors, which lead us to generate certain conclusions and privilege types of knowledge over others.
2.1.2 Critical Realism
The critical realist point of view evolved from a correspondence theory
perspective and was developed to answer the question of whether society could be studied as nature is (Bhaskhar, 1998). This view assumes the world exists independently of what we think about it, and secondly, our knowledge could be fallible about it, and so we cannot be certain about our conclusions. Whilst elements of this approach are appealing, this approach values knowledge to a greater degree than is necessary and in my view, does not privilege the
2.1.3 Pragmatism
There is no singular definition of pragmatism (Lipscomb, 2011). However, the type of pragmatism I adopt, views ideas such as ‘truth’ and ‘reality’ as normative; therefore, we can never be sure that what we observe and the conclusions we make are not influenced by our values or accurately reflect the world around us (Zaccharadis, Scott, & Barrett, 2010). It also allows research to be conducted using a rigorous methodology, with the ‘what works’ philosophy (Howe, 1998). This commitment to certain views and practices (rather than knowledge)
compliments my own perspective of neuropsychology, and allows me to measure aspects of these beliefs in order to progress.
2.1.4 Neuropsychology
Like positivism, neuropsychology also privileges certain knowledge, specifically examining the relationship between behaviour and brain function. Originating out of single case studies used in medicine, its birth is located back to 1861, when Broca identified an area of the brain associated with a speech difficulty in an individual (Luria, 1973). Whilst these idiographic methods are less favoured nowadays, nomothetic approaches that look at groups of individuals are
preferred. However, within a framework of falsification, idiographic or individual cases are still used as counter examples to existing theory in a certain domain. In these instances, having a contextual understanding of these counter examples to existing theory can be essential to understanding ‘what works’.
2.1.5 My position
In summary, pragmatists conduct research in relation to their personal value system (Teddlie, 2005). I believe finding out if people with diabetes are being overloaded by their treatment, is of value. Through my clinical work, I have seen how difficult diabetes can be to manage, and how people get treated when they cannot manage their diabetes. I had always wondered whether there was something that was being missed from their care; perhaps understanding
use ‘what works’ to investigate it, being mindful this is both a local and Western position and may not be equivalent across all cultures (Van de vijver & Poortinga, 1997; Fernandez & Marcopulos, 2008)
2.2 Design
The study employs a cross-sectional correlation design, which looks at the relationship between cognitive impairment (dependent variable) in a population who has T2DM, and relates it with a number of independent variables: diabetes status (comparing the sample to existing norms), premorbid functioning, diabetes control (Hba1c – continuous) and diabetes-related factors (age, duration of diabetes, education level and lipid profile). In the diabetes context, ‘cognitive function’ alleges four main domains: processing speed, memory, attention and executive function. This design also allows one particular group to be compared to other participants for tests of reliability and difference.
2.2.1 Control group
Initially, there was a plan to include a control group with live-in or home controls e.g. spouse or house mate to do cognitive testing, which would enable
comparison to the test population. This would offer a more robust way to examine cognitive performance of people with diabetes in contrast to people without. However, due to a delay in getting ethical approval, this was not practically possible. As such, the decision was made to use the established age-specific norms reported for each test as a comparison. In addition, the
population-distributed scores were compared to the putative norms from the subtests in the battery. This approach was taken due to the time and resources available.
2.3 Recruitment
multi disciplinary team approach to Diabetes management including nurse
specialists, diabetes and endocrinology consultants, podiatrists, dieteticians, and psychologists.
2.3.1 Eligibility Criteria
People with a diagnosis of T2DM can also have several other physical health issues, psychological difficulties and comorbidities. These factors can impact on several areas of functioning, including cognitive capacity. As such, eligibility for the study was informed by existing knowledge from the literature review
regarding older adults, T2DM and cognitive impairment.
Whilst inclusion and exclusion criteria were established from the outset, a
potential participant’s recruitment to the study was decided on an individual basis and was partially informed by the referring clinicians’ knowledge of the patients characteristics.
Therefore, the criteria for selection for the study were:
2.3.1.1 T2DM diagnosis: participants were required to have a diagnosis of T2DM.
Patients at the unit could have either T1DM or T2DM. In addition, it is not always possible to distinguish between the two phenotypes of diabetes. If there was any ambiguity about this in patients at the recruitment stage, they were not contacted.
2.3.1.2 Demographic information: participants had to be adults aged 18-55, with
an understanding of written and spoken English. If patients were able to talk to their referring clinician and follow their written care plan without an interpreter – professional or family member - then they could be tested using the battery of measures.
2.3.1.3 Absence of diabetic complications: significant comorbidities would be
2.3.1.4 Medical comorbidities: People with diabetes present with a range of difficulties that can arise before or after developing the condition, some of which can affect cognitive functioning. For example, hypertension (high blood pressure) and cardiovascular disease are linked to cognitive impairment (Kilander, Nyman, Boberg, Hansson, & Lithell, 1998; Hassing et al., 2004; Gorelick et al., 2011). There has also been some controversial evidence to suggest that dyslipidemia (high levels of blood fat) is linked to Alzheimer’s and other dementias (Reitz, 2013; Moon, 2016), but this was not used to rule people out from recruitment. However, their lipid profile was recorded.
Should participants have comorbidity, their inclusion was considered on an individual basis. For example, if the patient had hypertension, the clinician’s view on whether it was well controlled e.g. managing their hypertension within the limits of recommended medical guidance (National Institute for Health and Care Excellence, 2016a) was taken into account before people were recruited.
2.3.1.5 Other conditions associated with cognitive impairment: participants with
muscular sclerosis (MS) were not eligible to participate in the study due to the widespread effects it can have on cognition. The areas of functioning that MS tends to effect are information processing, attention, long-term memory and executive function (Chiaravalloti & DeLuca, 2008) – the same areas we anticipated would be impacted in T2DM.
Secondly, we also liaised with clinicians if prospective participants had experienced a stroke, as there is an increased risk of cognitive impairment following one (Gorelick et al., 2011).
2.3.1.6 Mental Wellbeing: In neuropsychological assessment, there is little
to the treatment burden, both psychological and physical, of having diabetes, as the treatment regime relies heavily on strict self-management. On the back of this knowledge, routine questionnaires were given in the clinic to newly referred patients so information about the emotional wellbeing of patients was available. Therefore, any patient who was waiting for psychological assessment from the diabetes psychologist or was currently in treatment was discussed before being offered the chance to participate in research.
People with ‘severe mental illness’, who had received a diagnosis of bi-polar disorder or schizophrenia were also considered but assessed for possible confounding factors e.g. neuroleptic medication.
2.3.2 Recruitment Process
Using the above criteria, eligible participants were identified by the clinician of the service, by checking the patient information system database of patients who were attending clinic that week. Initially, potential participants were approached in the waiting room. However, this was not successful for two reasons: one, I had no advice from their clinician if they were suitable and two, patients experienced this as stressful.
Therefore, we agreed a record would be kept of which patients were eligible to participate from a clinician’s diary, and clinicians would be contacted two days before their appointment to ask 1) would they be suitable and 2) if so, would that patient mind being called about participating in research. If patients said yes to being contacted, participants were offered an information sheet (see Appendix A) at their appointment. This approach was much more successful and all
participants were recruited in this manner.
2.4 Sample Size
A power calculation was computed for the study in question. If the effect size was 0.8 in a study with two types of predictor e.g. T2DM and cognitive impairment, and, a sample size of 10, a power calculation using G-power indicates a level of 0.32, which is particularly small, indicating just over a 30% chance of detecting an effect if one exists. Whilst this sample size is tied to time and resources, previous studies in this area have adopted similar sized samples. For example, Zhil, Schaaf and Zillmer (2010) who investigated the relationship between
neuropsychological profiles of T1DM and T2DM and hypoglycaemic control used a sample size of 12 for their treatment arm for T2DM. Baker et al., 2011 also used similar sample sizes, comparing a group of older adults with high blood sugar (N=11) to those with a diagnosis of diabetes (N=12). In addition, a high statistical power does not necessarily imply credibility of results (Sullivan and Feinn, 2012). However, it is emphasised that the study was exploratory in nature and so results will be interpreted with caution.
2.5 Ethical Issues
2.5.1 Ethical Approval
Ethical approval was obtained from NHS Northumberland Ethics Committee, with provisional approval initially (see Appendix B). Once I had made the agreed changes with an accompanying letter (see Appendix C), I received a favourable opinion (see Appendix D). Following HRA approval (see Appendix E), the Research and Development Department for the Hospital awarded the study access to its patients (see Appendix F).
2.5.2 Confidentiality & Anonymity
Record sheets were numbered to maintain anonymity, and the researcher kept a copy of the names of participants separately, which was password-protected, on an encrypted server. Following testing, all tests were scanned and stored
digitally, individually password-protected and hard copies were destroyed.
All aspects of testing remained confidential unless there were concerns about a participant’s safety or that of others. In the instance where concerns arose, supervisors were contacted, as were other relevant professionals. All of these steps were discussed with the participant before proceeding.
The researcher had access to participants’ medical history via their referring clinician and the relevant electronic record (e.g. EMIS), with supervision.
2.5.3 Informed Consent
Participants were given an information sheet (if not already received) to read before signing a consent form (Appendix G). Participants were given an
opportunity to ask questions and were encouraged to do so throughout. Testing only began when consent forms were signed. Participants were given the right to withdraw at any time.
2.5.4 Harm Minimisation
A comfort break was offered part way through the session and participants were made aware of this at the beginning of testing. This is to minimise the fatigue that can be experienced when completing neuropsychological tests. Participants were monitored and asked how they were experiencing the tests over the duration of their assessment. At the test completion, participants were asked if they had any concerns about taking part or their performance.
2.6 Procedure
Initially, demographic information was obtained from participants, including DOB and ethnicity. Next, a short medical history was taken, which included questions about head injury, stroke, MS and kidney problems.
Following this, the battery of neuropsychological tests was administered. The interview protocol was adhered to for each participant (see Appendix J). Once testing was completed, participants were debriefed verbally and given a written debrief sheet including sources of support e.g. Diabetes UK (Appendix K).
Following analysis of their assessment, each participant was sent a written summary of their relative strengths and weaknesses, recommendations for their future care, and an appendices of their scores (should they wish to be or were recommended to be re-tested in the future). As agreed with participants, a copy was sent to their Diabetes clinician. This summary also gave contact details for the researcher and for their relevant professional at the service, should they want to discuss their results.
Relevant medical values regarding their diabetes were also recorded, although this was done via the patient information system with the patient’s permission: duration of diabetes, diabetes control e.g. Hba1c and Lipid Profile. A blank copy of the record form is available in the appendices (see Appendix L).
2.7 Materials
2.7.1 Optimal Ability
It is important to estimate the optimal ability or premorbid functioning in neuropsychology as a baseline by which to measure any form of cognitive impairment (Hebben & Milberg, 2009). In order to do this, the Test of Premorbid Functioning (TOPF) (Wechsler, 2011) was used. This assesses reading ability by presenting the subject with 70 irregularly spelled words, which they are asked to pronounce. The irregular grapheme-to-phoneme require previous knowledge of the word in order to read them, for example, the silent ‘b’ in plumb. In addition, the TOPF has been validated and co-normed with the Wechsler Adult Intelligence Scale-IV (Wechsler, 2008) and Wechsler Memory Scale-III (Wechsler, 2009). As highlighted in the earlier literature review, this study deemed assessment of optimal ability as equally important as other domains of cognitive functioning, especially as so few studies in the existing literature assessed optimal ability (Cosway et al., 2001).
2.7.2 Verbal Attention
Subtests from the WAIS-IV (Wechsler, 2008) were used to assess verbal attention.
2.7.2.1 WAIS-IV digit span forward: Digit span forward is a measure of verbal
short-term stores (STS). It presents numbers orally, in a string of two to nine and asks participants to repeat them immediately back to the examiner.
2.7.2.2 WAIS-IV digit span backward: measures STS plus the ability to
manipulate information. A string of two to nine numbers is presented and participants are asked to repeat them back to the examiner in reverse order.
2.7.2.3 WAIS-IV digit span sequencing: measures STS and the ability to control