2017 2nd International Conference on Information Technology and Management Engineering (ITME 2017) ISBN: 978-1-60595-415-8
An Adaptive Background Adjusting Algorithm for Rail Surface
Defect Image Segmentation
Biao YUE
1, Yong-zhi MIN
1,*and Hong-feng MA
21
School of Automation and Electrical Engineering, Lanzhou Jiao tong University, Lanzhou, China
2
School of Electronical Information Engineering, Lanzhou Institute of Technology University, Lanzhou, China
*Corresponding author
Keywords: Rail surface defect, Similarity, Adaptive window, Image segmentation.
Abstract. Aiming at the problem of false segmentation caused by the change of illumination and properties of surface reflection when extracting rail surface defects, this paper proposes an adaptive background adjusting algorithm for rail surface defect image segmentation based on the background subtraction method. Firstly, a new similarity measure is proposed by combining Coefficient of Variation (CV) of the pixel gray level with the non-local normalization factor in the image. Secondly, by adjusting the size of window for neighborhood averaging adaptively according to the similarity measurement results, the background image model is established. Finally, the image subtraction operation is made and the segmentation of rail surface defect is realized by setting up dynamic threshold value for the differential image. The experimental results show that this method has a good effect on segmentation of both block and linear defects distributed discretely in the image.
Introduction
With the rapid development of railway transportation in China, the increasing traffic density and load capacity aggravate the deterioration of the rail surface. At the same time, the operating mileage is also constantly expanding, which puts forward a new problem for railway line detection of short period. Therefore, as a non-contact, high speed detection technology of rail surface defects, machine vision technology has been widely used in the detection of rail surface defects[1]. In the detection of rail surface defects, discrete defect detection[2] is the difficulty of machine vision because: (1) Discrete defects have no periodicity and texture characteristics (2) The uneven illumination and the reflection characteristic of the rail surface can result in uneven distribution of the image gray level.
In view of the above problems, this paper proposes an adaptive background adjusting algorithm for rail surface defect image segmentation. Firstly, in order to distinguish the region with different features, a new similarity measure method is proposed by using local and non-local information of image. Then the size of window for neighborhood averaging is adjusted adaptively according to the similarity measurement results, by smoothing the defect region in the rail image with larger scale, while shadow region caused by the uneven illumination with smaller scale, the background image model is established adaptively and image subtraction operation is made. Finally, the segmentation of rail surface defect is realized by setting up dynamic threshold value for the differential image.
Defect Segmentation Algorithm for Rail Surface Defects
Image Characteristics Analysis of Rail Surface Defects
image contains three parts: defect area R1, normal rail surface area R2 and shadow area R3, The CV
(discrete degree) of pixel gray level in defect area and boundary of shadow area is larger than that of in normal rail area. And in the boundary of shadow area, the change process of pixel gray level is relatively gentle and there is no obvious ridge line. In defect area, the gray level changes drastically.
100 200 300 0
50 100 150 200 250
T
h
e
v
al
u
e
o
f
p
ix
el
v
al
u
e
The number of columns(c)
A B
100 200 300
0 5 10 15 20 25 30 35
T
h
e
v
al
u
e
o
f
C
V
The number of columns(c) A B
[image:2.612.166.471.128.220.2](a) Rail image (b) Gray distribution curve (c) Distribution curve of CV
Figure 1. Actual rail image and gray, CV distribution curve of line A, B.
Figure 2. Classification figure of CV.
Description of Defect Segmentation Algorithm for Rail Surface Defects
Through the above analysis. Firstly, the rail surface region in the original image is extracted and preprocessed[3]. Secondly, by calculating the local discrete degree, defect area and boundary of shadow area can be separate from the whole image, and a new similarity measure is proposed by combining CV of the pixel gray level with the non-local normalization factor to further distinguish these two parts. Then, according to the similarity measurement results, the size of window for neighborhood averaging is adjusted adaptively and by which the background image model is established. Finally, image subtraction operation is made, and by setting up dynamic threshold value for the differential image, the segmentation of rail surface defect is realized.
1) Similarity measure combined local and non-local information a) Coefficient of Variation
For any pixel i in the image, its CV of the pixel gray level in the 8 neighborhood is calculated as:
CV( ) =
( x, y)
i
Avg F
σ
(1)
where Fx y, is the set of pixels in the 8 neighborhood of pixel i, σ andAvg F( x,y)are standard
deviation and gray mean value of the pixels in setFx y, respectively. By the above calculation,
classification figure of CV is shown in Figure 2. b) Non-local normalization factor
Considering that regarding Coefficient of Variation as the key feature to distinguish the different regions, only local statistics information of image are used, the boundary of shadow area and defect area still cannot be effectively distinguished. Therefore, the normalized factor in non-local mean denoising algorithm[4] is used to further distinguish these two parts, which can be calculated as:
2
Ω
( ) exp( ( , ) )
j
z i d i j h
∈
[image:2.612.275.339.244.344.2]where i and jrepresent any pixel in the image, Ω is the square search area that make pixel i as the center, d i j( , ) represent Euclidean distance[5] between pixel i and j ,h is smoothing parameter used to control attenuation rate of the exponential function. Due to the value ofz i( )is a constant in a specific search area, it can be used to measure the overall similarity among pixels in the search area. And the smaller the z i( )is, the higher degree of similarity among pixels in the search area.
When distinguishing defect area and the boundary of shadow area in the rail image, both CV and ( )
z i play an important role. In this paper, the parameter K is introduced to adjust the weight between CV andz i( ), and the new similarity measure is proposed as:
2
2 2
Ω
2
CV( )
( ) ( )
S S
i n
i
z i
λ i ∈ K
= +
∑
. (3)
where CV( )i and ( )z i are Coefficient of Variation of pixel i and non-local normalization factor of search area Ωrespectively, and S represents the window size of search area.
2) Adaptive background modeling and image difference
In order to establish accurate background image model, multi-scale processing is needed to deal with background image for region with different features. That is, smoothing defect area in the rail image with larger scale while shadow area caused by the uneven illumination with smaller scale, and maintaining normal rail surface area. Using fuzzy characteristic of mean filter, and combining the measurement of similarity in region with different features mentioned in last section, the size of neighborhood window for neighborhood averaging can be calculated as:
min max min
max min max min
max min max min
max min max
1
3 3 ( ) ( 3 )
4
1 1
5 5 ( 3 ) ( ) ( )
4 2
( )
1 1
( ) ( ) ( 3 )
7 7
2 4
1
( 3 ) ( )
9 9 4
n
n
n
n λ λ i λ λ
λ λ λ i λ λ
width i
λ λ λ i λ λ
λ λ λ i λ
×
≤ < +
× + ≤ < +
=
× + ≤ < +
× + ≤ ≤
. (4)
whereλmaxandλminrepresent the maximum and minimum value of λn( )i in rail image. By adjusting the size of window for neighborhood averaging adaptively, background image model is established, and the difference image between original imagef x y( , )and background image is obtained as:
∆f x y( , )= f x y( , ) mean( ( , ))− f x y . (5) where mean( )represents the mean function andmean( ( , ))f x y represents background image, In order to realize segmentation of the defect, the threshold for the difference image can be set as:
∆( , )
1 ∆ ( , )
( , )
0 else
f x y B
f x y T βσ
f x y = > =
. (6)
where βis control parameter,σ∆f x y( , )is the standard deviation of the difference image, and fB( , )x y represents binary image after threshold segmentation.
Experiment and Analysis of Parameter
p re
p p
T P
T F
=
+ . (7)
p ec
p n
T R
T F
=
+ . (8)
[image:4.612.198.414.188.223.2]where Tp,Fp andFn is the number of defect images detected correctly, misclassified as defects and undetected respectively. The precision and recall rate are shown in table 1.
Table 1. Performance indexes of rail surface defects detection.
Defect type Precision rate /% Recall rate /%
Block defect 83.17 96.43
Linear defect 78.54 90.68
Parameter Analysis
The parameter K is used to adjust the weight of Coefficient of Variation (CV) and non-local normalization factorz i( ) . The experimental results show that if K∈ [10 20], the defect segmentation effect is better. When setting different control parametersβ, the result of the recall rate and precision rate is shown in Figure 4. As can be seen from the figure, when βtakes 2, both the recall rate and precision rate are higher.
0 1 2 3 4 5
0.2 0.4 0.6 0.8 1.0
T
h
e
re
ca
ll
a
n
d
p
re
ci
si
o
n
Parameter Rec Pre
β
Figure 3. Chart of experiment equipment. Figure 4. Recall rate and the precision rate for differentβvalues.
Experimental Results
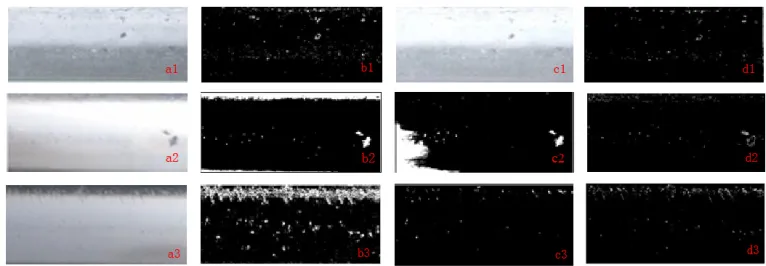
[image:4.612.112.495.534.667.2]Aiming at effects of shadow and illumination variation on segmentation, corresponding experiments are done in this paper, experimental parameter K=15, β=2. Figure 5 (a1) and (c1) are two rail defect images under different illumination conditions respectively, due to the adaptive background image model is established in this paper, the segmentation result is almost not affected by changes of light, as shown in (b1) and (d1).
Figure 5. Segmentation results under the condition of illumination variation and comparison with other method.
experimental results can be seen, Due to OSTU method divides the image into foreground and background by calculating the optimal threshold value, the ratio of the foreground and background will quite different when the distribution of defect is sparse in the image, so it is difficult to guarantee the accuracy of the segmentation. BGD method establishes the background image model with mean of gray level in each row, some shadow regions with irregular shape in the rail image caused by uneven illumination are often misclassified as defects, and it is difficult to detect the linear defects like (a3). Compared with these two methods, the algorithm proposed in this paper has a better effect on the segmentation of the two kinds of defects, due to the algorithm establishes adaptive background image model, it has good robustness to the shadow area caused by uneven illumination.
Conclusion
In this paper, an adaptive background adjusting algorithm for rail surface defect image segmentation is proposed. Firstly, the gray features of different region in rail defect image are analyzed, and a new similarity measurement method is proposed based on the local statistical information and the non-local similarity information of the image. Secondly, neighborhood average is made by adaptively adjusting the size of neighborhood window according to the measurement results in region with different features, then the background image model is established and image subtraction operation is made. Finally, the segmentation of rail surface defect is realized by setting up dynamic threshold value for the differential image.
In this paper, we only study the segmentation method of rail surface defects, and further work, we need to design a defect classifier to classify and identify the defects.
Acknowledgment
This research was financially supported by The National Natural Science Fund (Grant No. 61663022 and No. 61461023) and The Open Subject of Key Laboratory of high altitude traffic information engineering and control in Gansu Province (Grant No.20161105).
References
[1] Li Q Y, Zhang H Y, Ren S W, et al. Detection Method for Rail Corrugation Based on Rail Image Feature in Frequency Domain[J]. China Railway Science, 2016, 37(01): 24-30.
[2] Yuan X C, Wu L S, Cheng H W. Improved Image Preprocessing Algorithm for Rail Surface Defects Detection[J]. Journal of Computer-Aided Design & Computer Graphics, 2014, 26(5): 800-805.
[3] Li Q, Ren S. A Visual Detection System for Rail Surface Defects[J]. IEEE Transactions on Systems, Man, and Cybernetics, Part C (Applications and Reviews). 2012, 42(6): 1531-1542.
[4] Hao H X, Li F, Jiao L C, et al. A Non-Local Means Algorithm for Image Denoising Using Structure Adaptive Window [J]. Journal of Xian Jiaotong University, 2013, 47(12): 71-76.
[5] Shan J H. Non-local means denoising algorithm with enhanced weight function [J]. Journal of Image and Graphics, 2012, 17(10): 1227-1231.
[6] He Z D, Wang Y N, Liu J, et al. Background differencing-based high-speed rail surface defect image segmentation [J]. Chinese Journal of Scientific Instrument. 2016, 37(3): 640-649.