This is the pre-peer reviewed version of the following article: Kubiak, K. J., Wilson, M. C. T., Mathia, T. G. and Carras, S. (2011), Dynamics of contact line
Dynamics of contact line motion during the wetting of rough surfaces
and correlation with topographical surface parameters
K.J. Kubiak
*1, M.C.T. Wilson
1, T.G. Mathia
2, S. Carras
3*
[email protected]
1
Institute of Engineering Thermofluids Surfaces and Interfaces, School of Mechanical Engineering - University of Leeds, Leeds LS2 9JT, United Kingdom
2Laboratoire de Tribologie et Dynamique des Systèmes, CNRS UMR 5513, Ecole Centrale de Lyon, 36 Avenue Guy de
Collongue, 69134 Ecully,- France
3ALTIMET SAS 1, bis Av. des Tilleuls, 74200 Thonon-le bains, France
Summary:
Dynamics of contact line motion and wettability is essential in many industrial applications like liquid coating, lubrication, printing, painting, condensation etc. However, the wettability of surfaces depends not only on liquid-solid chemical properties, but can be strongly affected by surface roughness. As a practical application of controlled wettability, we can mention the self-cleaning surfaces, protective clothing, microfluidics devices, electro wetting… In this paper we experimentally investigate the spreading of droplets deposited onto rough surfaces. Anisotropic surfaces were prepared by abrasive polishing on the following materials: aluminium alloy AA7064, titanium alloy Ti-6Al-4V, steel AISI 8630, copper alloy UNS C17000, machinable glass ceramic and poly-methylmethacrylate (PMMA). Topographical 2D parameters were calculated according to the following standards, defining Geometrical Product Specifications (GPS): ISO 4287, ISO 12085, ISO 13565, ISO 12780, ISO 12181. Influence of topographical parameters on wettability and spreading phenomenon has been evaluated by statistical covariance analysis. The following parameters have strong influence on fluid spreading on rough surface: Rmr - relative material ratio of the roughness profile, Trc - microgeometric material ratio, Pmr - relative material ratio of the raw profile, Kr - mean slope of the roughness motifs, RONt -peak to valley roundness deviation, Psk - Skewness of the raw profile. The physical meaning of selected parameters is discussed, and Kr (the mean slope of the roughness motifs) is selected as the most important and physically meaningful parameter. It has been found that for all tested materials, fluid spreading have increasing tendency, when mean slope of the roughness motifs (Kr) increase.
Keywords: Surface roughness, Wettability, Contact angle, Functional surfaces, Lubrication.
Nomenclature
2D Profile parameters
Ra(µm) arithmetic average of the roughness profile,
Kr(ratio) mean slope of the roughness motifs,
R (µm) mean depth of the roughness motifs, average of all Ri,
AR (µm) mean spacing of the roughness motifs,
Rmr(%) Relative Material Ratio of the roughness profile,
Trc (%) Microgeometric material ratio,
Pmr (%) Relative Material Ratio of the raw profile,
RONt (µm) Peak to valley roundness deviation,
RONp (µm) Peak to reference roundness deviation,
Psk (-) Skewness of the raw profile.
1 Introduction
Many industrial applications like lubrication, painting, liquid coating, spray quenching, soldering, jet-printing etc. involve wetting and spreading processes [Narayan-Prabhu et al. 2009, Duez et al. 2007]. These applications often employ high-technology materials and surface preparation to control properties related to wettability: adhesion, anticorrosion, lubrication, friction, wear resistance,
biocompatibility, catalysis, antifouling etc. [Roucoules et al 2002, Borruto et al. 1998, Genzer et al. 2006].
Wettability is usually quantified in terms of the apparent contact angle [de Gennes et al. 2004], which is the angle between the nominal solid surface and the liquid-air interface, measured through the liquid and at the point where the liquid-air interface meets the solid. Smaller contact angles correspond to greater wettability. The apparent contact angle can also be calculated from the height and surface radius of the droplet deposited onto a solid surface, assuming the droplet forms a certain shape such as a spherical cap. However, for real engineering surfaces, measured values of the contact angle usually differ from the expected equilibrium value. The difference can be attributed to surface non-uniformity, contact angle hysteresis, chemical heterogeneity and physical surface roughness.
This is the pre-peer reviewed version of the following article: Kubiak, K. J., Wilson, M. C. T., Mathia, T. G. and Carras, S. (2011), Dynamics of contact line surface structure are also key in developing superhydrophic
surfaces [Bico et al. 2001].
In modelling and understanding the effect of roughness, often the surface is approximated by sinusoidal profiles or constructions, e.g. [Cox 1983], or other regular features, e.g. [Hay et al. 2008, Hsaio et al. 2009]. Using profilometry of real engineering surfaces, [Kubiak et al. 2011] recently showed how standard surface characterisation parameters of real surfaces can be combined with the [Wenzel 1936] and [Cassie & Baxter 1944] models to predict the apparent static contact angle. This paper further explores the influence of real surface roughness on dynamic wetting and spreading phenomena, focusing on other surface parameters and illustrating the spreading behaviour by performing lattice Boltzmann simulations of droplets spreading on digitised versions of measured real surfaces.
2 Material and Methods
2.1 Experimental procedure
The experimental procedures presented here cover surface roughness preparation, measurements of surface morphologies by ALTISURF® 500 3D profilometer and contact angle measurements.
2.2 Tested materials
Selection of the materials was based on the different properties like surface energy, electric conductivity, type of material (metallic alloy, ceramic, polymer), mechanical properties (ductile, brittle and semi-brittle), so that contact line dynamics can be analysed for different materials. Rough surface morphologies were prepared on the following materials: 1) Aluminium alloy AA7064, 2) Titanium alloy Ti-6Al-4V, 3) Steel AISI 8630, 4) Copper alloy UNS C17000, 5) Ceramic made from fluorphlogopite mica in a borosilicate glass matrix, with chemical composition: 46% silicon (SiO2), 17% magnesium (MgO), 16% aluminium (Al2O3), 10% potassium (K2O), 7% boron (B2O3), 4% fluorine (F), (machinable glass ceramic), 6) Poly-methylmethacrylate (PMMA). All the selected materials are easily accessible materials commonly used in the manufacturing industry.
2.3 Surface Preparation
The tested surfaces were prepared by abrasive polishing. Materials were cut into small cubes (10mm x 10mm x 10mm), with one side polished first to a mirror finish and subsequently roughened using different grade sandpapers to produce a wide range of surface roughness: Ra =0.15-7.74 μm. All specimens were prepared following the same polishing procedure, however due to different material properties the obtained roughnesses varied for different materials. The polishing direction was the same for all specimens in order to prepare unidirectional, anisotropic, textured surfaces. Contact angle measurements were carried out shortly (within 2 hour) after surface preparation, to minimize any contamination. Before the test, all surfaces
[image:2.612.321.559.76.712.2]were ultrasonically cleaned for 5 min, with acetone and alcohol.
This is the pre-peer reviewed version of the following article: Kubiak, K. J., Wilson, M. C. T., Mathia, T. G. and Carras, S. (2011), Dynamics of contact line
2.4 Surface morphology measurements
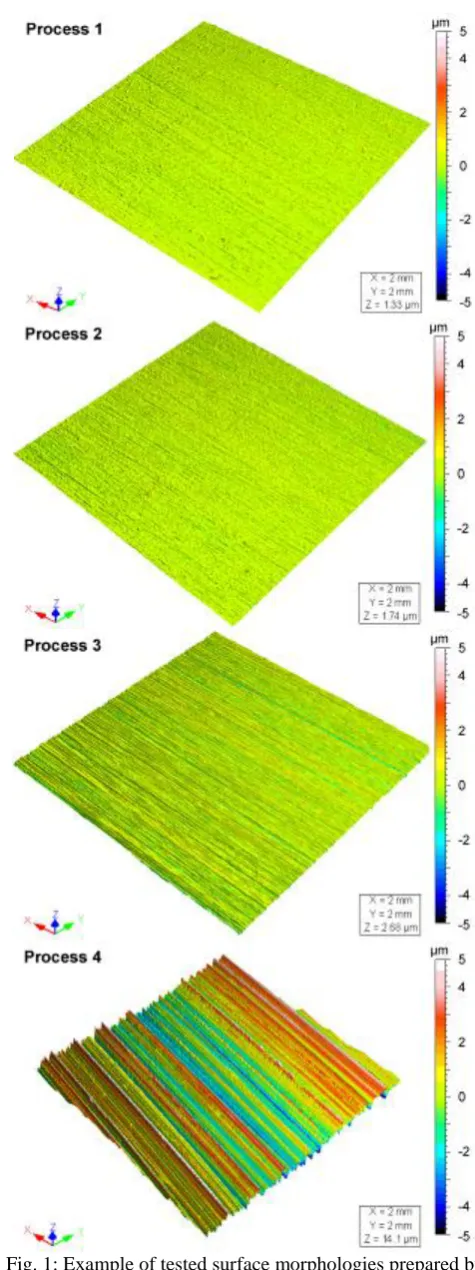
Surface morphology prepared by abrasive polishing is characterized by very sharp slopes and deep narrow grooves. Such surfaces can be very challenging for many measurement techniques like tactile or even non-contact interferometric methods where steep edges are still difficult to measure. Therefore, a non-contact confocal chromatic technique was used. The confocal measurement principle is based on the dispersion of white light into monochromatic light along the optical axis (chromatic aberration). A specific distance to the target is assigned to each wavelength by a factory calibration. Only the wavelengths exactly focused on the measured surface are reflected and passed through a confocal aperture onto a light detector, which detects and processes the spectral changes.
Both diffuse and specular surfaces can be measured. With transparent materials, a one-sided thickness measurement mode can be used, and by analysing the spectral profile both wavelengths (i.e. reflected by external and internal surfaces of a transparent sample) can be identified and the thickness can be calculated. The new ALTISURF® 500 profilometer, with good XY plane spatial resolution and equipped with a confocal chromatic sensor with 3.3 nm vertical resolution (Z axis), is able to measure 3D morphologies of prepared surfaces precisely. Another reason to choose this instrument is the fact that measurement precision is independent of surface materials. Therefore, the surfaces of materials with different optical properties like metallic, ceramic or plastic (PMMA being transparent) can be measured and results can be directly compared. Topographical parameters were calculated according to the following standards, defining Geometrical Product Specifications (GPS): ISO 4287, ISO 12085, ISO 13565, ISO 12780, ISO 12181. Examples of measured surfaces prepared on titanium alloy are presented in Figure 1.
2.5 Contact angle measurements
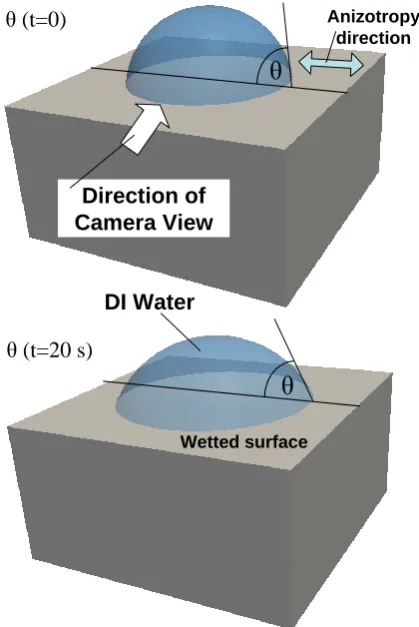
The contact angle between deionised (DI) water and the tested materials was measured using a commercially available PG-X goniometer with image size of 640x480 pixels. The apparatus is fully automated, with integrated pump, delivers accurate droplets in steps of 0.5 µl and the built-in camera captures a sequence of images, hence both dynamic and static contact angle can be analysed. The principle of apparatus operation and position of the camera are presented in Figure 2.
The drop volume was chosen in the range 4 ± 0.5 μl, so the droplet shape and the contact line are not affected by gravity forces. As previously mentioned, tests were carried out shortly after surface preparation and before the test, all surfaces were ultrasonically cleaned with acetone and alcohol. The measurement temperature was set at ambient temperature (~22ºC). Initial contact angles were measured immediately after the drop deposition at time t=0 s, and static contact angles in the equilibrium state were measured after 20 s from deposition. After that time, water drops started to evaporate and the contact angles decreased. Due to the pinning phenomenon [Deegan et al. 1997], the
contact line does not retract until the contact angle is equal to its receding value. The difference in advancing and receding contact angle is known as contact angle hysteresis. In this study, only spreading phenomenon and advancing contact angles will be investigated.
2.6 Statistical analysis of covariance
Covariance provides a measure of the strength of the correlation between two sets of data. The covariance becomes more positive for each pair of values from the two sets that differ from their respective set means in the same direction. In this work, calculated 2D roughness parameters were compared with values of dynamic spreading of contact line calculated as change in contact angle over 20 seconds (θt=0 - θt=20s).
Direction of
Camera View
Anizotropy direction
Wetted surface
DI Water
θ
θ (t=0)
θ (t=20 s)
[image:3.612.330.540.232.546.2]θ
Fig. 2: Schematic diagram of experimental measurements of contact angle in direction parallel to surface texture.
2.7 Numerical analysis with lattice Boltzmann method
This is the pre-peer reviewed version of the following article: Kubiak, K. J., Wilson, M. C. T., Mathia, T. G. and Carras, S. (2011), Dynamics of contact line move along the associated ‘links’ from one node to its
neighbours. The macroscopic fluid velocity and pressure at each node can be found from summations of the PDFs. To incorporate the liquid-air interface, the [Shan & Chen 1993] single component, multiphase model with single relaxation time was used, where a fluid-fluid interaction potential of strength G controls the surface tension and other two-phase properties. More detail of the model and the implementation of surface wettability for smooth surfaces can be found in [Castrejón-Pita et al. 2011]. The local nature of the interactions between nodes and nearest neighbours makes the lattice Boltzmann approach well suited to simulating flows involving complex geometries such as rough surfaces. Here, the above model is extended to include topographical non-uniformity of the wetted surface. The real measured surface morphology is imported into computational space and aligned with the lattice nodes to create a virtual representation of the real surface. On this rough surface, the half way bounce back boundary condition were implemented. The fidelity of constructed rough wall will depend on the lattice resolution, however using 3D space of 128x128x128 nodes we achieved satisfactory results. In the simulations, the droplets were placed initially just above the surface and allowed to spread under gravity.
3 Results and Discussion
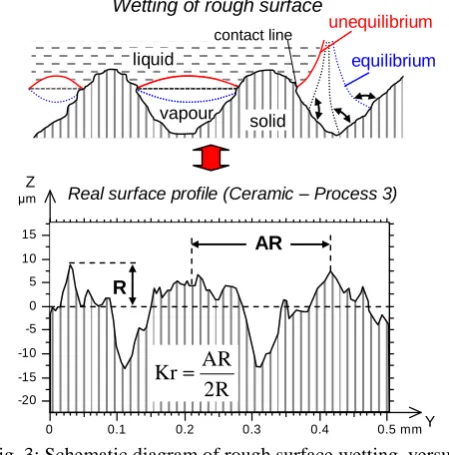
Real engineering surfaces are highly irregular and often anisotropic. Surfaces prepared for this study by polishing have a unidirectional texture. Examples of measured rough surfaces are presented in Figure 1 and 2D roughness profiles extracted in the direction perpendicular to the surface texture are plotted in Figure 4. Wetting of non-uniform surfaces is a very complex phenomenon and involves physical and chemical interactions of fluid and solid. A simple mechanical mechanism of wetting on rough surfaces can be described in terms of the barriers formed by the asperity peaks. The advancing contact line can be locally pinned on such barriers, resulting in an apparent contact angle different from the microscopic angle, until movement of the free surface pushes the local contact angle beyond its local equilibrium and the contact line then advances across the valley between peaks up to the next local equilibrium state (Figure 3). However, the real profile of the surface is much more complex, especially on anisotropic surfaces and, due to a multilevel structure i.e. micro waviness and nano roughness of the surface, wettability can be changed. Therefore, the apparent contact angle can be highly affected by surface roughness (Figure 8).
From 2D profiles extracted in the direction parallel to the surface texture more than 100 different roughness parameters were calculated for all 24 tested surfaces. This procedure generated a huge amount of data and therefore the statistical method of covariance was used to analyse and find the most relevant parameters that can influence the contact angle measurement. The most important parameters are presented in Table I.
vapour liquid
Wetting of rough surface
R
unequilibrium
solid
equilibrium
0 0.1 0.2 0.3 0.4 0.5 mm
µm
-20 -15 -10 -5 0 5 10 15
Length = 0.503 mm Pt = 21.5 µm Scale = 40 µm Real surface profile (Ceramic – Process 3)
R
AR
R
2
AR
Kr
Y Z
contact line
vapour liquid
Wetting of rough surface
R
unequilibrium
solid
equilibrium
0 0.1 0.2 0.3 0.4 0.5 mm
µm
-20 -15 -10 -5 0 5 10 15
Length = 0.503 mm Pt = 21.5 µm Scale = 40 µm Real surface profile (Ceramic – Process 3)
R
AR
R
2
AR
Kr
Y Z
[image:4.612.332.557.52.280.2]contact line
Fig. 3: Schematic diagram of rough surface wetting, versus real surface measured profile on ceramic material [after
Kubiak et al. 2009].
It can be noted that the most influential roughness parameters relate to the form and distribution of peaks. This could confirm that for higher peaks (more rough surface) the contact line motion can be blocked by the surface asperities. Therefore, a higher apparent contact angle can be observed.
Table I: Syntheses of the most relevant morphological parameters that influence wetting phenomenon, selected by covariance analysis.
2D Profile parameters Covariance coefficient
Rmr Relative Material Ratio of
the roughness profile. 148.3
Trc Microgeometric material
ratio 63.5
Pmr Relative Material Ratio of
the raw profile 57.8
Kr Mean Slope of the
Roughness Motifs 43.6
RONt Peak to valley roundness
deviation 33.0
RONp Peak to reference
roundness deviation 28.8
Psk Skewness of the raw
[image:4.612.330.559.437.624.2]This is the pre-peer reviewed version of the following article: Kubiak, K. J., Wilson, M. C. T., Mathia, T. G. and Carras, S. (2011), Dynamics of contact line
0 0.05 0.1 0.15 0.2 0.25 0.3 0.35 0.4 0.45 0.5 mm µm -3 -2 -1 0 1 2 3
2D roughness profile - Steel AISI 8630
[image:5.612.56.287.50.191.2]7 . 13 R 2 AR Kr 6 . 69 R 2 AR Kr Process 4 Process 1 Z Y
Fig. 4: Comparison of mean slope of the roughness motifs parameter Kr for process 1 and process 4.
The first three parameters are linked to the relative material ratio curve which describes the percentage of material which is traversed by a cut at a certain level located with respect to the highest point on the profile. This curve is known as the Abbott-Firestone curve. For higher values of these parameters the distance between the peaks is usually higher and the barrier created by the next peak needs more energy to be wetted, therefore the apparent contact angle is higher, which is consistent with the positive covariance of contact angle and material ratio related parameters (Rmr, Trc, Pmr). However the physical meaning of these parameters is not well justified. An alternative parameter,
Kr, represents geometric features of the surface that previous researchers have recognised to be important in model rough surfaces, see e.g. [Zhou & De Hosson 1995, Chow 1998]. It is defined as follows:
R
2
AR
Kr
(1)where: Kr is the mean slope of the roughness motifs, R
(µm) is the mean depth of the roughness motifs (average of all Ri, µm), and AR (µm) is the mean spacing of the
roughness motifs. R and AR are defined in the ISO 12085 standard, however the Kr parameter is only defined in the French standard NF E.05.015 and is not defined in the ISO 12085. In the present study, results of the roughness influence on contact angle measurement will be presented in terms of the Kr parameter as physically most appropriate one (Table II, Figure 4 and Figure 5).
In Figure 4, 2D profiles of steel samples are presented. Taking into account the difference in roughness for both processes (1 and 4), it is obvious that the roughness can significantly change the dynamics of contact line motion and the apparent contact angle when the three-phase contact line moves along such a profile. In this case, the difference in apparent static contact angle is almost 20º. However, it can be expected that the wettability will be affected by surface roughness only in a certain range, and, for very smooth surfaces, this effect should decrease. In this research, we focus mainly on a micro-scale roughness range, which is widely used in many practical applications.
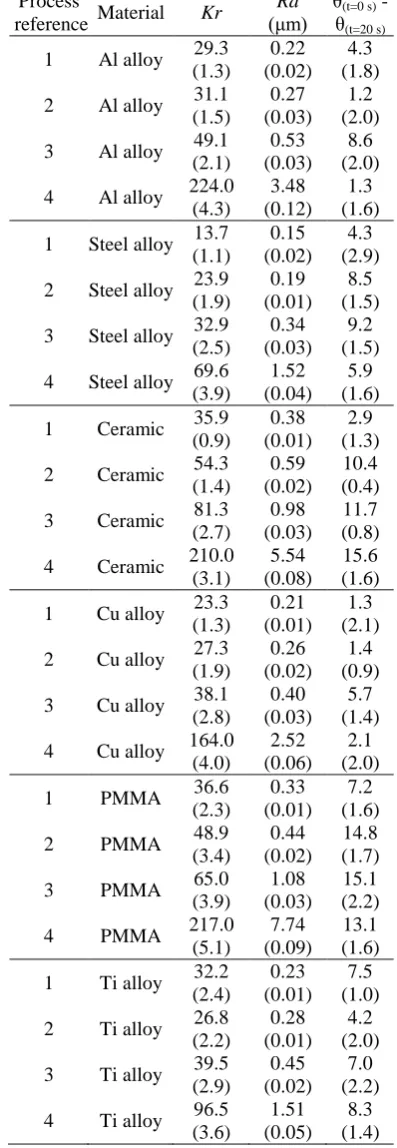
Table II: Results of surface morphology and contact angle measurement (standard deviation presented in brackets).
Process
reference Material Kr
Ra
(μm) θ(t=0 s) - θ(t=20 s)
1 Al alloy 29.3 (1.3)
0.22 (0.02)
4.3 (1.8)
2 Al alloy 31.1 (1.5)
0.27 (0.03)
1.2 (2.0)
3 Al alloy 49.1 (2.1)
0.53 (0.03)
8.6 (2.0)
4 Al alloy 224.0 (4.3)
3.48 (0.12)
1.3 (1.6)
1 Steel alloy 13.7 (1.1)
0.15 (0.02)
4.3 (2.9)
2 Steel alloy 23.9 (1.9)
0.19 (0.01)
8.5 (1.5)
3 Steel alloy 32.9 (2.5)
0.34 (0.03)
9.2 (1.5)
4 Steel alloy 69.6 (3.9)
1.52 (0.04)
5.9 (1.6)
1 Ceramic 35.9 (0.9)
0.38 (0.01)
2.9 (1.3)
2 Ceramic 54.3 (1.4)
0.59 (0.02)
10.4 (0.4)
3 Ceramic 81.3 (2.7)
0.98 (0.03)
11.7 (0.8)
4 Ceramic 210.0 (3.1)
5.54 (0.08)
15.6 (1.6)
1 Cu alloy 23.3 (1.3)
0.21 (0.01)
1.3 (2.1)
2 Cu alloy 27.3 (1.9)
0.26 (0.02)
1.4 (0.9)
3 Cu alloy 38.1 (2.8)
0.40 (0.03)
5.7 (1.4)
4 Cu alloy 164.0 (4.0)
2.52 (0.06)
2.1 (2.0)
1 PMMA 36.6 (2.3)
0.33 (0.01)
7.2 (1.6)
2 PMMA 48.9 (3.4)
0.44 (0.02)
14.8 (1.7)
3 PMMA 65.0 (3.9)
1.08 (0.03)
15.1 (2.2)
4 PMMA 217.0 (5.1)
7.74 (0.09)
13.1 (1.6)
1 Ti alloy 32.2 (2.4)
0.23 (0.01)
7.5 (1.0)
2 Ti alloy 26.8 (2.2)
0.28 (0.01)
4.2 (2.0)
3 Ti alloy 39.5 (2.9)
0.45 (0.02)
7.0 (2.2)
4 Ti alloy 96.5 (3.6)
1.51 (0.05)
[image:5.612.343.542.77.652.2]This is the pre-peer reviewed version of the following article: Kubiak, K. J., Wilson, M. C. T., Mathia, T. G. and Carras, S. (2011), Dynamics of contact line Fig. 5: Influence of roughness parameter Kr on water
[image:6.612.54.278.50.243.2]droplet spreading, *tendency obtained from analysis of process 1-3.
Figure 5 presents the influence of the roughness parameter
Kr on water drop spreading. Note that a similar tendency is observed for all tested materials, and therefore the variation in wetting dynamics can be attributed to the roughness. The plot shows that as Kr increases, the degree of spreading (quantified here by the difference in contact angle measured at 0 and 20 seconds) increases sharply. However, further increases in Kr produce diminishing effects on the spreading. For very rough surfaces (generated by process 4), no further improvement in spreading is observed, and data from process 4 surfaces are not included in Figure 5. The only exception to the above behaviour is the Al alloy, which shows a higher degree of spreading on the Process 1 surface than Process 2.
Due to different surface tension between DI water and a specific material, each tested materials will produce different initial contact angle. In consequence, this will influence the spreading ability on rough surfaces, for lower static contact angle, pinning on the roughness asperities will be more important before the static contact angle at pick will be locally reached. This confirm lower slope (lower spreading) on Figure 5 for materials with lower initial contact angle.
The effect of surface roughness on droplet spreading can be explained by examining the liquid free surface on the length scale of the surface roughness. On a perfect horizontal surface, a droplet will spread until it reaches the appropriate static contact angle. A rough surface, even if horizontal, will feature many parts where the local tangent to the surface is not horizontal.
Therefore it is possible for the liquid free surface to meet such parts of the solid at its characteristic microscopic angle, yet exhibit a much smaller apparent contact angle on the macroscopic scale [Dussan V 1979, Cox 1983], see Figure 6.
θ
sθ
sθ
sθ
a2θ
a1S 2 a
S 1 a
Fig. 6: How roughness produces an apparent contact angle (θa) different from the local (microscopic) static angle (θs),
(after Dussan V 1979).
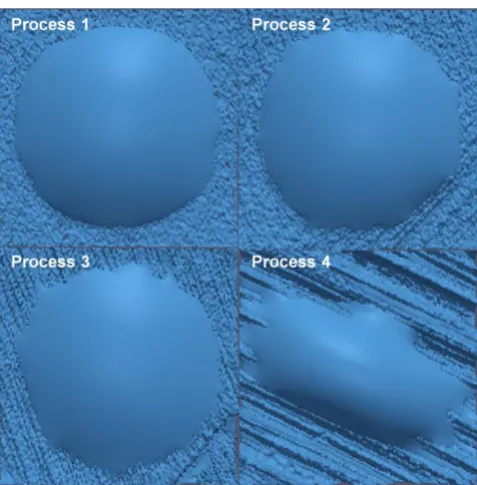
Fig. 7: Numerical analysis of shape of the droplets deposited on ceramic surfaces, top view of lattice Boltzmann simulation (drop volume 4 μl, density ratio 36,
static contact angle θ=45º, Shan-Chen model intermolecular interaction parameter G=-6).
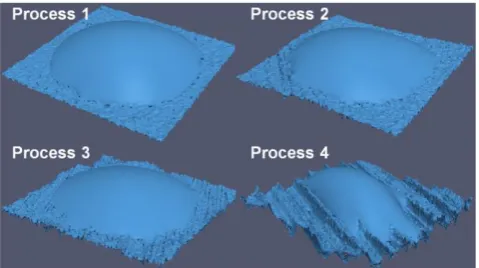
[image:6.612.325.564.233.476.2]This is the pre-peer reviewed version of the following article: Kubiak, K. J., Wilson, M. C. T., Mathia, T. G. and Carras, S. (2011), Dynamics of contact line observed in the bottom of valleys promoting the droplet
[image:7.612.49.289.90.224.2]spreading along the roughness grooves.
Fig. 8: Oblique view of the simulations shown in Fig. 7.
4 Conclusions
An experimental and numerical investigation of the wettability of real surfaces has been performed for a wide range of common engineering materials (Al alloy, Steel alloy, Ceramic, Cu Alloy, PMMA, Ti alloy). The influence of roughness on the wetting properties has been evaluated by contact angle measurement analysis. Values of the measured apparent contact angle and spreading behaviour are strongly affected by the roughness of the measured surface. In particular, it is found that the mean slope of the roughness motifs (Kr) is a key parameter which correlates strongly with an increased droplet spreading effect for all tested materials. This is consistent with theoretical explorations of the effect of surface roughness on the apparent contact angle [Cox 1983], which used the characteristic local slope of sinusoidal surfaces as a small parameter defining surface roughness. Experiments on very rough surfaces indicate that there is a limit to how much roughness can promote spreading, however, since eventually asperities behave as barriers and sites at which the contact line remains pinned. By controlling surface roughness and anisotropy it is possible to change the liquid spreading behaviour and control the final footprint of a deposited droplet or minimize contact angle. This emphasizes the importance of surface roughness in many industrial applications like ink-jet printing, painting, liquid coating, forced wetting, condensation control or lubrication.
5 Acknowledgements
This work was supported by the Engineering and Physical Sciences Research Council (UK) grant EP/F065019/1.
6 References
Bico J, Marzolin, C., Quéré, D: Europhys. Lett. 47(2), 220-226(2001).
Borruto A, Crivellone G, Marani F: Wear 222 (1) 57-65 (1998).
Cassie, ABD & Baxter S: Trans. Faraday Soc. 40, 546 (1944)
Castrejón-Pita JR, Betton ES, Kubiak KJ, Wilson MCT, Hutchings IM, Biomicrofluidics, 5, 014112 (2011). Chow TS: J Phys-Condens Mat 10 No 27, L445-L451 (1998).
Cox, R.G: J Fluid Mech 131, 1-26 (1983).
Deegan R.D, Bakajin O, Dupont T.F, Huber G, Nagel S.R, Witten T.A: Nature 389, 827-829 (1997).
Duez C, Ybert C, Clanet C, Bocquet L: Nat Phys 3, 180-183 (2007).
Dussan V, E.B.: Ann Rev Fluid Mech 11, 371-400 (1979). Extrand CW, Kumagai Y: J Colloid Interf Sci 191 378–383 (1997).
de Gennes P-G, Brochard-Wyart F, Quere D, Capillarity and Wetting Phenomena, Springer United States, (2004).
Genzer J, Efimenko K: Biofouling 22(5) 339-360 (2006). Hay KM, Dragila MI, Liburdy J: J Colloid Interf Sci 325
472–477 (2008).
Hsaio WK, Chun JH, Saka N: J. Manuf. Sci. Eng. 131, 021010 (2009)
ISO 4287:1997, Geometrical Product Specifications (GPS) - Surface texture: Profile method - Terms, definitions and surface texture parameters.
ISO 12085:1996, Geometrical Product Specifications (GPS) - Surface texture: Profile method - Motif parameters.
ISO 13565:1996, Geometrical Product Specifications (GPS) - Surface texture: Profile method; Surfaces having stratified functional properties, Part 1, 2 and 3.
ISO 12780:2011, Geometrical product specifications (GPS) - Straightness - Part 1 and 2.
ISO 12181:2011, Geometrical product specifications (GPS) - Roundness - Part 1 and 2.
ANFOR NF E.05.015 (Pans: AFNOR, 1984).
Kubiak KJ, Mathia TG: Wear 267 315-321 (2009). Kubiak KJ, Mathia TG, Wilson MCT, Proceedings of 14th International Congress of Metrology in Paris, June (2009).
Kubiak KJ, Wilson MCT, Mathia TG, Carval Ph: Wear
271, 523-528 (2011).
Narayan Prabhu, Fernades P, Kumar G: Mater. Des. 30, 297-305 (2009)
Ostrovskaya L, Podestà A, Milani P, Ralchenko V: Europhys. Lett. 63(3) 401 (2003).
Prabhu KN, Fernades P, Kumar G: Mater. Des. 30(2) 297-305 (2009).
Roucoules V, Gaillard F, Mathia TG, Lanteri P: Adv. Colloid Interface Sci. 97 177-201 (2002).
Shan X & Chen H: Phys. Rev. E 47, 1815 (1993) Wenzel RN: Ind. Eng. Chem. 28, 988 (1936)