Author’s Accepted Manuscript
A Structural Model of Passive Skeletal Muscle
shows Two Reinforcement Processes in Resisting
Deformation
Juliette Gindre, Michael Takaza, Kevin M Moerman,
Ciaran K Simms
PII:
S1751-6161(13)00063-5
DOI:
http://dx.doi.org/10.1016/j.jmbbm.2013.02.007
Reference:
JMBBM789
To appear in:
Journal of the Mechanical Behavior of Biomedical Materials
Received date:
21 August 2012
Revised date:
11 February 2013
Accepted date:
14 February 2013
Cite this article as: Juliette Gindre, Michael Takaza, Kevin M Moerman and Ciaran K
Simms, A Structural Model of Passive Skeletal Muscle shows Two Reinforcement
Processes in Resisting Deformation,
Journal of the Mechanical Behavior of Biomedical
Materials,
http://dx.doi.org/10.1016/j.jmbbm.2013.02.007
This is a PDF file of an unedited manuscript that has been accepted for publication. As a
service to our customers we are providing this early version of the manuscript. The
manuscript will undergo copyediting, typesetting, and review of the resulting galley proof
before it is published in its final citable form. Please note that during the production process
errors may be discovered which could affect the content, and all legal disclaimers that apply
to the journal pertain.
A Structural Model of Passive Skeletal Muscle shows Two
Reinforcement Processes in Resisting Deformation
Juliette Gindre a,b, Michael Takaza a, Kevin M Moerman a,c & Ciaran K Simms a*I
aCentre for Bioengineering, Trinity College Dublin, Ireland
bÉcole Nationale Supérieure des Mines de Saint-Étienne, France
cAcademic Medical Centre, The Netherlands
*Corresponding author. Tel.: +3531 896 3768.
Abstract
Introduction
Finite element models have the potential to predict in vivo muscle parameters which cannot be readily determined experimentally, and these models thus hold significant promise in advancing health care (Taylor and Humphrey, 2009). However, the utility of such models depends critically on both the constitutive laws and the material parameters (Miller, 1999), and the complexity of biological tissue presents significant difficulties. This is particularly true for soft tissues, which exhibit nonlinearity, non-homogeneity, anisotropy, viscoelasticity (ArItan et al., 2008) and tension/compression asymmetry (Takaza et al., 2013). Skeletal muscle tissue accounts for almost half of human body weight (Wang et al., 1997), so the constitutive properties of passive muscle tissue are crucial for many musculoskeletal models in diverse applications from impact biomechanics (Muggenthaler et al., 2008, Ivancic et al., 2007) to rehabilitation engineering (Linder-Ganz et al., 2008, Linder-Ganz et al., 2007), surgical simulation (Lim and De, 2007, Audette et al., 2004) and soft tissue drug transport (Wu and Edelman, 2008).
A significant focus has recently been placed on measuring the three dimensional, quasi-static and dynamic mechanical properties of passive skeletal muscle in both tension and compression, mostly by mechanical tests on cubic samples of fresh in-vitro animal muscle (Takaza et al., 2013, Calvo et al.,
2010, Morrow et al., 2010, Nie et al., 2011, Yamada, 1970, Martins et al., 1998, Van Loocke et al., 2006, Grieve and Armstrong, 1988, Vannah and Childress, 1993, Zheng et al., 1999). Apart from the observation that the behaviour is nonlinear and strongly anisotropic and viscoelastic, a striking feature of the findings is the very significant tension/compression asymmetry. Figure 1 shows a comparison between compressive tests by Van Loocke et al (Van Loocke et al., 2006) and the tensile tests by Takaza et al (Takaza et al., 2013). These tests indicate that for tests in the muscle fibre direction, the muscle crossfibre direction and at 45° to the muscle fibre direction, the stress-strain response in tension is always around two orders of magnitude greater than in compression. It has been shown in (Simms et al., 2012) that there are no current constitutive models for passive muscle which can adequately capture this observed behaviour. In fact, although this 3-D tension/compression asymmetry phenomenon is presented in the data of Takaza et al (Takaza et al., 2013), the literature shows no explanation for this phenomenon.
in passive skeletal muscle presented in (Calvo et al., 2010, Morrow et al., 2010, Nie et al., 2011, Yamada, 1970, Martins et al., 1998, Van Loocke et al., 2006, Grieve and Armstrong, 1988, Vannah and Childress, 1993, Zheng et al., 1999).
Therefore, the goal of this paper is to develop a microstructural model of passive muscle that allows the calculation of the stress-stretch relationship accounting for the contribution of the titin molecules in the muscle fibres and effect of the surrounding connective tissue and the overall incompressibility of the tissue. The objective is to apply this model to simulate the uniaxial fibre-direction tension/compression experiments reported in the literature (Calvo et al., 2010, Morrow et al., 2010, Nie et al., 2011, Yamada, 1970, Martins et al., 1998, Van Loocke et al., 2006, Grieve and Armstrong, 1988, Vannah and Childress, 1993, Zheng et al., 1999, Takaza et al., 2013) and to study the relative contributions of the constituent components of the model to the predicted stress.
[image:4.612.102.504.244.418.2](a) (b)
Figure 1: Experimental (a) compression (Van Loocke et al., 2006) and (b) tension (Takaza et al., 2013)
data from the Literature for passive skeletal muscle.
[image:4.612.98.520.477.612.2](a) (b) (c)
Figure 2: Scanning electron micrographs of transverse sections of skeletal muscle connective tissues: (a) 200x magnification, (b) 700x magnification and (c) 3200x magnification, adapted from (Trotter and Purslow, 1992).
Methods
1 1.05 1.1 1.15 1.2 1.25 1.3 0
20 40 60 80 100 120 140
Stretch Ratio
Cau
c
h
y
St
ress (
k
Pa
)
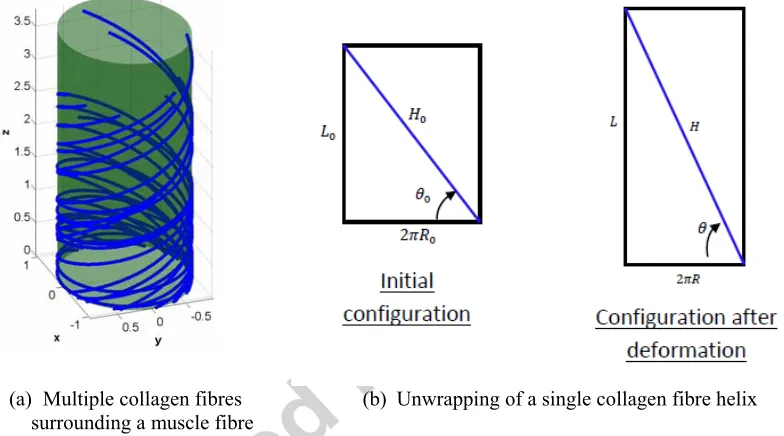
The model consists of a single muscle fibre surrounded by its connective tissue. The muscle fibre is modelled as an incompressible cylinder with a longitudinal stiffness representing the contribution of the titin molecules. The endomysium is represented as a distribution of helices of collagen fibres with random angles wrapped around the cylinder, see Figure 3. This is a significant simplification of the actual structure in which individual collagen fibres wrap around more than one muscle fibre. However this approach allows a direct study of the interactive behaviour of individual muscle fibres and their surrounding connective tissue. To obtain the load-stretch relationship, a tensile or compressive deformation of the cylinder representing the muscle fibre is imposed. A constant circular cross-sectional shape and constant volume are assumed (Purslow and Trotter, 1994, Van Loocke et al., 2006). The collagen fibre helices are constrained to deform with the muscle fibre cylinder.
(a) Multiple collagen fibres surrounding a muscle fibre
(b) Unwrapping of a single collagen fibre helix
Figure 3: (a) Representation of a muscle fibre surrounded by multiple collagen fibres with different initial orientation and (b) calculation of helical stretch.
The objective of the model is to calculate the longitudinal force developed by the titin molecules ( ) and by the collagen network ( ) when the muscle fibre undergoes an applied stretch
( ). The result can then be compared to the experimental stress/stretch data (Takaza et al., 2013, Calvo et al., 2010, Morrow et al., 2010, Nie et al., 2011, Yamada, 1970, Martins et al., 1998, Van Loocke et al., 2006, Grieve and Armstrong, 1988, Vannah and Childress, 1993, Zheng et al., 1999).
Collagen contribution to longitudinal force
The stretch in the collagen helix is calculated by unwrapping the cylinder that represents the surface of the muscle fibre. Let denote the length of the collagen helix and be the initial collagen fibre angle with respect to the horizontal, see Figure 3b. The collagen fibre stretch can then be expressed in terms of and as:
[image:5.612.119.511.222.440.2]To account for waviness in the collagen fibres (Lepetit, 2008, Lepetit et al., 1999), a waviness scaling factor is introduced so that the effective collagen fibre stretch is:
/ .
Using a logarithmic strain formulation and assuming a tension-only Young's modulus ( ) for the collagen fibres, the stress in a single collagen fibre ( ) is:
ln 1
0 1.
Thus this part of the model is similar to a standard fibre-reinforced composite approach. For each fibre, the stress ( ) acting over a cross-sectional area ( ) results in a force along the tangential direction ( ):
.
This force can be decomposed into longitudinal ( ) and radial components ( ), where the longitudinal component directly opposes applied deformation, while the radial component generates a pressure ( which acts on the incompressible muscle fibre.
For a single collagen fibre:
Each collagen fibre is assigned a waviness ( ) and an initial angle ( ). A group of fibres with the same is a fibre family and the distribution defines the percentage of collagen fibres contained in each fibre family. Now let be the number of fibres in one family, and be the total number of collagen fibres. Then:
.
Let denote the force generated by a whole fibre family in the vertical direction:
.
This can also be expressed using , the cross-sectional area occupied by the endomysium around the
muscle fibre (noting that ) as:
.
In the above equation, the term is the proportion of connective tissue cross-fibre area occupied by the fibre family and represents the mean stress in the collagen helices of the fibre family. This stress can be estimated by:
1
where is a random distribution of waviness between and and defines a partition of the fibre family for assigning random waviness. The total longitudinal force produced by the collagen network is equal to the sum of over all fibre families:
, .
For each fibre family is a function of and the applied stretch :
,
Therefore can be finally expressed as a function of only:
, ∑ , , .
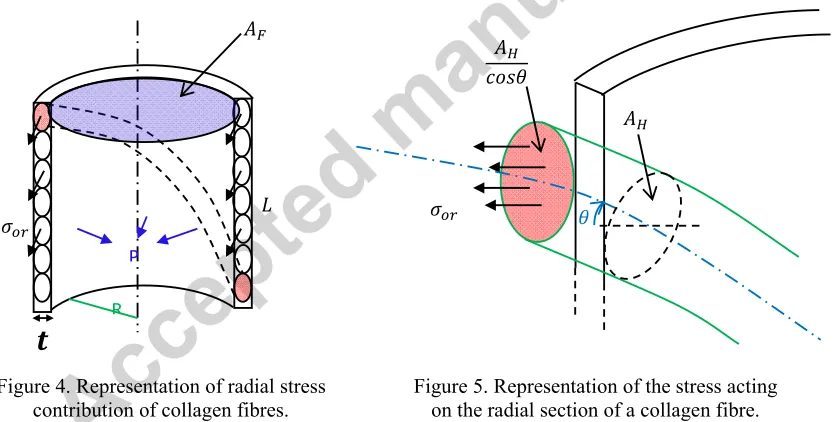
Collagen contribution to Pressure
The radial component of stress in each collagen fibre creates a pressure inside the muscle fibre. This results in a longitudinal force equal to , where is the cross-sectional area of the muscle fibre.
[image:7.612.100.520.345.556.2]Figure 4. Representation of radial stress contribution of collagen fibres.
Figure 5. Representation of the stress acting on the radial section of a collagen fibre.
Let be the radial stress in one collagen fibre as shown in Figure 4. Then, for one collagen fibre, this stress acts on the area in red in Figure 5, which is equal to . Accordingly, can be expressed as:
.
We may write the force balance of the half-cylinder considering a single fibre family:
2 2 .
We can express the pressure generated by this family as:
R
P
,
where is the endomysium thickness and represents the mean stress in the collagen helices of the fibre family as before. The latter can be expressed as:
1
, .
So the total pressure in the muscle fibre generated by the whole collagen network is:
.
However, since and , we have 2 and so
√ .
We can therefore express the force generated by in the vertical direction directly as a function of :
.
Since we have:
,
We can finally write the pressure-induced axial force term as:
, √ ∑ , , .
Titin contribution
The total titin force can be written as a function of , the force developed to stretch a single titin molecule as follows:
,
where is the number of titin molecules per unit area in a muscle fibre. Representing the titin molecule as a wormlike chain (Trinick, 2001, Kellermayer et al., 2003, Leake et al., 2004, Linke et al., 1996) we have:
∆
In this expression ∆ represents the length change of one titin molecule, is the molecule’s contour length, is the persistence length, is the Boltzmann constant and is the absolute temperature. Since the titin molecules are assumed to be in-series, the extension of a single titin molecule can be expressed directly as a function of :
∆ 1 ,
where n is the number of titin molecules in series in a muscle fibre. If we introduce the number of titin molecules per unit length ( ):
∆ ,
we can then write the expression of as a function of only:
if λ 1
0 if λ 1.
Thus this part of the model is again similar to the fibre-reinforced composite approach.
To characterize the contribution of the titin molecules in the model, four parameters are needed: and define the mechanical properties of one molecule, and and are structural parameters of the muscle fibre.
Model summary
The model was implemented in Matlab (The Mathworks, Natick Massachusetts). The model equations can be summarized as follows:
.
So in tension:
, (eq 1)
and in compression:
, (eq 2)
with:
, ∑ , , ,
2 , √
1
.
The expressions above are independent of the length of the muscle fibre modeled and depend only on the cross-sectional areas occupied by the connective tissue and by the muscle fibre . Therefore these formulations can be extended to a muscle sample of cross-sectional area by introducing the percentage of connective tissue in the cross-sectional area of a muscle sample ( ), so that
becomes and becomes 100 .
Model parameters
There is uncertainty in all of the input parameters for the model, and a literature search was used to define a range where possible:
Collagen Young's Modulus : Most reported values for the Young's modulus for collagen fibres lie
in the range 200-570 MPa (Kato et al., 1988, Yang et al., 2008, Sasaki and Odajima, 1996, Gentleman et al., 2003, van der Rijt et al., 2006, Shen et al., 2008).
Percentage of connective tissue ( ): Purslow (Lewis and Purslow, 1989, Purslow, 1999) has reported
that the proportion of perimysial collagen in bovine muscle ranges from 0.43-4.6% of muscle dry weight, whereas endomysial collagen proportion ranges from 0.47-1.20%. In the model, is the proportion of endomysium and perimysium combined, and was therefore chosen to range from 0.5% to 3%.
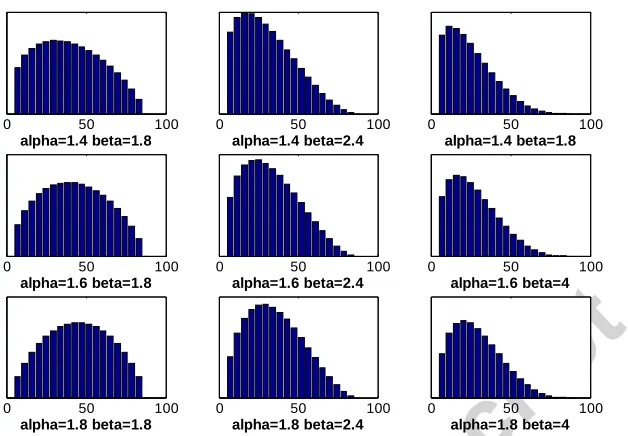
Minimal/maximal waviness and collagen fibre angle distribution ( , , , and :
Waviness and collagen fibre angle distribution differ between endomysium and perimysium. In endomysium, waviness is reported as being distributed around an average of 1.1, whereas in perimysium it reportedly ranges from 1.15-1.3 (Lewis and Purslow, 1989, Lepetit, 2008). Endomysium shows a broadly random collagen fibre orientation, but a numerically weighted mean orientation of about 60° with respect to the muscle fibre direction has been reported (Purslow and Trotter, 1994). Perimysium has been found to have two sets of fibres oriented at ±55° (Purslow, 2002, Purslow, 2008, Purslow and Trotter, 1994) with respect to the muscle fibre direction. To account for both networks, the distribution of initial angles and waviness in the model were calculated from these values weighted by the proportion of each type of connective tissue. The minimum waviness was chosen as 1.01-1.05, whereas the maximum waviness was chosen as 1.25-1.3. To represent the overall distribution of angles a Beta distribution was chosen:
, .
Figure 6: Sample distributions of collagen fibre angles (in degrees) using Beta distribution parameters.
Titin wormlike chain parameters: The literature shows a wide range of values for contour length
(1.5-13nm) and persistence length (900-3400nm) for a titin molecule (Kellermayer et al., 2003, Trinick, 2001, Leake et al., 2004). However, as preliminary evaluation showed the model not to be very sensitive to the titin filament behaviour, average values were used for simplicity. The number of titin molecules in series and parallel in muscle fibres were found in (Linke et al., 1998, Martini, 2004, Maruyama, 1994), and average values were picked with = 3.1015 and =106.
The parameters of the model and the ranges implemented are tabulated in Table 1.
Parameter name model value Literature range unit
Collagen modulus [200.106 -570.106] [200.106 -860.106] Pa
Percentage of connective tissue [0.5-3] [0.5-3] %
Minimal waviness [1.05-1.1] NA
Maximal waviness [1.25-1.3] NA
Distribution of initial angles of
collagen fibres beta distribution random alpha parameter of beta
distribution [1.5-1.8] NA
beta parameter of beta distribution [1.8-2] NA
0 50 100
alpha=1.4 beta=1.8
0 50 100
alpha=1.4 beta=2.4
0 50 100
alpha=1.4 beta=1.8
0 50 100
alpha=1.6 beta=1.8
0 50 100
alpha=1.6 beta=2.4
0 50 100
alpha=1.6 beta=4
0 50 100
alpha=1.8 beta=1.8
0 50 100
alpha=1.8 beta=2.4
0 50 100
titin persistence length 5.10-9 [1.5.10-9-13.5.10-9] m
titin contour length 1500.10-9 [900.10-9-3400. 10-9] m
number of titin molecules per units of cross-sectional area of muscle fibre
3.1015 [0.8.1015-6.28.1015] m-2
number of titin molecules per units of length along the muscle fibre
[image:12.612.95.519.67.170.2]106 [0.77. 106-1.25. 106] m-1
Table 1: Chosen range of model parameters.
Model implementation
The model was implemented using the software Matlab (The Mathworks, Natick Massachusetts). To account for uncertainty in the input parameters, a separate simulation was run with a maximum, minimum and average value of each parameter presented in Table 1, leading to a total of 311
(=177147) simulations. A sensitivity analysis was performed to assess the influence of uncertainty in the collagen stiffness and the proportion of collagen in the connective tissue.
Results
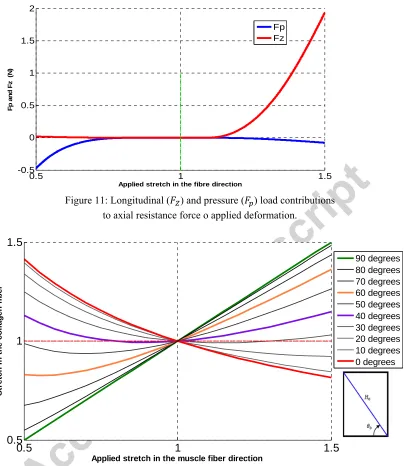
Figure 7 shows the model response for the range of parameters listed in Table 1 compared to the range of tensile (Calvo et al., 2010, Morrow et al., 2010, Nie et al., 2011, Yamada, 1970, Martins et al., 1998, Takaza et al., 2013) and compressive (Van Loocke et al., 2006, Grieve and Armstrong, 1988, Vannah and Childress, 1993, Zheng et al., 1999, Martins et al., 1998) experimental stress-stretch responses found in the literature. For clarity, only the maximum and minimum of the experimental data are shown. Figure 8 shows the sensitivity of the model to the chosen value of the Young's Modulus for the collagen fibres. Figure 9 shows the model sensitivity to the percentage of collagen fibres in the connective tissue. Figure 10 shows the relative contributions to the longitudinal stress of the collagen compared to the titin for the average model parameters. Figure 11 shows the longitudinal versus pressure load contributions to the axial resistance force for the average model parameters. Figure 12 shows the effect of initial collagen fibre angle ( ) on collagen fibre stretch.
0.5 1 1.5
-1000 -500 0 500 1000 1500
Applied stretch in the fibre direction
C
a
uchy st
ress i
n
kP
a
Experimental Min Experimental Max
[image:12.612.107.482.475.714.2]Figure 7: Model results compared to the range of tensile (Calvo et al., 2010, Morrow et al., 2010, Nie et al., 2011, Yamada, 1970, Martins et al., 1998, Takaza et al., 2013) and compressive (Van Loocke et
[image:13.612.121.474.147.396.2]al., 2006, Grieve and Armstrong, 1988, Vannah and Childress, 1993, Zheng et al., 1999, Martins et al., 1998) experimental stress-stretch responses found in the literature: red curves are experimental maximum and minimum, black dots are individual model results and green curve is model average.
Figure 8: Model sensitivity to collagen fibre Young's Modulus.
Experimental data is from (Takaza et al., 2013, Calvo et al., 2010, Morrow et al., 2010, Nie et al., 2011, Yamada, 1970, Martins et al., 1998, Van Loocke et al., 2006, Grieve and Armstrong, 1988,
Vannah and Childress, 1993, Zheng et al., 1999).
0.5 1 1.5
-1000 -500 0 500 1000 1500
Applied stretch in the fibre direction
C
a
u
c
h
y
s
tr
e
s
s
in
k
P
a Experimental Max
Figure 9: Model sensitivity to the proportion of collagen fibres in the connective tissue. Experimental data is from (Takaza et al., 2013, Calvo et al., 2010, Morrow et al., 2010, Nie et al., 2011, Yamada,
1970, Martins et al., 1998, Van Loocke et al., 2006, Grieve and Armstrong, 1988, Vannah and Childress, 1993, Zheng et al., 1999).
Figure 10: Relative contributions to the longitudinal overall stress of the collagen compared to the titin for the average model parameters in applied tension.
0.5
1
1.5
-1000
-500
0
500
1000
1500
Applied stretch in the fibre direction
C
a
u
c
h
y
st
ress
in
kP
a
Experimental Min
Experimental Max
1 1.1 1.2 1.3 1.4 1.5
0 20 40 60 80 100
Applied stretch in the fibre direction
per
c
e
n
ta
ge
of
t
o
ta
l s
tr
e
s
s
[image:14.612.136.461.391.607.2]Figure 11: Longitudinal ( ) and pressure ( ) load contributions to axial resistance force o applied deformation.
Figure 12: Effect of initial Collagen fibre angle ( ) on collagen fibre stretch: θ0=90 degrees means
the collagen fibres are initially aligned with the main muscle fibre direction.
Discussion
The model presented in this paper is a microstructurally motivated representation of a single muscle fibre surrounded by families of collagen fibres at different initial helical orientations representing the connective tissue. The assumption is made that the collagen fibres of the endomysium are wrapped around an individual muscle fibre in a helical manner and that the model can be scaled up to represent muscle bulk by representing the distribution of collagen fibres in the endomysium and the perimysium as a single distribution. The model is predicated on the assumption of overall incompressibility due to the high fluid content combined with high stiffness but initial waviness of the oriented collagen fibres in the connective tissue and low stiffness of the titin filaments in the muscle fibres. The model is applied to test whether it can predict the tensile (Takaza et al., 2013, Calvo et al., 2010, Morrow et al.,
0.5 1 1.5
-0.5 0 0.5 1 1.5 2
Applied stretch in the fibre direction
Fp a n d Fz ( N ) Fp Fz
0.5 1 1.5
0.5 1 1.5
Applied stretch in the muscle fiber direction
2010, Nie et al., 2011, Yamada, 1970, Martins et al., 1998) and compressive (Van Loocke et al., 2006, Grieve and Armstrong, 1988, Vannah and Childress, 1993, Zheng et al., 1999, Martins et al., 1998) bulk muscle experimental responses found in the literature and to assess the mechanisms of physical resistance to applied deformation. The literature shows that the stress induced through applied external tension is much greater than the stress induced through applied external compression in both the along-fibre and cross-fibre directions, as well as in tests at oblique angles to the muscle fibres (Takaza et al., 2013, Van Loocke et al., 2006).
Model comparison to experimental data
Ideally, since the model presented is of a single muscle fibre surrounded by connective tissue, the model predictions would be compared to the compressive and tensile response of a single muscle fibre. However, since the compressive response of a single muscle fibre would be dominated by buckling effects and the connective tissue network interweaves several muscle fibres, the approach taken in this paper was to predict bulk muscle results in tension and compression by scaling up the single fibre response. Figure 7 shows that the model results depend significantly on the chosen input parameters, the range of which is presented in Table 1, based on the available literature. However, when the mean model response (green dashed curve) is compared to the range of experimental results, it is evident that both the non-linearity and some of the tension/compression asymmetry in the muscle fibre direction are captured. In particular, Figure 8 shows that at stretches of λ <1.2 compared to λ
<0.8 for a Young’s Modulus of 570MPa, the compressive response is significantly less stiff than the tensile response. However, overall the experimental data does clearly show more tension/compression asymmetry than the model does.
The sensitivity analysis shows how the model stress is strongly dependent on both the choice of Young's Modulus for the collagen fibres and for the proportion of collagen fibres in the connective tissue, see Figures 8 & 9. Since these parameters are unknown for the specific experimental cases to which the model results are compared in Figure 7, the predictive trends rather than absolute values of the model are more important.
Contribution of titin stretch to longitudinal stress
The proportion of the longitudinal stress generated by stretching the titin filaments in the muscle fibres compared to stress generated by stretching the collagen fibres in the connective tissue is shown in Figure 10 for the case where the average material parameters in Table 1 were implemented. Only tensile stretch is shown, since in compression the titin filaments bear no load. It is evident that, while the titin filaments dominate at low tensile stretches (stretches less than about 1.08), at medium and high stretches the collagen network dominates (stretches greater than 1.1). Although not formally included in the sensitivity analysis, preliminary evaluation showed that the choice of material parameters for the titin wormlike chain did not significantly influence this finding.
Contribution of collagen fibre stretch to longitudinal stress
The collagen fibres only bear load if they are stretched in tension. This can happen when the overall muscle cylinder is elongated but also when the overall cylinder is compressed, depending on the initial collagen fibre angle orientation. When a tensile stretch is applied (λ >1), the titin and the longitudinal component of the collagen fibre stress work together to resist the applied stretch, but their action is opposed by the pressure force, as summarized by equation 1. When a compressive stretch (λ
in opposition to . The contributions in tension/compression of both the direct longitudinal resistance and the pressure induced longitudinal resistance to stretching the collagen fibres of the connective tissue are shown in Figure 11. In tension, the direct longitudinal resistance is the dominant mechanism of resisting applied stretch. In contrast, in compression, the dominant mechanism of resisting applied stretch is through the pressure component. This is the key finding of this paper, as the model implies two different internal mechanisms for resisting externally applied loading, and the results appear to match the experimental data for tension (Takaza et al., 2013, Calvo et al., 2010, Morrow et al., 2010, Nie et al., 2011, Yamada, 1970, Martins et al., 1998) and compression (Van Loocke et al., 2006, Grieve and Armstrong, 1988, Vannah and Childress, 1993, Zheng et al., 1999, Martins et al., 1998) quite well, at least for fibre-direction only deformation. The observation that the radial component of stress in the collagen fibres creates a pressure inside the muscle fibre has previously been made in the context of muscle length changes during meat cooking (Lepetit, 2008).
The distribution of initially wavy and angled collagen fibres account for the non-linear response since, as the collagen fibres are being recruited, they straighten and re-orient. In compression, the mechanical response is mainly due to collagen fibres with initial angles close to zero degrees, and in tension by collagen fibres with initial angles close to 90 degrees, see Figure 12. Accordingly, the wide range of orientations of collagen fibres could be seen as a response to the need to protect muscle tissue from excessive compression and excessive tension.
Limitations
The model presented in this paper is limited to predicting steady-state muscle fibre direction responses only, and has simplified the actual geometric arrangement of the collagen fibres of the connective tissue considerably, with the interconnectivity of the collagen networks not explicitly considered. It also does not account for viscoelastic properties which are known to be very important (Van Loocke et al., 2008, Van Loocke et al., 2009). It only predicts some of the tension compression asymmetry observed in the experimental data (see Figure 8), and there is no combination of model parameters which can capture the full extent of tension/compression asymmetry in the data, so this will be the focus of further work. Furthermore, the model has a significant number of input parameters. However, no optimization was performed, so the relatively close match observed between the average experimental data and the average model predictions in Figure 7 is not the result of parameter tuning.
In future, finite element modelling of whole muscle including fascicles similar to the work of Blemker's group (eg (Sharafi et al., 2011, Sharafi and Blemker, 2010, Sharafi and Blemker, 2011, Blemker et al., 2005)) will be necessary to further understand the collagen fibre pressure terms considered in the present work. These works have shown that the finite element approach is effective, for example in confirming the role of muscle force transmission through shear in the connective tissue in the case of terminating fibres and this approach could help to confirm the pressure/hoop-stress hypothesis for passive muscle resistance to external deformation reported in this paper. This might be done by adding two reinforcement terms to a ground matrix in the constitutive model: a direct longitudinal reinforcement and an indirect pressure reinforcement. Existing lumped constitutive models for passive muscle (such as that of (Blemker et al., 2005, Boel et al., 2012)) are unlikely to be able to capture the anisotropic and tension/compression asymmetric response observed in the literature (eg (Van Loocke et al., 2006, Takaza et al., 2013)) and further constitutive developments will first be required.
References
ARITAN, S., OYADIJI, S. & BARTLETT, R. (2008) A mechanical model representation of the in vivo creep behaviour of muscular bulk tissue. Journal of Biomechanics, 41, 2760-2765. AUDETTE, M. A., HAYWARD, V., ASTLEY, O., DOYON, M., MCCALLISTER, G. A. &
CHINZEI, K. (2004) A PC-based system architecture for real-time finite element-based tool-specific surgical simulation. International Congress Series 1268.
BLEMKER, S. S., PINSKY, P. M. & DELP, S. L. (2005) A 3D model of muscle reveals the causes of nonuniform strains in the biceps brachii. Journal of Biomechanics, 38, 657-665.
BOEL, M., KRUSE, R., EHRET, A., LEICHSENRING, K. & SIEBERT, T. (2012) Compressive properties of passive skeletal muscle —The impact of precise sample geometry on parameter identification in inverse finite element analysis. JournalofBiomechanics, 45, 2673-2679. CALVO, B., RAMÍREZ, A., ALONSO, A., GRASA, J., SOTERAS, F., OSTA, R. & MUÑOZ, M. J.
(2010) Passive nonlinear elastic behaviour of skeletal muscle: Experimental results and model formulation. Journal of Biomechanics, 43, 318-325.
GENTLEMAN, E., LAY, A., DICKERSON, D., NAUMAN, E., LIVESAY, G. & DEE, K. (2003) Mechanical characterization of collagen fibers and scaffolds for tissue engineering.
Biomaterials, 34, 3805-3813.
GRIEVE, A. P. & ARMSTRONG, C. G. (1988) Compressive properties of soft tissues. IN DE GROOT, G., HOLLANDER, A. P., HUIJING, P. A. & VAN INGEN SCHENAU, G. J. (Eds.) Biomechanics XI-A. International series on biomechanics. Armsterdam, Free
University Press.
IVANCIC, P. C., ITO, S. & PANJABI, M. M. (2007) Dynamic sagittal flexibility coefficients of the human cervical spine. Accident Analysis & Prevention 39, 688-695.
KATO, Y., CHRISTIANSEN, D., HAHN, R., SHIEH, S., GOLDSTEIN, J. & SILVER, F. (1988) Mechanical properties of collagen fibres: a comparison of reconstituted and rat tail tendon fibres. Biomaterials, 10, 38-42.
KELLERMAYER, M., BUSTAMANTE, C. & GRANZIER, H. (2003) Mechanics and structure of titin oligomers explored with atomic force microscopy. Biochimica et Biophysica Acta, 122, 197-205.
LEAKE, M., WILSON, D., GAUTEL, M. & SIMMONS, R. (2004) The Elasticity of Single Titin Molecules Using a Two-Bead Optical Tweezers Assay. Biophysical Journal, 87, 1112-1235. LEPETIT, J. (2008) Collagen contribution to meat toughness: Theoretical aspects. Meat Science, 80,
960-967.
LEPETIT, J., GRAJALES, A. & FAVIER, R. (1999) Modelling the effect of sarcomere length on collagen thermal shortening in cooked meat: consequence on meat toughness. Meat Science,
54, 239-250.
LEWIS, G. & PURSLOW, P. (1989) Connective Tissue Differences in the Strength of Cooked Meat Across the Muscle Fibre Direction due to Test Specimen Size. Meat Science, 28, 183-194. LIM, Y.-J. & DE, S. (2007) Real time simulation of nonlinear tissue response in virtual surgery using
the point collocation-based method of finite spheres. Computer Methods in Applied Mechanics and Engineering 196, 3011-3024.
LINDER-GANZ, E., SHABSHIN, N., ITZCHAK, Y. & GEFEN, A. (2007) Assessment of mechanical conditions in sub-dermal tissues during sitting: A combined experimental-MRI and finite element approach. Journal of Biomechanics . 40, 1443-1454.
LINDER-GANZ, E., SHABSHIN, N., ITZCHAK, Y., YIZHAR, Z., SIEV-NER, I. & GEFEN, A. (2008) Strains and stresses in sub-dermal tissues of the buttocks are greater in paraplegics than in healthy during sitting. Journal of Biomechanics . 41, 567-580.
LINKE, W., IVEMEYER, M., MUNDEL, P., STOCKMEIER, M. & KOLMERER, B. (1998) Nature of PEVK-titin elasticity in skeletal muscle. Biophysics, 95, 8052-8057.
LINKE, W., OLIVIERI, M., LOLMERER, B., JC., R. & LABEIT, S. (1996) Towards a Molecular Understanding of the Elasticity of Titin. JMB, 261, 62-71.
MARTINS, J. A. C., PIRES, E. B., SALVADO, R. & DINIS, P. B. (1998) A numerical model of passive and active behavior of skeletal muscles. Computer Methods in Applied Mechanics and Engineering, 151, 419-433.
MARUYAMA, K. (1994) Connectin, an elastic protein of striated muscle. Biophysical Chemistry, 50.
MILLER, K. (1999) Constitutive model of brain tissue suitable for finite element analysis of surgical procedures. Journal of Biomechanics, 32, 531-537.
MORROW, D., HAUT-DONAHUE, T., ODEGARD, G. & KAUFMAN, K. (2010) Transversely isotropic tensile material properties of skeletal muscle tissue. Journal of the Mechanical Behavior of Biomedical Materials, 3, 124-129.
MUGGENTHALER, H., VON MERTEN, K., PELDSCHUS, S., HOLLEY, S., ADAMEC, J., PRAXL, N. & GRAW, M. (2008) Experimental tests for the validation of active numerical human models. Forensic Science International, 177, 184-191.
NIE, X., CHENG, J.-I., CHEN, W., W. & WEERASOORIYA, T. (2011) Dynamic tensile response of porcine muscle. Journal of Applied Mechanics, 78, 021009 (1-5).
PURSLOW, P. (1985) The Physical Basis of Meat Texture: Observations on the Fracture Behaviour of Cooked Bovine M. Semitendinosus. Meat Science, 12, 39-60.
PURSLOW, P. (1999) The intramuscular connective tissue matrix and cell-matrix interactions in relation to meat toughness. 45th International Congress of Meat Science and Technology.
Yokohama, Japan.
PURSLOW, P. (2002) The structure and functional significance of variations in the connective tissue within muscle. Comparative Biochemistry and Physiology, 133, , 947-966.
PURSLOW, P. (2005) Intramuscular connective tissue and its role in meat quality. Meat Science, 70, 435-447.
PURSLOW, P. (2008) The extracellular matrix of skeletal and cardiac muscle. IN FRATZL, P. (Ed.)
Collagen: Structure and Mechanics Vertebrates, chapter 12 New York.
PURSLOW, P. & TROTTER, J. (1994) The morphology and mechanical properties of endomysium in series-fibred muscles: variations with muscle length. Journal of Muscle Research and Cell Motility, 15, 299-308.
PURSLOW, P. P. (2010) Muscle fascia and force transmission. Journal of Bodywork & Movement Therapies, 14 411-417.
SASAKI, N. & ODAJIMA, S. (1996) Elongation mechanism of collagen fibrils and force-strain relations of tendon at each level of structural hierarchy. J.Biomechanics.
SHARAFI, B., AMES, E., HOLMES, J. & BLEMKER, S. S. (2011) Strains at the myotendinous junction predicted by a micromechanical model. Journal of Biomechanics, 44(16), 2795-2801.
SHARAFI, B. & BLEMKER, S. S. (2010) A micromechanical model of skeletal muscle to explore the effects of fiber and fascicle geometry. Journal of Biomechanics, 43, 3207-3213. SHARAFI, B. & BLEMKER, S. S. (2011) A mathematical model of force transmission from
intrafascicularly terminating muscle fibers. Journal of Biomechanics, 44, 2031-2039. SHEN, Z., DODGE, M., KAHN, H., BALLARINI, R. & EPPELL, S. (2008) Stress-Strain
Experiments on Individual Collagen Fibrils. Biophysical Journal.
SIMMS, C., VAN LOOCKE, M. & LYONS, C. (2012) Skeletal Muscle in Compression: Modelling approaches for the Passive Muscle Bulk International Journal of Multiscale Computational Engineering, 10, 143-154.
TAKAZA, M., GINDRE, J., MOERMAN, K., LYONS, C. & SIMMS, C. (2013) The anisotropic mechanical behaviour of passive skeletal muscle tissue subjected to large tensile strain.
JMBBM, 17, 209-220.
TAYLOR, C. & HUMPHREY, J. (2009) Open problems in computational vascular biomechanics: Hemodynamics and arterial wall mechanics. Computer Methods in Applied Mechanics and Engineering, 198, 3514-3523
TRINICK, L. T. A. J. (2001) Flexibility and Extensibility in the Titin Molecule: Analysis of Electron Microscope Data. JMB, 310, 755-771.
VAN DER RIJT, J., VAN DER WERF, K., BENNINK, M., DIJKSTRA, P. & FEIJEN, J. (2006) Micromechanical Testing of Individual Collagen Fibrils. Macromolecular Bioscience, 6, 697-702.
VAN LOOCKE, M., LYONS, C. G. & SIMMS, C. K. (2006) A validated model of passive muscle in compression. Journal of biomechanics, 39, 2999-3009.
VAN LOOCKE, M., LYONS, C. G. & SIMMS, C. K. (2008) Viscoelastic properties of passive skeletal muscle in compression: Stress-relaxation behaviour and constitutive modelling.
Journal of Biomechanics, 41, 1555-1566.
VAN LOOCKE, M., LYONS, C. G. & SIMMS, C. K. (2009) Viscoelastic properties of passive skeletal muscle in compression: cyclic behaviour. Journal of Biomechanics, 42, 1038-1048. VANNAH, W. M. & CHILDRESS, D. S. (1993) Modelling of mechanics of narrowly contained soft
tissue; the effects of specification of poisson's ratios. Journal of rehabilitation Research and development, 30, 205-209.
VIGNOS, P. & LEFKOWITZ, M. (1959) A biochemical study of certain skeletal muscle constituents in human progressive muscular dystrophy. The Journal of Clinical Investigation, 38, 873-881. WANG, Z., DEURENBERG, P., WANG, W. & HEYMSFIELD, S. (1997) Proportion of adipose
tissue-free body mass as skeletal muscle: Magnitude and constancy in men. American Journal of Human Biology, 9, 487-492.
WU, P. I. K. & EDELMAN, E. R. (2008) Structural biomechanics modulate intramuscular distribution of locally delivered drugs. Journal of Biomechanics . 41, 2884-2891. YAMADA, H. (1970) Strength of biological materials, Baltimore, The Williams and Wilkins
Company.
YANG, L., VAN DER WERF, K., FITIE, C., BENNINK, M., DIJKSTRA, P. & FEIJEN, J. (2008) Mechanical Properties of Native and Cross-linked Type I Collagen Fibrils. Biophysical Journal, 94, 2204-2211.
ZHENG, Y., MAK, A. & LUE, B. (1999) Objective assessment of limb tissue elasticity: development of the manual indentation procedure. Journal of Rehabilitation Research and Development,