Construct and Predictive Validity of an Instrument
for Measuring Intrinsic, Extraneous and
Germane Cognitive Load
Merima Zukić
1, Nermin Đapo
2,*, Dženana Husremović
21Department of Pedagogy, Faculty of Philosophy, University of Sarajevo, Bosnia and Herzegovina 2Department of Psychology, Faculty of Philosophy, University of Sarajevo, Bosnia and Herzegovina
Copyright©2016 by authors, all rights reserved. Authors agree that this article remains permanently open access under the terms of the Creative Commons Attribution License 4.0 International License
Abstract
The aims of this study were to assess the factor structure of a new instrument for the measurement of intrinsic, extraneous and germane cognitive load in a Bosnian sample, to determine the internal consistency of this instrument and to determine whether the instrument predicts learning outcomes. The participants were 75 undergraduate students from the Department of Psychology, University of Sarajevo. Data was collected using the Questionnaire for the Measurement of Intrinsic, Extraneous and Germane Load developed by Leppink, Pass, Van der Vleuten, Van Gog & Van Merrienboer [15] and a Brief Test of Knowledge developed for the purpose of the present study. Results of a confirmatory factor analysis support a three-dimensional model, with the item loadings in the expected manner. The factor structure obtained in our study is consistent with the factor structure reported by Leppink et al. [15]. In addition, the scale items showed good internal consistencies. The results obtained in our study suggest that low intrinsic in combination with high germane scores contribute to learning outcome. High complexity of learning material in combination with not well-organized prerequisite knowledge causes lower investment of germane cognitive resources, i.e. learning process, and consequently lower learning outcome. Overall, despite a relatively small sample size, the results of our study show a clear three-factor structure that corresponded to intrinsic, extraneous and germane cognitive load. The questionnaire could be an important instrument for research practice in domain of CLT. Moreover, the instrument has significant practical value. Educational practitioner can use the instrument in researching and planning their teaching to maximise learning.Keywords
Cognitive Load Theory, Cognitive Load, Measure of Cognitive Load
1. Introduction
Cognitive Load Theory (CLT; Paas & van Merriënboer
[1], Sweller, van Merriënboer, & Paas [2]) suggests that learning and instruction are most effective under conditions that are aligned with human cognitive architecture. Cognitive architecture includes two main memory systems: working memory and long term memory. Working memory has two major features: very limited capacity to process information at one time and rapid loss of information. If these limits are exceeded, working memory becomes overloaded, instruction becomes ineffective and learning inhibited. Although its capacity is limited, working memory is the central point of our thinking and learning. Long-term memory has virtually unlimited capacity. The main functions of long-term memory are storage of previously adopted knowledge organized in schemas, and storage of new knowledge and skills. Schemas are series of knowledge structures that enable problem solving and thinking. By virtue of knowledge stored in long-term memory during learning, working memory can function more efficiently and deal with much more information. Based on the basic features of cognitive architecture according to research conducted over the last 25 years, Sweller and co-workers developed a comprehensive set of instructional principles that makes instructional design more effective and facilitates learning (see Sweller [3], Pass et. al. [4], van Merrienboer, Sweller [5] for reviews of the CLT including major features of human cognitive architectures, general instruction implication and specific instructional methods).
determined by the degree of interactivity between essential elements of information relative to the level of learner´s prior knowledge in the domain. High element interactivity in presented information can generate high levels of IL and thus disable learning process. Extraneous load is working memory load imposed by the nature of instructional design used to present the material (Sweller et al.[7]). Inadequate instructional design can impose cognitive activities on a learner which are unnecessary, extraneous to the learning goals and disable the learning process. For example, when learners are required to split their attention between some interacting textual and graphic elements that have been separated either spatially or temporally, the integration of these elements provoke at least two parallel processes: 1) searching and recalling elements of information and 2) attending and processing other elements. Such processes might increase the unnecessary demands on working memory and impose extraneous load. Considering that no meaningful complex learning would likely occur without effortful cognitive processing and associated working memory load, cognitive load does not always interfere with learning but is also necessary for learning (Kalyuga [6]). In order to capture the intentional cognitive effort that leads to learning, a separate type of load was introduced, called germane load (Sweller et. al.[2]). According to the traditional definition, germane load is essential to learning via schema acquisition and automation (Kalyuga [6]). Germane load should be increased in order to enhance learning.
Since total mental capacity is limited, the total cognitive load associated with an instructional design should stay within working memory limits. Instructional design can be manipulated to balance these three forms of load to maximize learning efficiency. Demands caused by IL and EL which overload the resources of working memory can lead to the learner's incapacity to engage in activity imposing GL (VanMerrienboer et Sweller [5]). Intrinsic load should be optimized by learning tasks that correspond with learners’ prior knowledge (Kalyuga [8]) whereas extraneous load should be minimized (Pass, Renal, et Sweller [4]). When IL is optimal and EL is low, learners can engage in knowledge elaboration (Kalyuga [8]) which imposes GL and facilitates learning. For example, less knowledgeable learners may learn better from worked examples or from completing partially solved examples (problem competition effects; Pass [9]), whereas more knowledgeable learners may learn better from autonomous problem solving (expertise reversal effect; Kalyuga, Ayers, Chandler, & Sweller [10]). Redundant information which does not contribute to learning imposes EL (redundancy effect; Sweller, Ayres, Kalyuga [7] ). Presenting instructional content in such a way that learners need to split their attention between two or more mutually referring information sources lead to higher EL (split-attention effects; Sweller, Chandler, Tierney, & Cooper [11]).
Despite the huge body of experimental research
supporting the validity of CLT, the theory has been the subject of criticism regarding its conceptual clarity (Schnotz and Kürschner [12]) and methodological approaches (Gerjets et al. [13]). One of the central issues is the measurement of cognitive load. In many studies there is no direct measurement of cognitive load and thus the level of cognitive load is indirectly obtained from results on knowledge post-tests (de Jong [14]). Adequate measurement of the different types of cognitive load is of both theoretical and practical importance. From a theoretical point of view, the different types of cognitive load are the central constructs of CLT, and thus it is highly important to have psychometrically sound instruments for measuring the different types of cognitive load. On the practical side, instruments are needed for educational researchers and instructional designers to evaluate different instruction designs and the amount of load they induce for learners.
Methods for measuring cognitive load can be classified in three categories: measuring cognitive load through self-reporting, physiological measures as indications for cognitive load and dual tasks for estimating cognitive load (deJong [14]). Measuring cognitive load through self-reporting is the simplest and the most economical method for measuring different types of cognitive load. Over the last 30 years, various methods self-reporting have been developed and used to measure cognitive load.
Measuring cognitive load through self-reporting is based on the assumption that learners can accurately report the amount of mental effort they experienced while performing a task. These techniques use self-rating scales to report the experienced effort. The most frequently used self-rating uni-dimensional scale was introduced by Pass [9]. Although Pass et al. [4] claim that the scale is reliable, sensitive to small differences in cognitive load and valid, the use of a uni-dimensional scale was criticized by deJong [14], who concluded that there are many variation in how self-reporting is applied and, most importantly, there are questions about what is really measured. Different authors have used different scales varying in both number of categories and labels. This is problematic, especially because some of these scales have not been validated (Leppink et al [15]). In addition, inconsistent results from these studies raise doubts whether learners can themselves distinguish between different types of load (deJong [14]).
Out of ten items, three measure IL, three EL and four GL. The new scale Leppink et al. [15] tested in a series of four studies. The results of an explanatory and confirmatory factor analysis support a three-factor model. A cross-validation study conducted on a different cohort and during different lectures also indicate the same structure but with somewhat different correlations between factor pairs and residual covariance across lectures. Finally, an experimental study provides additional support for the three-factor solution. Overall, the results showed that this new instrument for measuring IL, EL and GL has a robust three-factor structure.
The present study
The aims of our study were: a) to confirm the factor structure of the instrument in a Bosnian sample (construct validity); b) to determine the internal consistency of the instrument; c) to determine whether the instrument predicts learning outcomes (predictive validity).
We expected that the results obtained in our study will support the three-factor solution, indicating that the instrument does measure different kinds of cognitive load, as well as good internal consistency, indicating good reliability of the instrument.
The third aim of our study was to test the predictive validity of the instrument. According to Sweller et al. [7], element interactivity and instructional format have cognitive loading consequences. IL is mostly determined by element interactivity, whereas instructional format is the main determinant of EL. Element interactivity determines EL in the case where element interactivity is unnecessary. The basic prediction made by CLT is that optimal IL and low EL increase learning effectiveness. Expertise reversal effect is not to be expected since there are no experts in the domain and the element interactivity is high. Lee et al. [16] demonstrated that there was no expertise reversal effect for higher complexity materials. In that case, relationship between IL and learning outcome could be more or less linear. In accordance with the above, we expected that IL and EL will be significant predictors but with negative contributions to learning outcomes. Optimizing intrinsic and decreasing extraneous load are a means to prevent cognitive overload and to free processing resources so that they can be devoted to learning (for processes such as schema construction and automatisation). Such a combination of IL and EL leaves more cognitive resources for GL that will generate learning processes and consequently more effective learning. We expected that GL would be significant predictor that contributes to learning outcomes.
2. Method
2.1. ParticipantsThe study was conducted on a group of 75 undergraduate
students who took a Statistics course at the Department of Psychology, University of Sarajevo. Of the total number of participants 85.7% were females. The average age of the participants was M = 19.26 (SD = 0.94.)
2.2. Measures
The questionnaire for measurement of intrinsic, extraneous and germane load (QMIEGL) was developed by Leppink, Pass, Van der Vleuten, Van Gog & Van Merrienboer [15] for measurement of three types of cognitive load in complex knowledge domain. The intrinsic and extraneous types of load were measured with three items each, whereas germane load was measured with four items. The QMIEGL items were translated into the Bosnian language by the authors of this article and back-translated by an English language teacher at the Department of English Language, University of Sarajevo. After slight correction of the first version, the final version QMIEGL was prepared for the research.
A Brief Test of knowledge (BTK) was developed for the purpose of present study. The five items examined the concepts and definition relevant for the attended lecture as well as formulas and their application.
2.3. Procedure
Data was collected during a regular class of Statistics in Psychology. Students attended a lecture on basics of the sampling distribution of the mean. The lecture lasted 45 minutes. Students completed the QMIEGL at the very end of the lecture. A brief oral instruction was provided to emphasize that each of the items referred to the lecture that students had attended. The students earned credits for participating in the research.
3. Results
3.1. Data Screening
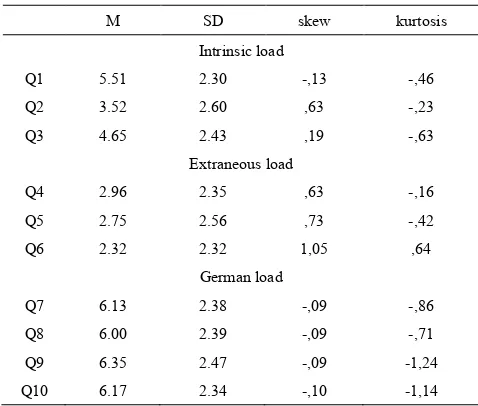
Table 1. Means, standard deviations, skewness and kurtosis
M SD skew kurtosis
Intrinsic load
Q1 5.51 2.30 -,13 -,46
Q2 3.52 2.60 ,63 -,23
Q3 4.65 2.43 ,19 -,63
Extraneous load
Q4 2.96 2.35 ,63 -,16
Q5 2.75 2.56 ,73 -,42
Q6 2.32 2.32 1,05 ,64
German load
Q7 6.13 2.38 -,09 -,86
Q8 6.00 2.39 -,09 -,71
Q9 6.35 2.47 -,09 -1,24
Q10 6.17 2.34 -,10 -1,14
The first three items (Q1 to Q3) refer to intrinsic load. The means ranged from M=3,52 to M=5,51. The following three items (Q4 to Q6) refer to extraneous load. These items are negatively worded. The means ranged from M=2,32 to M=2,96, which suggests that subjects perceived low extraneous cognitive load. Finally, the last four items (Q7 to Q10) refer to germane load. The means are higher compared to the items referring to IL or EL, and ranged from M=6,00 to M=6,35. Leppink et al. [15] found a similar pattern of means across subscales.
3.2. Confirmatory factor analysis
To test whether the hypothesized factor structure is supported by the data, a confirmatory factor analysis (CFA) was employed using AMOS. CFA was employed for the full data set and for the data without the one outlier. Removal of outlier did not substantially affect the model fit, so results of CFA obtained on the full data set will be presented.
The three-factor model was fit to the data to obtain evidence that the items are measuring cognitive load as three separate factors, as previously reported by Leppink et al. [15]. It is expected that the three subscales were correlated, hence, a three factor correlated model was tested. This model was compared to a single-factor model.
Seven indices are commonly used to examine model fit, and these are shown in Table 2: chi-square (χ2), chi-square normalized by degrees of freedom (χ2/df), goodness of-fit index (GFI), adjusted goodness-of-fit index (AGFI), comparative fit index (CFI), Tucker-Lewis index (TLI), and root mean square error of approximation (RMSEA). As the χ2test is an absolute fit index that is sensitive to sample size (Hu &Bentler, [18]), the chi-square/degrees of freedom ratio (χ2/df) is often used and should not exceed 5.0 to demonstrate good fit (Bentler and Bonett [19]). Bentler and Bonett [19] recommended GFI and CFI value 0.90 or higher and AGFI of 0.80, while Hu and Bentler [20] suggested the value of 0.95 for CFI and GFI. It is recommended the RMSEA value be .08 or less (Browne &Cudeck,[21]; Hu &Bentler, [18]), while Brown and Cudeck [22] suggested RMSEA of 0.10 or lower. Arbuckle [23] suggested that GFI, TLI, and CFI should be equal or close to 0.90.
Table 2 shows the fit indices for the three-factor model: χ2/df =2,043, GFI=0,864, AGFI=0,766, CFI=0,943, TLI=0,920 and RMSEA=0,119, indicating poor model fit.
In order to check whether any possible improvement for the three dimensional model was available, diagnostic measures were also examined: the standardized loadings, standardized residuals and modification indices.
According to general rule of thumb, each factor loading should be statistically significant and with a size of 0,50 or higher (Hair et al. [24]). All items loaded in range from 0,728 to 0,961 on the hypothesized factors, indicated that there are no items that classify for removal. There is no residual covariance between items exceeding the recommended cutoff of |2| .Further, a high modification index for error terms (21,420) was found between error terms for items Q9 and Q10.
Regarding the high modification index for error terms for items Q9 and Q10, the model was modified to add an error covariance between these two items. Table 2 shows the fit indices for the modified three-factor model.
The indices shown in Table 2 suggest that the modified 3-factor model has a better fit with the data when compared to the original model and the indices of fit suggest that this model fits the data. For the modified three-factor model χ2/df =1,325, GFI=0,909, AGFI=0,839, CFI=0,983, TLI=0,975 and RMSEA=0,066, indicating adequate model fit.
Table 2. Fit Indices for three-dimensional models
χ2 df χ2/df GFI AGFI CFI TLI RMSEA
Three-dimensional model 65,385 32 2,043 ,864 ,766 ,943 ,920 ,119
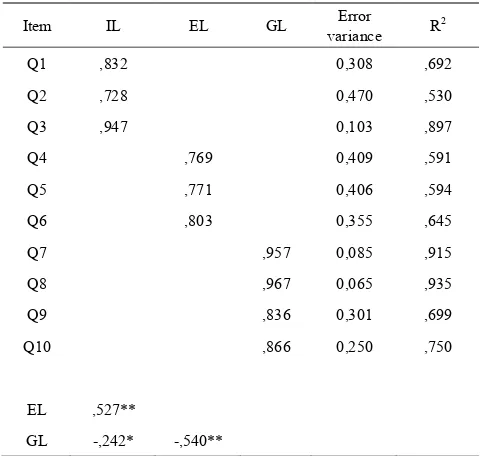
[image:4.595.66.547.626.702.2]Table 3. shows standardized regression weights, standardized error variances, squared multiple correlations and factor intercorrelations. All the items functioned in the expected manner and contributed significantly to the measurement of the latent factor. The factor loadings on items that measure GL are from 0, 84 to 0,96, the loadings for items that measure EL are from 0,77 to 0,80 and the loadings for items that measure IL are from 0,53 to 0,90. There was one correlated error. Results show that there is significant correlation between EL and IL (r=0,527), between EL and GL (r=-,540) and between GL and IL (r=-0,242). The correlation between the error terms for items Q9 and Q10 was r=0,565.
Table 3. Standardized Regression Weights, standardized error variances, Squared Multiple Correlations and Factor intercorrelations
Item IL EL GL variance Error R2
Q1 ,832 0,308 ,692
Q2 ,728 0,470 ,530
Q3 ,947 0,103 ,897
Q4 ,769 0,409 ,591
Q5 ,771 0,406 ,594
Q6 ,803 0,355 ,645
Q7 ,957 0,085 ,915
Q8 ,967 0,065 ,935
Q9 ,836 0,301 ,699
Q10 ,866 0,250 ,750
EL ,527**
GL -,242* -,540**
3.3. Reliability Analysis
To assess internal consistency, Cronbach’s alpha coefficients for the subscales were estimated using SPSS 20. Very high Cronbach’s alpha values were obtained for all the subscales: IL(α=0,868), EL(α=0,824) and GL(α=0,959). These values were larger than the cut-off point of α=0.70 for reliability (Hair, Anderson, Tathom, & Black, [25]) and were higher than the values reported by Leppink et al.[16].
3.4. Predictive Validity
Following the recommendation given by Tabachnik and Fiedel [26], a stepwise multiple regression analysis was done with three independent variables (IL, EL and GL) and one dependent variable (total score on BKT). Prior to the main analysis, an evaluation of assumption was conducted. No violations of normality, linearity, homoscedasticity or independence of residuals was found. The intercorrelations between the three measures of cognitive load and the BKT are shown in table 4.
Table 4. Intercorrelations between three measure of cognitive load and total score on test from
BKT IL EL
IL -.397**
EL -.337* .471**
GL .480** -.215* -.471**
The stepwise multiple regression shows that the best model is found if EL is removed, and only GL and IL are used. The multiple correlation found between the BKT score (DV), and germane and intrinsic loads (IVs) is r= 0,567. This correlation is statistically significant and explains 32,1% of the variance of the BKT score {cR2=0,301; F(2,69) = 12,388; p(F) < 0,001}. Table 5 shows that the beta-weights of GL (β=0,414) and IL (β=- 0,308) are statistically significant. Table 5. Regression coefficients in the final step of stepwise multiple regression
Variables in the equation Independent
variables B SE B beta t-value p
German load .276 .068 .414 4.071 .000
Intrinsic load -.210 .069 -.308 -3.034 .003
(Constant) 1.686 .596 2.828 .006
4. Discussion
The aims of our study were to assess the factor structure of the new instrument for measure IL, EL and GL, originally developed by Leppink et al. [15] in a Bosnian sample, to determine the internal consistency of this instrument and to determine whether the instrument predicts learning outcomes.
[image:5.595.57.297.265.493.2] [image:5.595.308.553.292.371.2]of the third factor (GL) in the factor structure requires additional clarification by CLT theorists.
Inspection of the factor correlation matrix reveals some interesting results. The correlation between IL and EL is statistically significant, moderate in magnitude and somewhat higher than in the Leppink et al. [15] study. This result is to be expected due to the high level of element interactivity in the learning material used. Statistical reasoning about the standard error of the arithmetic mean requires the student to combine earlier course topics such as sample, population, sampling, distribution and variability. This is not an easy task especially because, as Chance, B., delMas, R., Garfield, J. [25] stated, their understanding of those earlier topics is often shallow and isolated. Therefore, it is plausible that the learning material used has a high level of element interactivity. As already stated, IL is determined by element interactivity, whereas instructional format is determined by EL. However, the extraneous cognitive load is also determined by the levels of element interactivity in this case when element interactivity is unnecessary for achieving learning goals (Sweller et al. [7]). In line with this, prior knowledge is an important variable which could explain the result obtained in our study. According to Kalyuga [6] more knowledgable students have more elaborated knowledge and therefore expected to experience lower IL. Organized knowledge is a prerequisite for learning new statistical concepts. If prior knowledge is not well organized, learning new materials imposes IL and EL.
The correlation between EL and GL is statistically significant, moderate and negative, and quite high compared to the results reported in the Leppink et al. [15] study. The results we obtained were expected. An increase in EL led to less cognitive recourses to invest in learning process, i.e. to a decrease of GL. The obtained result could be explained by the complex nature of learning material as well as by prior knowledge. Lack of proper understanding of earlier course topics inhibits proper statistical reasoning of the new topic, inhibits germane cognitive processes and finally inhibits learning.
The correlation between IL and GL is statistically significant, low and negative. Leppink et al. [15] report a somewhat higher and positive correlation between IL and GL. Germaine load belongs to those working memory recourses that are devoted to information that is relevant to learning (Sweller, [7]). On the other side, IL is imposed by the nature and structure of the learning materials. CLT states that the relationship between these two kinds of load is not linear. There will be no GL (i.e. learning will not happen) when IL is very low as well as when IL is very high (the learner will experience too much CL). In other words, the relationship between IL and GL is moderated by element interactivity relative to the level of the learner´s prior knowledge. However, using plots to check linearity suggests a linear relationship between IL and GL in our study. Due to the complexity of the learning material and probably insufficient understanding of the prerequisite concepts, it seems that the pattern of results captures the decreasing part
of the curve that describes the relationship between IL and GL. In a future study it would be interesting to examine the relationship between IL and GL as element interactivity and level of prior knowledge varied.
The results obtained in our study suggest that low IL in combination with high GL contribute to learning outcome. High complexity of learning material in combination with poorly organized prerequisite knowledge causes lower investment of germane cognitive recourses, i.e. learning process, and consequently lower learning outcome.
However for future research some shortcomings of this study should be taken into account. First of all, in order to improve generalizability the research should be repeated on a bigger sample. However, despite the relatively small sample size, the results of our study show a clear three factor structure that corresponds to IL, EL and GL. Further, the gender structure of our sample meant we could not test gender differences in cognitive load. Actually, the current state of affairs of CLT fails to acknowledge the importance of gender differences in cognitive load. Future research should consider this issue. Finally, as Leppink, et al [15] state, the instrument can be adapted to measure CL while teaching other scientific disciplines, not just statistics. If instrument is validated while teaching other scientific disciplines then it can be widely used for evaluating teaching methods.
As stated in the introduction, this is the first self-report instrument that enables us to measure the three kinds of cognitive load. Therefore this questionnaire could be an important instrument for research practice in domain of CLT, because deeper understanding of the cognitive processes evoked during learning requires more information about different types of cognitive load. Moreover, the instrument has significant practical value. Information can be collected and used for managing cognitive load in instructional programs. Considering the simple format and ease of administration, the educational practitioner can use the instrument in researching and planning their teaching to maximize learning.
REFERENCES
[1] Paas FG, Van Merriënboer JJ. Instructional control of cognitive load in the training of complex cognitive tasks. Educational psychology review. 1994 Dec 1;6(4):351-71. [2] Sweller J, Van Merrienboer JJ, Paas FG. Cognitive
architecture and instructional design. Educational psychology review. 1998 Sep 1;10(3):251-96.
[3] Sweller J. Element interactivity and intrinsic, extraneous, and germane cognitive load. Educational psychology review. 2010 Jun 1;22(2):123-38.
[5] Van Merrienboer JJ, Sweller J. Cognitive load theory and complex learning: Recent developments and future directions. Educational psychology review. 2005 Jun 1;17(2):147-77. [6] Kalyuga S. Cognitive load theory: How many types of load
does it really need?. Educational Psychology Review. 2011 Mar 1;23(1):1-9.
[7] Sweller J., Ayres P.L., Kalyuga S. Cognitive load theory, 1st, New York: Springer, 2011
[8] Kalyuga S. Managing cognitive load in adaptive ICT-Based learning. Journal of Systemics, Cybernetics and Informatics. 2009;7(5):16-21.
[9] Paas FG. Training strategies for attaining transfer of problem-solving skill in statistics: A cognitive-load approach. Journal of educational psychology. 1992 Dec;84(4):429. [10]Kalyuga S, Ayres P, Chandler P, Sweller J. The expertise
reversal effect. Educational psychologist. 2003 Mar 1;38(1):23-31.
[11]Sweller J, Chandler P, Tierney P, Cooper M. Cognitive load as a factor in the structuring of technical material. Journal of Experimental Psychology: General. 1990 Jun;119(2):176. [12]Schnotz W, Kürschner C. A reconsideration of cognitive load
theory. Educational Psychology Review. 2007 Dec 1;19(4):469-508.
[13]Gerjets P, Scheiter K, Cierniak G. The scientific value of cognitive load theory: A research agenda based on the structuralist view of theories. Educational Psychology Review. 2009 Mar 1;21(1):43-54.
[14]De Jong T. Cognitive load theory, educational research, and instructional design: some food for thought. Instructional science. 2010 Mar 1;38(2):105-34.
[15]Leppink J, Paas F, Van der Vleuten CP, Van Gog T, Van Merriënboer JJ. Development of an instrument for measuring different types of cognitive load. Behavior research methods. 2013 Dec 1;45(4):1058-72.
[16]Bandalos, D. L., & Finney, S. J. Factor analysis: Exploratory and confirmatory. In G.R. Mueller RO, Hancock GR. The
Reviewer's Guide to Quantitative Methods in the Social Sciences. Routledge; 2010.Bentler PM. EQS structural equations program manual. Multivariate Software; 1995. [17]Aguinis H, Gottfredson RK, Joo H. Best-practice
recommendations for defining, identifying, and handling outliers. Organizational Research Methods. 2013 Jan 14:1094428112470848.
[18]Hu LT, Bentler PM. Cutoff criteria for fit indexes in covariance structure analysis: Conventional criteria versus new alternatives. Structural equation modeling: a multidisciplinary journal. 1999 Jan 1;6(1):1-55.
[19]Bentler PM, Bonett DG. Significance tests and goodness of fit in the analysis of covariance structures. Psychological bulletin. 1980 Nov;88(3):588.
[20]Hu LT, Bentler PM. Fit indices in covariance structure modeling: Sensitivity to underparameterized model misspecification. Psychological methods. 1998 Dec;3(4):424. [21]Browne MW, Cudeck R. Alternative ways of assessing model
fit. Sage focus editions. 1993 Feb 1;154:136-.
[22]Browne MW, Cudeck R. Alternative ways of assessing model fit. Sociological Methods & Research. 1992 Nov 1;21(2):230-58..
[23]Arbuckle, J. (2009). Amos 18 user's guide. Armonk: SPSS Incorporated.
[24]Hair, J.F., Anderson, R.E., Tatham, R.L. & Black, W.C. Multivariate data analysis (7th ed.). New Jersey: Prentice-Hall 2010
[25]Chance B, del Mas R, Garfield J. Reasoning about sampling distribitions. InThe challenge of developing statistical literacy, reasoning and thinking 2004 (pp. 295-323). Springer Netherlands.