MUHAMMAD SYAUQAT BIN ABD KHALID
A thesis submitted in
fulfillment of the requirement for the award of the
Master of Electrical Engineering
Faculty of Electrical and Electronic Engineering
Universiti Tun Hussein Onn Malaysia
v
ABSTRACT
ABSTRAK
vii
TABLE OF CONTENT
TITLE i
DECLARATION ii
DEDICATION iii
ACKNOWLEDGEMENT iv
ABSTRACT v
ABSTRAK vi
TABLE OF CONTENT vii
LIST OF FIGURE x
LIST OF SYMBOLS AND ABBREVIATIONS xiii
LIST OF APPENDICES xiv
CHAPTER 1 INTRODUCTION 1
1.1 Introduction 1
1.2 Project Background 2
1.3 Problem Statements 4
1.4 Project Objectives 5
1.5 Project Scopes 6
CHAPTER 2 LITERATURE REVIEW 7
2.1 Introduction 7
2.2.1 Metal Pushing V-Belt (MPVB) 8
2.2.2 Changing Speed Ratio 9
2.2.3 CVT Power Transfer 11
2.3 CVT Testing Device 15
2.4 Determination of CVT Pulley Radius 16 2.5 Present Research on Continuously
Variable Transmission (CVT) 19
CHAPTER 3 METHODOLOGY 21
3.1 Introduction 21
3.2 Project Methodology 21
3.2.1 Conventional Position Control System 22 3.2.2 Model of Belt-Pulley System 23 3.2.3 Gear System of Continuously Variable
Transmission (CVT) 30
3.2.4 Closed Loop Position Control of Continuously Variable Transmission (CVT) 34
3.3 Pole-Zero Characteristics 38
3.4 Time Domain Performance Specification 44
CHAPTER 4 RESULT AND ANALYSIS 46
4.1 Introduction 46
4.2 Continuously Variable Transmission (CVT) Position
Control System 46
4.2.1 Over-damped Response 47
4.2.2 Under-damped Response 52 4.3 Comparison of Variable Gearing System Represent by
ix
4.4 Design Specification for Position Control with
Continuously Variable Transmission (CVT) 60 4.4.1 Over-damped System Design 61 4.4.2 Under-damped System Design 63
CHAPTER 5 CONCLUSION 66
5.1 Conclusion 67
5.2 Recommendation 68
REFERENCES
LIST OF ABBREVIATIONS
D, d - Diameter
F - Force
J - Moment Inertia
L - Length
T - Torque
r - Radius
CVT - Continuously Variable Transmission EHD - Elastrohydrodymanic
x
LIST OF FIGURE
NO TITLE OF FIGURE PAGE
1.1 Lower Speeds 3
1.2 Higher Speeds 3
2.2 Van Doorne Metal Pushing V-Belt 8
2.3 (a) Under-Drive Pulley Ratio (b) 1:1 Ratio Pulley
(c) Over-Drive Pulley Ratio
10 10 11 2.4 CVT power transfer from the input to the load
through MPVB
12
2.5 MPVB segment and bands moving around the secondary pulley
13
2.6 CVT power transfer diagram 13
2.7 Compression and tension in MPVB in steady state condition
14
2.8 Schematic Diagram of the Experimental test rig 16
2.9 The Belt Geometry 17
3.1 Schematic Diagram of Conventional Position Control with Fixed Gear Train
22
3.2 Block Diagram of Closed Loop Position Control with Fixed Gear Train
23
3.4 Equivalent model of a belt drive 25
3.5 Simplified equivalent model of belt drive 30
3.6 Arrangement of CVT gearing system from motor to the load
31
3.7 Block diagram of motor connected to load through belt system
32
3.8 Reduced block diagram of motor connected to load through the belt system
32
3.9 Schematic Diagram of Closed Loop Position Control 34
3.10 System Block Diagram 36
3.11 Simplified System Block Diagram 37
3.12 Position Control System Employing Velocity Feedback
38
3.13 (a) Example of Step Response (b) Pole-Zero Plot
40 41 3.14 (a) Step Response
(b) Pole-Zero Plot
42 42 3.15 (a) Step Response of Non Dominant Pole
(b) Pole-Zero Plot
43 43 4.1 (a) Under-Drive Response of Over-damped
(b) Pole-Zero Plotting of Over-damped
48 49 4.2 (a)One to One Ratio Response of Over-damped
(b) Pole Zero Plotting of Over-damped
50 50 4.3 (a) Over-Drive Response of Over-damped
(b) Pole-Zero Plotting of Over-damped
51 51 4.4 (a) Under-Drive Response of Under-Damped
(b) Pole-Zero Plotting of Under-Damped
52 53 4.5 (a)One to One Ratio Response of Under-damped
(b) Pole Zero Plotting of Under-damped Response
54 54 4.6 (a) Overdrive response of Under-damped Response
(b) Pole-Zero Plotting of Under-damped
xii
4.7 Comparison at Under-drive Stage 58
4.8 One-to-One Stage 59
4.9 Over-Drive Stage 60
4.10 Rise Time Characteristics for Over-damped Response
62
4.11 Settling Time Characteristics for Over-damped Response
62
4.12 Characteristic of Overshoot 63
4.13 Settling Time Characteristic of Under-damped Response
64
4.14 Rise Time Characteristic for Under-damped Response
LIST OF APPENDICES
APPENDIX TITLE PAGE
A Master Project’s Gantt Chart 73
B Parameters for Over-Damped Response 74
C Parameters for Under-Damped Response 75
D Simulation Result 76
CHAPTER 1
INTRODUCTION
1.1 Introduction
Continuously Variable Transmission (CVT) becomes one of the latest applications in automotive industries since 1460 which being develop by Leonardo Da Vinci. Due to the limitation of technologies in the earlier centuries, CVT is unsuitable for a car greater than 100 horse power. Todays, our national automobile company PROTON, has stated using CVT in their model. The new SAGA FLX run with CVT technology adapted the new technology in automotive technology history which is started by Nissan.
Engine transmission can be classified into two categories, “steeply” and
Continuously Variable Transmission (CVT) or the best word as manual and automatic transmission. The manual and automatic are classified in “steeply” transmission use gears as their mean to steeply vary the gear ratios. Manual gearboxes basically consist of six sets of gear trains, which are first, second, third, fourth, fifth and reverse gears while in automatic it have the same gear train but with less of number of gears.
Audi, Honda and also our national car manufacturer PROTON have use this technologies in their new model.
1.2 Project Background
Transmission development can be as simple as manual gear boxes but there always demand on more comfortable driving experience. Even the transmission technologies getting advance nowadays, they still have jerking while changing gear ratio causes uncomfortable drive. CVT is a type of automatic transmission that provides more usable power better fuel economy and better driving experience than the traditional automatic. The main concept of CVT is by constantly relate between the engine speeds to the car speed, by which allowed it operated independently and therefore the engine can operated at its most fuel operating point. Torotrak Development Ltd. (2006) claimed that 20% less fuel consumption in CVT compared with conventional automatic transmission by then reduces the harmful emission.
The furthermore, while driving a car with CVT system, the passenger never feel or hear the transmission shift which is it simply raises or lowers the engine speed as needed, and calling higher up for better acceleration while calling down for fuel efficiency, by which is drop 4% in urban driving environment while drop 10% on highways. This provides CVT a quicker acceleration compare with the conventional automatic or manual transmission.
3
[image:14.612.236.433.153.352.2]notice as higher gear. The drive pulley connected to the engine and the driven to the wheel of the vehicle.
Figure 1.1: Lower Speeds
[image:14.612.233.433.417.616.2]A new belt was developed by Van Doorne known as Metal Pushing V-Belt (MPVB) replaced the earlier rubber belt develop by DAF in 1958. This kind of belt consist of a large number of thin flat segments, which held together by two packs of steel band, each pack containing eight to ten bands for flexibility.
Van Doorne formed a consortium with Fiat and Borg-Warner in mid’70s to develop a CVT based on the belt was design by him [9]. The belt system can be described as a mechanism to adjust the drive and driven sheaves. Both side attached to a spring loaded and torque sensitive mechanism. The driver sheaves would typically connect to a centrifugally actuated control. At idle speed, the drive sheaves halves are separated and no power is transmitted. When the engine speed increases, the sheaves are bought together, which set the belt at minimum sheaves radius, provide maximum speed reduction and maximum torque.
As the engine power increase further, the centrifugal actuated continues to move the sheaves halves closer, while the driven sheaves move further apart as response to the increasing of belt tension. In this project, a mathematical modeling of a position control system based on CVT and applied to arm robot as the load was introduced. The control algorithm will replace the conventional position control strategy using fixed ratio into variable gears train. Based on develop model, the stability and performance analysis will be conducted. By studying and modeling the CVT concept, arm robot can be controlled with an alternative system by just need little understanding about the belt-pulley system.
1.3 Problem Statements
5
In the conventional positioning control, a fixed gear train has been use that is in the ratio of spur and pinion. This gear train functions to transfer the power from the motor to the load. This cause from the error between the output position and the reference input, then this error will be amplified and make the motor to move according the error and finally adjust the position. The issue here is, instead we are using fixed gear and other controller, is that an alternative way by varied the ration of the gears train to control position of a load.
This similar concept is applied to a car engine that used CVT compared with a conventional automated transmission car. A passenger in a car with conventional automated transmission will fell the shifting gear when the car accelerate, and that situation still will happened if a car with CVT is used. So, we applied the same concept use in car manufacturer to the conventional position control system. Therefore in this project, we are develop a mathematical modeling of a position control by using variable gearing ratio has been use in CVT. We also interested to know either there have any point of improvement when people design a position control algorithm using variable ratio system compared to fixed ratio in their system.
1.4 Project Objectives
The main objectives of this project are:
a) To develop a mathematical model of position control based on continuously variable transmission (CVT).
1.5 Project Scopes
There are two limitations of this project are:
a) Parameter:
This project developed a position control instead of speed control. b) Application
CHAPTER II
LITERATURE REVIEW
2.1 Introduction
Most literature publish on CVT usually discussed on speed control of their system that be applied for automotive application. It’s control strategy, advantages and disadvantages, variable speed control at different driving condition, system stabilities, performance and limitation of the system but very few really when into engineering aspects such as, mechanical and design aspects of the metal pushing V-belt itself. This literature will focus on mechanism of Continuously Variable Transmission (CVT). Author believed that by knowing the mechanism of CVT, the better understand on now this system would be.
2.2 CVT Mechanism
The Van Doorne metal pushing V-belt CVT comprises an endless composite metal belt with two pair of variable V-shape pulleys (secondary and primary). The
illustration of endless metal pushing V-belt as in Figure 2.1 that wound around both pulleys. The input pulley is usually called the primary pulley that driving the
one-half of each pulley are fixed to the shaft while the other half are adjustable as it can be slide along their respective shafts.
The axially adjustable V-shaped pulleys enable the MPVB to slide radially outwards or inwards. Thus, the effective belt radius can be sleeplessly adjusted. General control has been designed in such way that the primary pulley determine the speed ratio while at the secondary pulley, ensured that the proper belt tension always be maintained to prevent slipping [21].
2.2.1 Metal Pushing V-Belt (MPVB)
[image:19.612.248.411.481.590.2]The belt that was designed by Van Doorne basically comprises two sets of thin metallic band strips and a number of thin metallic plates (segment) as illustrated in Figure 2.2 below. The entire segment a bend together by two sets bands through the segments location slots. This situation allowed the segment to slide freely along the sets of bands. Noted, the number and the size segments and the number of band strips determine the MPVB power capacity class. Now there is range of belt configuration available in the market has been inspired by the Van Doorne Belt.
9
2.2.2 Changing Speed Ratio
Continuously Variable Transmission (CVT) gets inspired by belt-pulley system. The belt shape itself, make the inner faces of the pulley sheaves angle inward to form a V shape belt groove. During gear changes, the belt must adjust its position on the pulleys and slides over the surface of the pulleys. In order to make it slide nicely, a thin lubricant oil film is covered at the surface of the pulley to minimize the wear of interface [2]. However, the present of lubricant oil may reduce the torque transferring friction. Thus, it needs a large clamping force on the pulleys, as to prevent belt slip to be occurred.
Computer-controlled hydraulic system used to control the CVT ratio by pushing together the sheaves of the pulley which cause the steel belt to ride freely outward or inward from the shaft. The variation of pulley diameter either increase or decrease make the possible of changing gear ratio (speed ratio) continuously, rather than step wise as present in conventional automatic vehicles.
(a)
(b)
Input Pulley
11
[image:22.612.148.416.70.301.2](c)
Figure 2.3: (a) Under-Drive Pulley Ratio (b) 1:1 Ratio Pulley
(c) Over-Drive Pulley
2.2.3 CVT Power Transfer
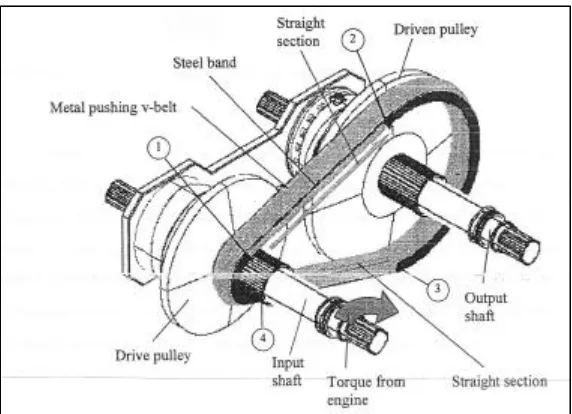
CVT structure basically includes an input shaft delivering power from engine to the output shaft which connected to the vehicle wheel through the final drive train. Each shaft includes of a pair of pulleys, driven pulleys and driving pulleys,
transferring power from the input shaft the output shaft through the metal pushing V-belt as shown in Figure 2.4. The V-belt being squeezed by the driven pulleys to ensure the torque from the input shaft then flows and converting as a force to the segment through the interfacial contact between the primary pulleys cone surfaces and the segment sides.
Sliding Pulley
Figure 2.4: CVT power transfer from the input to the load through MPVB
13
Figure 2.5: MPVB segment and bands moving around the secondary pulley
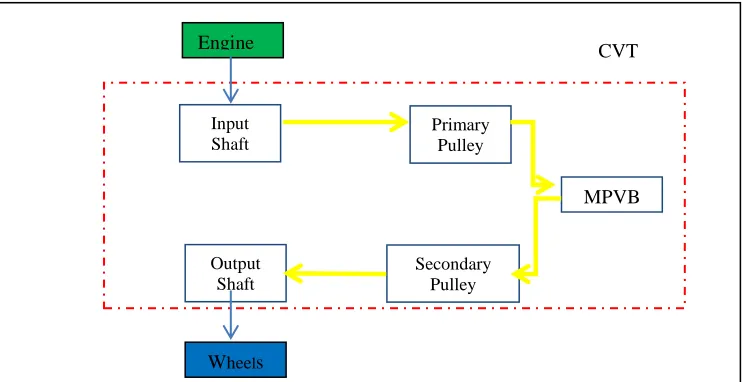
The force then flows through each segment by pushing against each other forward, via their rocking edge and surface contacts. Then, the force flows to the secondary pulleys through the interfacial contacts between the segment sides as shown at driven pulley in Figure 2.4 and 2.5 which this secondary pulleys cone surfaces converting it back as a torque. Finally, the torque then flow to the output transmission shaft to the vehicle wheel through the final drive train. Figure 2.6 shows summarize of CVT power transfer diagram as explained recently.
Figure 2.6: CVT power transfer diagram
Engine
Input Shaft
Primary Pulley
MPVB
Secondary Pulley Output
Shaft
CVT
[image:24.612.148.519.500.691.2]Figure 2.4 also shows that the belt can divide into four different regions which lie between the four stations, the section on the primary pulleys, two straight sections and secondary pulley [14]. These four stations indicated which the compression or tension in the belt change linearly.
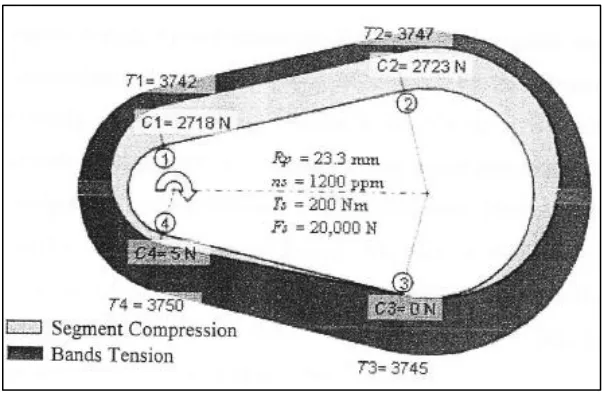
[image:25.612.182.485.443.640.2]Figure 2.7 shows the compression and tension in MPVB from Micklem CVT modeling analyses using ETD theory. Refer to the figure, the bands tension is always greater than the segment compression in all section and stations when the belt is running. Compression in segments is increase from station four to one because of the transfers from drive pulley to the belt. Then, the segments deliver the torque in compression force form to the driving pulley. This action cause compression force transfer nearly constant and its can be seen in straight line started from station one till station two. Station two to station three, the compression force is decrease due to the compression force has converted back as a torque and transfer it to the driving pulley. There is no compression in segments in station three as the segments are unloaded at the exit from the driven pulley (station 3) and will be carried forward by the faster moving bands until they meet the segments ahead [14].
15
The metal segments must have sufficient transverse compressive strength to withstand the axial loads required to generate adequate frictional forces. A potential durability problem exists if friction forces are inadequate. Skidding of the metal belt against the pulley may cause galling which could lead to rapid belt or pulley failure. Friction forces must be sufficiently high to guard against skidding caused by sudden torque impulses from potholes, spinning wheels or driver abuse. Sufficient tangential force can be generated by squeezing the belt tighter between the faces of the pulleys. This action required greater axial force in order to transmit higher power from input pulleys to output pulleys. However, the normal contact stresses between the belt segments and the pulleys becomes limiting as axial forces increase. Excessive forces will lead to reduced life due to fatigue and wear [9].
2.3 CVT Testing Device
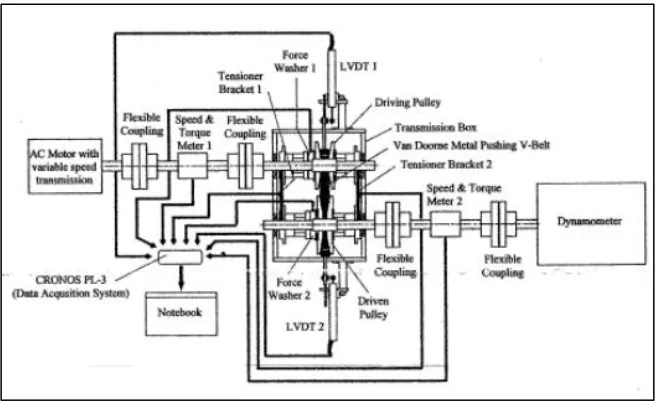
Numbers of experimental techniques have been developed to measure a CVT
performance. Most of the techniques depend on what parameters want to be measure. A simple experimental technique which uses only a torque meter can only measure CVT transferable torque and its efficiency. More complicated experimental which uses more instrumental devices can be measure more parameters such as belt radius, bands tension, segment compression, transferable torque, belt loses, belt slip, CVT efficiency, sufficient amount of clamping force and many more.
Figure 2.8 Schematic Diagram of the Experimental Test Rig
2.4 Determination of CVT Pulley Radius
Refer to research done by Mohd Azwir (2006), in order to determine the effective ratio of Continuously Variable Transmission (CVT) at both pulley, some formulation has to be considered. As shown in Section 2.2, the power transmission of CVT from engine to the wheel may involve few stage of speed ratio.
17
[image:28.612.167.501.215.422.2]Next stage is to obtain the specific sizes of power transmitting plates by knowing the mechanism of belt itself. There is an effective line on the Metal Pushing V-Belt (MPVB), which claimed that each segment is continuously connected to its adjacent calculation for obtaining speed ratio based on this line. Figure 2.8 shows MPVB as a continuously line passing through around the two pulleys.
Figure 2.9: The Belt Geometry
The belt lengths can be expressed as in Equation 1 by developing a geometrical relation above. Two assumption need to be considered:
i) No belt elongation occurs during operation ii) Effective line is continuous along the pitch line
√
where
- radius of belt at primary pulley
- radius of belt at secondary pulley - angle of lap on a primary pulley
- angle of lap on secondary pulley - pulley center distance
- angle of belt at straight line
The parameters that are already know are the belt length and itscenter distance while the other are unknown. Other relation needs to be considered
Substituted above equation into Equation 1 will give;
√
√
( )
Equation 5 is used to determine the angle of the belt at straight line, , with a specific radius of belt at primary pulley. This equation cloud not easily be done by normal mathematical approach but must be done using iteration method using software such as Microsoft Excel. A series of that varying from minimum to
maximum pulley diameter is arranged in one column as shown in Appendix C. Then, some initial value for were set up at next column. Equation 5 is then inserted into third column and by clicking solver at tools menu, the value of can be obtained using iteration method. Thus, then substituted in Equation 6, which has been rearranged from Equation 4 to get the value of secondary pulley.
(2)
(3)
(4)
(5)
19
2.5 Present Research on Continuously Variable Transmission (CVT)
Continuously Variable Transmission (CVT) advantage in automotive has get many interest by control system researcher to implement this technology into their field of interest. Many of them apply CVT in speed control as it main advantages may result good fuel efficiency. Research conduct by Zhou & etc. (2006), they developed a CVT modeling and do a simulation study to control the speed of the engine. They aim the vehicle will run with minimum fuel consumption and good power performance. Whole vehicle dynamic model of CVT has been design including the engine, clutch, the CVT gearbox itself and the load. PD controller also be applied to get better performance. There have three steady speed of the car with meet the theoretical value that are 109.40 Km/h, 39.93 Km/h and 74.48 Km/h.
A group of researchers name as Drivetrain Research Group (DRG) from UTM developed a control system that may cause fuel efficiency vehicles. By taking the advantages of CVT with wider range of ratio, good fuel efficiency, shifting ratio continuously and smooth drive ability, They develop a nonlinear system by using Adaptive Neural Network Optimization Control (ANNOC) that indirectly control the engine speed by adjusting the CVT pulley ratio. The ANNOC is highly may control the engine satisfactorily [1].
A study on the velocity ratio control using CVT for tractor has been developed against to optimize the engine performance to get the maximum performance of the tractor. In accordance of the working features of agricultural tractors, a speed ratio regulation law has been formulated based on CVT and also the controller of the velocity ratio. They compared their system with the hardware and it works accordingly [32].
transmission ratio with high efficiency and also high power density with maximize tractive force at low speed. He using Takagi- Sugeno (TS) fuzzy observer by using LMI based condition for simulation study and then compared with the experimental result.
Among the latest research apply using CVT is by using it for hybrid electric car by introducing the control system and it working principle. An energy
CHAPTER III
METHODOLOGY
3.1 Introduction
The objective of this control system is to control the position of a mechanical load according to the reference position. The main goal is to replace the fixed gearing system into a variable gearing present by CVT. Derivation of the system with CVT based on the real system in the car and the complete transfer function the system evaluate in this chapter.
3.2 Project Methodology
called spur while the smaller is pinion. The gear ratio is given by the ratio of the number of the teeth of both wheels.
While variable ratio mostly apply continuously adjustable ratio of the transmission is required. Recently there are variety of mechanical solution such as Continuously Variable Transmission (CVT) and Hydraulic Transmission. By taking the advantages of CVT, a position control system was developed instead of speed control in recent application [12].
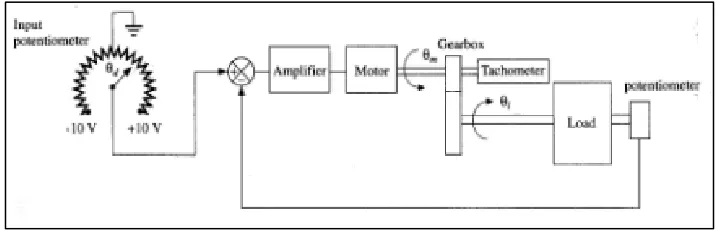
3.2.1 Conventional Position Control System
[image:33.612.154.513.486.601.2]Conventional position control system is a system to control the load position based of the variation of input to the system. As there have an error from the potentiometer refer to the reference point, motor will move to reflect the error. The value of error then been amplified and enough current will supply to the motor rotate the gear which then move the load. Load move according to the error within the input and output. Figure 3.1 illustrated the schematic diagram of this conventional position control using fixed gear system present by pinion and spur.
23
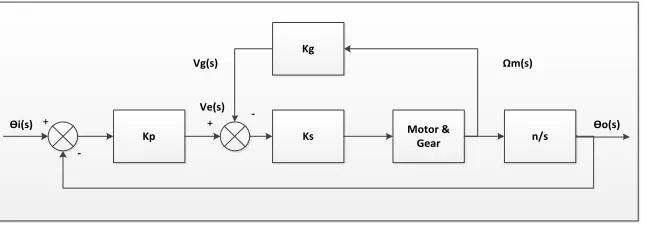
This gear train then been added up to the complete system with feedback to get a better system response. Figure 3.2 below shows the complete block diagram of closed loop position control and Equation 7 is the transfer function of the systems. As in the final transfer function, conventional position control system parameters that may influence the system are the potentiometer gain, Kp and the tachometer gain, Kg. The other parameters are fixed including the ratio of the gearbox. This system can be tuned by manipulating the both parameters in design process.
Kp Ks Motor &
[image:34.612.174.498.258.374.2]Gear Kg n/s Ve(s) + -+ -ϴi(s) Vg(s) Ωm(s) ϴo(s)
Figure 3.2: Block Diagram of Closed Loop Position Control with Fixed Gear Train
( )
3.2.2 Model of Belt-Pulley System
Continuously Variable Transmission (CVT) model from the belt-pulley system which consists of two pulleys connected with a belt. Same as the gearing function, belt system also have the large and small pulley then connect to motor and load. The force at the discs is created as the difference between the load force of the tight side and the slack side . These forces generate the torques and rotating
speed of the pulleys [12]. Figure 3.3 shows the schematic diagram of belt drive system.
Figure 3.3: Schematic Diagram of Belt Drive
This system then can be model as shown in Figure 3.4 below. The equivalent model has been simplified by stating few assumptions as below:
The belt is massless.
The shaft distance is constant.
The effect of the centrifugal forces is neglected.
The deformation of the wheels and the shafts is neglected compared to the belt
deformations.
Certain load status, the modulus of elasticity is constant over the total belt length, such as that Hooke’s law applies.
REFERENCES
[1] Ariyono, S., Tawi, K. B., Jamaluddin, H., Hussein, M., Supriyo, B. & Sudarto, H. (2007). Adaptive Neural Network Optimisation Control of ICE for Vehicle with Continuously Variable Trasmission. International Conference on Intelligent and Advanced Systems 2007, pp. 257-262.
[2] Azlan, M. A. (2003). Design A CVT Lubricant Test Device. University Putra Malaysia: Master’s Thesis.
[3] Brian, D. (2010) Dominant Pole Approximation. Retrieved on January 24, 2012, from http://web.mit.edu
[4] Cheever, E. (2010) Dominant Pole Approximation. Retrieved on January 12, 2012, from http://lpsa.swarthmore.edu
[5] Dorf, Richard C. (2010). Modern Control Systems. 12th. London: Pearson.
[6] Dragos, C. A., Preitl, S. Precup, R. E., Nes, C. S., Pirlea, D. and Paul, A. S. (2010). Control Solutions for Vehicles with Continuously Variable Transmission.
2010 11th International Symposium on Computational Intelligence and
Informatics (CINTI), pp. 157-162.
[8] Gopal, M. (2002). Control System: Principles and Design. 2th.. India: Tata McGraw-Hill.
[9] Gott, P. G. (1991). Changing Gears: The Development of Automotive Transmission. SAE Inc. Warrendale, pp. 269-369.
[10] Han, K., Ryu, W., Jang, I. G., Jeon, J., Kim, H. & Hwang, S. H. (2006). Experimental Study on the Shift Control Characteristics of CVT using Embedded System. SICE-ICASE International Joint Conference 2006, pp. 3652-3657.
[11] Hitoshi, S. & Masanori, S. (2008). Improving the Fatigue Strength of the Element of a Steel Belt for CVT by Cavitation Shotless Peening. Journal of Material Science, 43(14), pp. 1-3.
[12] Isermann, R. (2003). Mechatronic Systems Fundamental. London: Springer-Verlag London Limited.
[13] Jiang, Q., Hao, J. J., Tang, Q. L. & Tang, Y. F. (2010). Fault Diagnosis of Vehicles Continuously Variable Transmission Based on Mutual Information Entropy and Support Vector Machine. 2010 International Conference on Measuring Technology and Mechatronics Automation, pp. 240-244.
[14] Micklem, J. D.,Longmore, D. K., & Burrows, C. R. (1994). Modeling of the steel pushing V-belt continuously variable transmission. IMechE 1994, Proceedings Inst. Mech. Engineers Vol.208 Part C: pp13-27.
71
[16] Modak, G. S. & Sane, S. S. (2006). Mechanical Continuously Variable Transmission (CVT) for Parallel Hybrid Vehicle. Electric and Hybrid Vehicles ICEHV ’06 IEEE Conference, pp. 1-4.
[17] Schulte, H. (2010). LMI-based Observer Design on a Power-split Continuously Variable Transmission for Off-road Vehicles. 2010 IEEE International Conference on Control Applications, pp. 713- 718.
[18] Setlur, P., Wagner, J. R., Dawson, D. M. & Samuels, B. (2003). Nonlinear Control of a Continuously Variable Transmission (CVT). IEEE Transactions on Control Systems Technology, 11(1), pp. 101-108.
[19] Song, J. & Wang, C. (2008). Modeling and Simulation of Hydraulic Control System for Vehicle Continuously Variable Transmission. 3rd IEEE Conference: Industrial Electronics and Applications, pp. 799 – 803.
[20] Store, N., Cruz-Villar, C. A. & Rodriguez-Angeles, A. (2009). Optimal Design of a 3 Dimensional 4 Dof Cobot with Different Gears. Electrical Engineering, Computing Science and Automatic Control, CCE, 2009 6th International
Conference, pp. 1-6.
[21] Tawi, K. B. (1997). Investigation of belt misalignment effects on metal pushing V-belt continuously variable transmission. Ph. D Thesis, Cranfield University.
[22] Tawi, K. B. (2003). Continuously Variable Transmission (CVT) for automotive application. Research Project report, UTM Skudai.
[23] Takeshi, T. & Toru, O. (2006). 100g-100N Finger Joint with Load-Sensitive Continuously Variable Transmission. Proc. Of the 2006 IEEE International Conference on Robotics and Automation, pp. 976-981.
[25] Wang, C. & Li, B. (2010). Modeling and Simulation of the Improved CVT Ratio Control System. 2010 International Conference on Computer, Mechatronics,
Control and Electronic Engineering (CMCE), pp. 541-543.
[26] Wang, C., Si, C. & Z., L. (2010). Study on Stepless Speed Regulation Actuation Concept and Simulation of the Mini-car Power Split Automatic. 2010 3rd International Conference on Information and Computing, pp. 165-168.
[27] Yang, Y., Chen, H. & Chen, L. (2010). Dynamic Behavior of Belt Element and Band of Metal V-Belt CVT Based on ADAMS. 2010 2nd International Conference on Computer Engineering and Technology (ICCET).
[28] Yukawa, T. & Kumada, T. (2010). Continuously Variable Transmission Using Quadric Crank Chains. 2010 8th IEEE International Conference: Industrial Informatics (INDIN), pp. 1043-1048.
[29] Zhang, L., Li, H. & Li, G. (2009). The Control Theory and Implementation Method of Clamping Force on Metal Belt CVT. 2009 International Conference on Artificial Intelligence and Computational Intelligence, pp. 422-426.
[30] Zhao, L., Sing, J. & Liu, H. (2007). Simulation Study of Wind Power with Continuously Variable Transmission. 2nd IEEE Conference: Industrial Electronics and Application, pp. 2603-2605.
[31] Zhou, M., Wang, X. & Zhou, Y. (2006). Modeling and Simulation of Continuously Variable Transmission for Passenger Car. IFOST2006, pp. 100-103.
73
![Figure 2.2: Van Doorne Metal Pushing V-Belt [9]](https://thumb-us.123doks.com/thumbv2/123dok_us/8775818.901374/19.612.248.411.481.590/figure-van-doorne-metal-pushing-v-belt.webp)