The Effect of Simulation-based Learning on Prospective
Teachers’ Inference Skills in Teaching Probability
Timur Koparan
1,*, Gül Kaleli Yılmaz
21Department of Mathematics Education, Eregli Faculty of Education, Bulent Ecevit University, Turkey 2Department of Mathematics Education, Bayburt Faculty of Education, Bayburt University, Turkey
Copyright © 2015 by authors, all rights reserved. Authors agree that this article remains permanently open access under the terms of the Creative Commons Attribution License 4.0 International License
Abstract
The effect of simulation-based probability teaching on the prospective teachers’ inference skills has been examined with this research. In line with this purpose, it has been aimed to examine the design, implementation and efficiency of a learning environment for experimental probability. Activities were built on modeling, simulation and the expansion of the basic inference logic suggested by Cobb [4]. The quasi-experimental research method was used in the study. The study was conducted with 55 prospective teachers who attended the statistics classes in Bülent Ecevit University, Faculty of Education. A test with 5 open-end questions was developed with regard to the experimental probability in order to assess the efficiency of the designed learning environment in the study, and it was applied as pre- and posttests. The obtained data were supported by semi-structures interviews and observations. The efficiency of the simulation-based learning was determined through the comparison of the answers given by prospective teachers using papers and pencils and the answers given by means of simulations. The findings showed that simulation-based probability teaching increased the prediction and related inference skills of the prospective teachers and generally influenced the success of the students in a positive way.Keywords
Statistics Education, Simulation Based Learning, Probability, Dynamic Statistics Software1. Introduction
Today, there is a need to work on probability theory, for we have to make a prediction in order to make decisions in uncertain situations and evaluate the huge amount of information at the same time. In many countries where the probability teaching is applied, researchers stated that the interesting and purposeful learning activities related to probability have a positive effect on students’ mathematical thinking skills. Therefore, the probability is located in developing countries' education program in a growing
manner. Although the probability theory is an important and socially useful branch in mathematics education, it has been observed that it has many features and challenges basically arising from the disharmony between the intuitions and the reality. One of the reasons for this conflict is that the experience is limited. Another reason is deliberate actions manipulating the reasons to obtain the desired effect [8]. As a result of this, there is a tendency to think that a particular effect always produces the same result. Gürbüz [10] listed the difficulties in understanding the probability topics as follows; difficulties arising from language features, difficulties related to mathematizing the practical applications, difficulties relating to an undeveloped intuitive overview of chance. Additionally, a definite thought that there would be a single, absolute and right answer as in mathematics and that appropriate teaching materials and resources cannot be used in the probability teaching are other difficulties in the probability teaching [12]. The recommendations on this issue emphasize the importance of all students to create an awareness of the structures of the probability and their applications [16].
whole picture. The main objective of the statistics training is not only to understand and interpret the tables and graphics but also enable making inference and generalizations beyond the data. Currently, many math curriculums still emphasize on the mathematical skills rather than inferential process, and it is a condition that can affect the performance of the students [22].
In this period when the entry of new technologies into the learning environments is necessary, the use of different software as a mean is unavoidable. This software has been developed day by day, and some problems that cannot be obtained in real life situations have become to be observed easily and quickly thanks to the software. One of these is the simulation software. Simulation software is teaching methods in which learners can change parameters and make the experiments identically [21].
Conceptual errors in the learning process of the probability concepts can affect the important personal decisions related to the daily life [3]. Coutinho [5], Batanero and Godino [2] have suggested that the development of ideas of probability should be based on three basic concepts which are chance, randomness and the interpretation of probability. Batanero and Godino [2] have pointed at the need to emphasize the variability in the small samples by comparing the results obtained by each student, and to create situations to observe unpredictability of individual results in a random experiment. Students should be aware of the convergence phenomenon by considering the total results of the class and then comparing the reliability of the small and large samples. In this way, the use of computer resources in the classroom is an important tool for increasing the number of random samples for test. Various researchers have proposed the use of computer in the probability training as a mean to understand the abstract or difficult concepts and improve students' skills [15, 10]. Batanero and Diaz [1] emphasize that the students conduct simulations in the computer courses to help them solve simple probability problems that cannot be possible with physical experiments. Simulation, when combined with the use of technology, is the most appropriate strategy to focus better on the concepts and reduce the technical calculations [3].
In this study, simulation-based instructional content includes issues related to the experimental probability of throwing money experiments. TinkerPlots dynamic statistical software was used in the study and the research problem was determined as “What is the impact of the simulation based probability teaching on the inference skills of prospective teachers?’’
1.1. Dynamic Statistical Software and Experimental Probability
It is a software used by the students from secondary school to university, which provides a dynamic learning environment with data analysis and probability modeling [11]. This software has emerged as an important and useful tool in the development of ideas about experimental
probability. In particular, the fact that the number of trials is changeable offers the opportunity to observe small and large samples. The data obtained from the experiment results are transformed into a dynamic and visual working environment through tables and graphics. Thus, the students develop their understanding of the experimental probability against the theoretical probability thanks to the activities they do, and pain opportunities to verify or change their intuition about probability and randomness.
1.2. The Theoretical Framework
In this study, events were built on modeling, simulations and "the basic logic of inference" which was put forward by Cobb [4]. Cobb's logic is for the random experiments and random samples and named as 3R (randomize-repeat-reject) by himself, meaning random selection, repeating and rejecting. In this study, this logic was extended by combining with the simulation-based learning approach to include the implied above. In this context, a 5-step simulation-based learning model was created. The stages of this model and events expected to be realized at each stage are shown in Figure 1.
Figure 1. Simulation-based learning model designed for teaching probability
Problem: The introduction of real-life problems from the context of which is being familiar or not.
Prediction: Taking the estimations for the solution of the problem
Model: Creating a simulation consisting reasonable random processes.
Test: Producing data from the created model.
Evaluation: Querying the distribution of the data and reaching a conclusion to generalization.
2. Materials and Methods
was examined. To achieve this purpose, it was aimed at creating, implementing and checking the effectiveness of a learning environment for the experimental probability topic. At the same time, the study provides training content that may be needed for teaching probability and samples that may be needed for training as well.
2.1. Method
The quasi-experimental method was used in this study in which the effect of the simulation-based probability teaching on the inference success of the prospective teachers was investigated. 28 prospective mathematics teachers were chosen as the experimental group and 27 were chosen as the control group, of 55 prospective teachers who were participating in the statistical probability lessons. In the experimental group, ThinkerPlot dynamic software was used by adding simulation-based learning approach to it. In the control group, lessons were made using paper and pen without information technology.
2.2. Sample
This study was conducted in 2014-2015 Academic Year Fall Semester at Bulent Ecevit University. The sample group of the study consisted of 55 prospective mathematics teachers who were attending the statistical probability lessons. In this context, 28 prospective teachers were chosen as experimental group and the remaining 27 were chosen as the control group.
2.3. Implementation
Firstly, the activities were designed using TinkerPlot software. When planning the activities, the views of two faculty members who were giving "Computer Aided Mathematics Education" and "probability" courses are benefited from. The experimental probability activities were
made with the experimental group in an environment equipped with computers for 4 weeks, 2 hours every week. The date collection tool which had been developed was applied to 55 prospective teachers in the first week. In the second and third weeks, computer-assisted probability activities related to experimental probability was conducted with the experimental group. The events were chosen in a way that the features of the software would be used at the highest level. Prospective teachers first experience the TinkerPlots dynamic statistical software during modeling in this study. Sample applications were made related to the "sampler" toolbar and how to use it. During the activity process, the researcher made a participant observation. During the participant observation, the researcher observed the students throughout the activities and also asked questions to the students to get more detailed information about some issues. In addition, clinical interviews to obtain deeper information about the ideas of some prospective teachers were made. Through clinical interviews, the underlying causes of the ways of thinking and ideas of the prospective teachers were tried to be determined. During this process, problems related to the experimental probability, which are in parallel with the content applied in the experimental group, were asked to the students from the control group and discussed. In the control group, the problems were solved sometimes by the students and sometimes by the instructor.
2.4. Data Collection Tools and Data Analysis
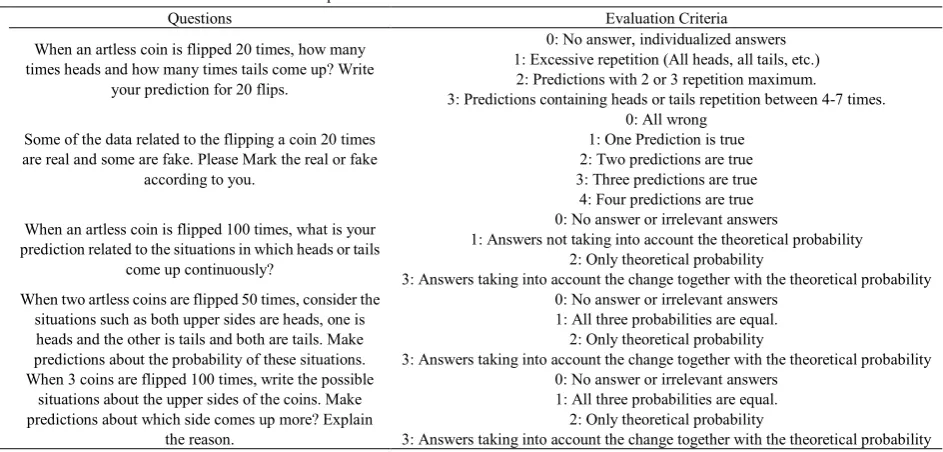
[image:3.595.74.546.523.749.2]A test consisting of the five open-ended questions was applied to two groups in the study (Appendix). This test consists of the experimental probability questions related to a coin, the detection of real and fraudulent data, throwing two or three coins. These questions and evaluation criteria are presented in Table 1.
Table 1. The questions in the data collection tool and evaluation criteria
Questions Evaluation Criteria
1 When an artless coin is flipped 20 times, how many times heads and how many times tails come up? Write
your prediction for 20 flips.
0: No answer, individualized answers 1: Excessive repetition (All heads, all tails, etc.)
2: Predictions with 2 or 3 repetition maximum.
3: Predictions containing heads or tails repetition between 4-7 times.
2 are real and some are fake. Please Mark the real or fake Some of the data related to the flipping a coin 20 times according to you.
0: All wrong 1: One Prediction is true 2: Two predictions are true 3: Three predictions are true
4: Four predictions are true
3 prediction related to the situations in which heads or tails When an artless coin is flipped 100 times, what is your come up continuously?
0: No answer or irrelevant answers
1: Answers not taking into account the theoretical probability 2: Only theoretical probability
3: Answers taking into account the change together with the theoretical probability
4
When two artless coins are flipped 50 times, consider the situations such as both upper sides are heads, one is heads and the other is tails and both are tails. Make predictions about the probability of these situations.
0: No answer or irrelevant answers 1: All three probabilities are equal. 2: Only theoretical probability
3: Answers taking into account the change together with the theoretical probability
5
When 3 coins are flipped 100 times, write the possible situations about the upper sides of the coins. Make predictions about which side comes up more? Explain
the reason.
0: No answer or irrelevant answers 1: All three probabilities are equal. 2: Only theoretical probability
A t-test was used to compare the pre-test and final test scores of the experimental group and the control group. Whether there is a significant difference between the scores of the experimental group and the control group is analyzed using ANCOVA test. Additionally, the answers of the prospective teachers and the models and graphics that they made using TinkerPlot software were analyzed qualitatively.
3. Result
The findings obtained before and after the implementation were analyzed qualitatively and quantitatively in this study. The obtained data were presented under the headings "the findings obtained from the quantitative data" and "the findings obtained from the qualitative data".
3.1. Findings Obtained from the Quantitative Data
[image:4.595.313.550.150.196.2]The independent t-test results which are related to the comparison of test scores of the experimental and control groups are shown in Table 2.
Table 2. The independent t-test results which are related to the comparison of test scores of the experimental and control groups
Test Group N
x
SS Sd t pPre-test Experimental 28 6,07 2,27 53 0,060 0,952 Control 27 6,03 1,93
The average scores of the prospective teachers in the experimental group were obtained as x= ,607 , and the average scores of those in the control group were obtained as
03 ,6
=
x in the pre-test. As seen in Table 2, the independent
t-test results conducted for the pre-test scores of the prospective teachers in the experimental and control groups showed no significant difference t= ,0504 p>0,05(0,952).
This shows that the experimental group and the control group are at the same level.
[image:4.595.57.298.358.397.2] [image:4.595.314.550.488.569.2] [image:4.595.58.297.602.655.2]Paired t-test was used to determine whether there was a statistically significant difference between the pre-test and final test scores of the prospective teachers in the experimental group. The results obtained are presented in Table 3.
Table 3. T-test results related to the pre-test and final test scores of the prospective teachers in the experimental group
Experimental
Group N
x
SS Sd t pPre Test 28 6,07 2,27
27 -16,192 0,000 Post Test 28 13,71 1,48
As seen in Table 3, the pre-test average score of 28 prospective teachers in the experimental group was
x
=
,6
07
and final test average score was x=13,71. In the t-test conducted for the samples applied to the pre-test and final test data, a statistically significant difference revealed in favor of the final testt(27) =−16,192: p<0,05 (0,001).
This can be expressed that the simulation-based learning approach makes a positive effect on the academic success of the prospective teachers related to the experimental probability.
Table 4. T-test results for the prospective teachers in the control group, related to the pre-test and final test scores
Control Group N
x
SS Sd t p Pre Test 27 6,04 1,9326 -1,975 0,059 Post Test 27 6,37 1,45
As seen in Figure 4, the pre-test average score of 27 prospective teachers in the control group was
x
=
,6
04
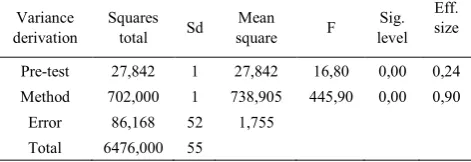
and final test average score wasx= ,637. In the dependent t-test conducted for the pre-test and final test, no statistically significant difference was revealed between the average scores t(26) =−1,975: p>0,05 (0,059).The independent t-test was conducted to determine whether there was a difference between the experimental group and the control group, and it was found out that the groups were at the same level. While a significant difference in favor of the final test was obtained when comparing the pre-test and final test scores of the prospective teachers in the experimental group in which the simulation based learning approach was used, it was found out using paired t-test that there was not a significant difference between pre-test and final test scores of the control group. The ANCOVA analysis was carried out on the final test scores to determine whether there was a difference between final test scores of the groups. The results of ANCOVA analysis carried out to determine whether the observed difference between the average final test scores was significant or not are presented in Table 5.
Table 5. The ANCOVA results on the final test scores of the experimental and control groups
Variance
derivation Squares total Sd square Mean F level Sig. Eff. size
Pre-test 27,842 1 27,842 16,80 0,00 0,24 Method 702,000 1 738,905 445,90 0,00 0,90
Error 86,168 52 1,755 Total 6476,000 55
Figure 2. Examples of the predictions made in the pre-test, in which a coin was assumed to be flipped 20 times.
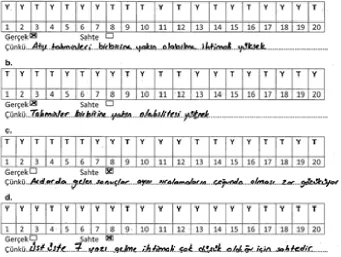
Figure 3. An example of the typical pre-test answers to the 2nd question of the prospective teachers
3.2. Findings Obtained from the Qualitative Data
In this section, the most prominent qualitative data were mentioned which emerged after the examination of the answer sheets of the prospective teachers in the experimental group and the simulations they created. When the qualitative data were evaluated, the different ways of thinking and whether the simulations led the emergence of the new thinking habits were focused on. With this method, the reasons for the qualitative difference emerged before and after the implementation were tried to be determined. When the obtained findings were evaluated, it was found out that the majority of the prospective teachers made predictions that contained no more repeats than 2-3 times, the remaining a few prospective teachers made predictions as "all heads", "all tails", or 10 heads, 10 tails. Some examples of these answers are presented in Figure 2.
In the 2nd question, the data related to the 20-times-flipping of a coin which is seen in figure 3 were presented to the prospective teachers. Some of these data were real and some were faked. Prospective teachers were asked which one could be real and which one could be faked. In this question, the majority of the prospective teachers failed in determining whether the data sets were real or fake. Only a few of them matched one or two correctly. Only one prospective teacher predicted all correctly. The majority of the prospective teachers stated that the options a and b were real and c and d were fake. Some opinions on this question are given below.
"a is the choice which is nearest to my prediction. I suppose it may be such as well."
"In the option b, number of heads and tails are equal, so I think option b is real"
[image:5.595.134.476.72.241.2] [image:5.595.134.476.272.529.2]options a and b, therefore, they are real"
"The same situations happened many times successively in option c. For example, it is not convincing heads come up 4 times successively. I think it is faked"
"It seems difficult that the same result happens consecutively 4-5 times"
"The consecutive 7 results in option d does not seem to be possible. Therefore, it is faked."
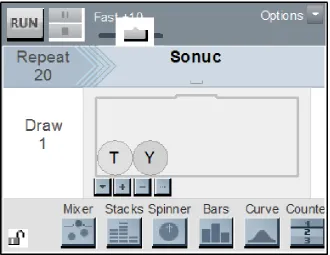
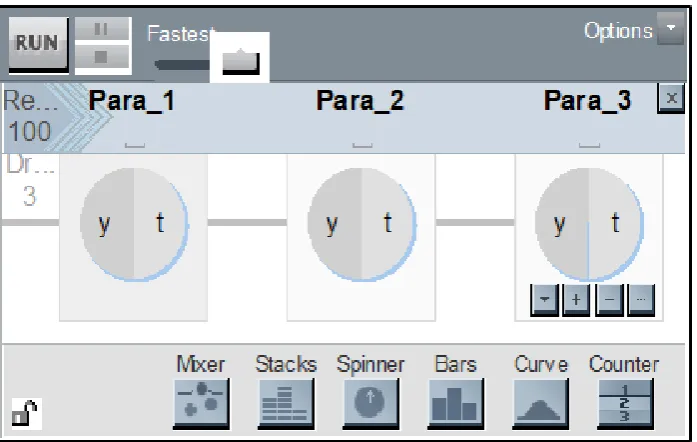
In the experimental group, after the problems were understood and the predictions were made, a model appropriate to the problem was created using TinkerPlots, which is shown in Figure 4.
The model developed for the coin-flipping experiment provides the opportunity to show the results obtained from 20 trials and show them in graphics. Prospective teachers had the opportunity to produce data through the model and, produce more data at the same time and generalize the emerged situations. The graphic in figure 5 shows what side of the coin was up in the 20 trials respectively along an axis. The graphic in figure 5 may seem to be confusing in distinguishing heads and tails. Another graphic showing clearly the total numbers of heads and tails can easily be switched to. It was observed that, as seen in figure 6, some prospective teachers grouped the heads and tails by creating graphics.
Figure 4. The simulation created by the experimental group related to a coin.
[image:6.595.135.473.227.728.2]Figure 5. The data produced by simulation related to the experiment of flipping a coin 20 times.
[image:6.595.140.471.241.496.2] [image:6.595.138.471.637.739.2]In the 3rd question, the prospective teachers were asked to predict the number of the consecutive situations in which the heads or tails come up in an experiment of flipping an artless coin 100 times. When evaluating the data obtained, it was observed that most of the answers were the ones including theoretical probability. Some of these were as follows:
"There are two probabilities. Either heads or tails come up. Half will be heads and the other half will be tails, meaning 50-50"
"50% heads, 50% tails"
"There must always be a 1/2 ratio between the numbers of heads and tails, so it should be 50-50."
Additionally, although at a small number, answers such as "99 tails, 1 heads", "all tails", "all heads" were also observed. However, there were also individualized answers. Some of these were as follows:
"I think tails will be more", "if the heads side is up when the coin is flipped, then heads will come up, if the tails side is up when the coin is flipped, then the tails will come up."
"The heads side of the coin is heavier, for having relief on it. Therefore, the possibility of the position that the heads come up is more likely. Either position will be 90% at most."
The prospective teacher in the experimental group used the model, presented in figure 4, which they created for the coin flipping experiment for 100 trials. They made observations by showing the obtained data on graphics. Figure 7 shows some examples produced by the prospective teachers from the experimental results.
In the 4th question, the prospective teachers were asked to consider the situations the first of which was the upper sides of both coins were tails, the second of which was the upper side of the first is heads and the upper side of the second is tails, and the third of which was the upper sides of both coins were heads when two artless coins were flipped 50 times; and make predictions about the probability of these situations. It was observed that only a few of the prospective teachers made predictions by taking into consideration the change and the theoretical probability. When evaluating the false predictions, they can be classified such as "individualized answers", "probabilities are equal", "the sum of the probabilities is greater or less than 1." Some examples related to these opinions are presented below.
"The probability that the upper surfaces of both coins are tails is higher. Because there is the picture of Atatürk on the heads side and that side is heavier, therefore the heads side will be up."
"The probability that upper surfaces of both coins are heads is 5%, the probability that upper surfaces of both coins are tails is 5%. The probability that one's surface is heads and the other's is tails is 90%."
"HH 25%, TT 15%, TH-HY 10%"
"All probabilities for the situations such as upper sides of both coins are heads or tails, or one side is heads and the other is tails are equal."
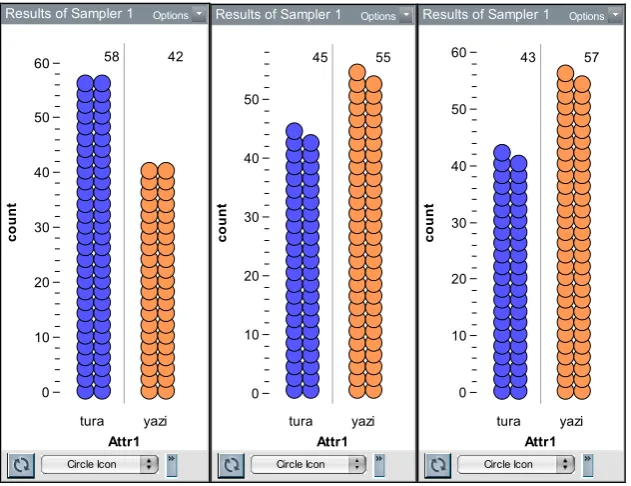
The prospective teachers in the experimental group created the model shown in figure 7 for the experiment of flipping two coins. They made trials by entering the numbers of the trials in accordance with the problem.
Results of Sampler 1 Options
tura yazi
0 10 20 30 40 50
60 58 42
count
Attr1
Circle Icon
Results of Sampler 1 Options
tura yazi
0 10 20 30 40 50
45 55
count
Attr1
Circle Icon
Results of Sampler 1 Options
tura yazi
0 10 20 30 40 50
60 43 57
count
Attr1
[image:7.595.148.464.467.710.2]Circle Icon
Figure 8. The simulation that was created for the experiment made by flipping two coins.
The prospective teachers evaluated the tables and graphics they obtained after having made enough trials. Thus, they had the opportunity to discuss whether they matched with their predictions.
Results of Sampler 1 Options
para_1 para_2 Birlesimi
33 34 35 36 37 38 39 40 41 42 43 44 45 46 47 48 49 50
t y t;y
y t y;t
y t y;t
t t t;t
y y y;y
t y t;y
t t t;t
t y t;y
y t y;t
y y y;y
t y t;y
t y t;y
y t y;t
t y t;y
y t y;t
y y y;y
y t y;t
y t y;t
Results of Sampler 1 Options
t;t t;y / y;t y;y 0
4 8 12 16 20 24 28
10 (20%) 28 (56%) 12 (24%)
count
Birlesimi
Circle Icon
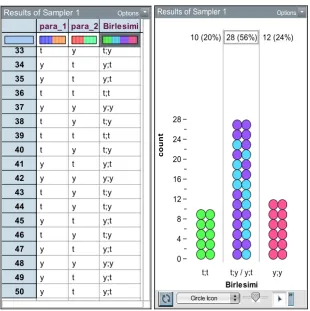
[image:8.595.150.461.416.728.2]In the 5th question, the prospective teachers were asked to compare the situations that the upper sides of all three coins were tails or heads, the upper side of the two were heads and the upper side of the third was tails or vice versa, and predict the percentage of all these probabilities, for an experiment of flipping three coins 100 times.
When the obtained data were evaluated, it was observed that the majority of the prospective teachers had not expressed their predictions in percentage. While some prospective teachers made predictions such as the number of the situations in which upper sides of two coins were the same and the upper side of the third was different are greater; some prospective teachers stated that the number of the situations in which upper sides of all three coins will be heads or tails would be greater. Unlike them, there were other prospective teachers who thought that the probabilities of all these situations were equal. Additionally, although in small numbers, some individualized answers were also been determined. The descriptions of some prospective teachers regarding this question are as follows:
"I think the number of the situations in which upper sides of two coins will be equal and the upper side of the third is different is greater."
"The number of TTT or HHH situations is greater than
the situations in which at least one upper side is different."
"The number of all situations may be same or one situation may never happen".
"The probabilities of TTT, TTH, THH, HHH situations are 25% for each because there are 4 situations." “TTT=½. ½. ½ TTH=½. ½. ½ THH= ½. ½. ½ all are equal. It means the probabilities are equal.”
"The probability of TTT situation is greater because the head side is heavier."
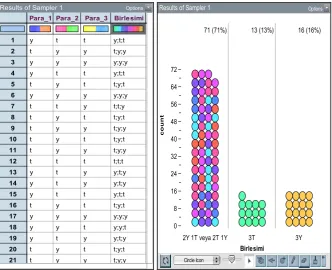
The prospective teachers in the experimental group used the model, shown in figure 10, that they created for the experiment of flipping three coins, for 100 trials.
The prospective teachers observed the results by making some trials using the simulation shown in figure 10. Then they show one of the results of 100 times flipping in tables and graphics.
[image:9.595.132.481.387.608.2]Trials performed using simulation contributed to the prospective teachers in making consistent estimates for the outcome of the problem. In addition, it provided them with the opportunity of thinking about the theoretical reasons for the results. At the end of the implementation, it was observed that the majority of the prospective teachers made accurate predictions and comments on this question.
Results of Sampler 1 Options Para_1 Para_2 Para_3 Birlesimi
1 2 3 4 5 6 7 8 9 10 11 12 13 14 15 16 17 18 19 20 21
y t t y;t;t
t y y t;y;y
y y y y;y;y
y t t y;t;t
t y t t;y;t
y y y y;y;y
t t y t;t;y
t y t t;y;t
t y y t;y;y
t y t t;y;t
t y y t;y;y
t t t t;t;t
y t y y;t;y
y t y y;t;y
y t t y;t;t
t y t t;y;t
y y y y;y;y
y y t y;y;t
y t y y;t;y
t y t t;y;t
t y y t;y;y
Results of Sampler 1 Options
2Y 1T veya 2T 1Y 3T 3Y
0 8 16 24 32 40 48 56 64 72
71 (71%) 13 (13%) 16 (16%)
c
ount
Birlesimi
Circle Icon
Figure 11. The table and graphical representation of the data created with the simulation, which were obtained for the situation in which three coins were flipped.
4. Discussion and Conclusions
This study is not intended to include all activities relating to the probability theory. Activities in the paper are about a finite sample space and discrete probability calculations. The main focus in this study is the use of simulation and the impacts of the use of simulation in decision making. Results are shown that computer simulations can help students to understand the concepts in elementary probability and provide for sensitivity estimation.
Before the study, it was determined that there was no significant difference between the success levels of the groups, with the t-test conducted using the scores of experimental and control group students which they obtained from the experimental probability tests. As a result of ANCOVA analysis performed after the implementation of the simulation based learning developed in relation to the experimental probability, it was found out that the average test scores of the experimental group prospective teachers were higher than those of the control group prospective teachers and there was a significant difference between them. When this difference was examined, it was found out that the inference of the experimental group prospective teachers regarding experimental probability problems took into consideration the change and theoretical, whereas, the control group prospective teachers generally made inferences which are inappropriate and include only theoretical probability. This reveals that simulations have positive effects on the inference skills on the experimental probability problems.
Prospective teachers' answers to questions in the experimental probability test were examined qualitatively.
[image:10.595.140.473.74.344.2]determined that the prospective teachers gave more flexible answers taking the change into consideration. Although it has been emphasized in the recommendations made relating to the statistical teaching that the change must be highlighted [16] primary role of change is not considered clearly in most activities [17, 19]. Consideration of the changes is seen by many researchers as an educational objective for statistics courses [7, 12]. In the 4th and 5th questions, within the data obtained from pre-tests, it was noted that there were answers, the sum of the probability was not equal to 1 or the total percentage of which was not equal to 100. Some prospective teachers thought that the probabilities of occurrence of all events in an experiment were equal. It was observed that simulations helped the prospective teachers to become aware of the wrong ideas and change their ideas.
This study has noted several advantages of using a simulation. These are flexibility, handle small and large sampling, answer “what-if” questions, interaction among variables, time compression, a better understanding of the concepts, conditions close to reality. However there are some disadvantages of computer simulations. One of them is simulation errors. Prospective teachers have to learn how to build a good model before a simulation is conducted. Any incorrect application has the potential to change the output of the simulation. If the appropriate simulation for solving the problem is not created correctly accurate estimates can not be obtained. Each model is unique and does not generate optimal solutions. Furthermore, simulation results can never be the same as theoretical results regardless of the number of repetitions. They have to come back to probability theories to derive the theoretical results.
Activities in the probability teaching include a variety of materials which are used in different ways (Dice, coins, playing cards, cubes, etc.). These materials make the teaching and learning activities more appropriate for the students and teachers. However, its integration into the school practice has not been developed yet. Because the visuality needed to study the experimental probability problems cannot be achieved in the traditional environments, there is a need for the alternative learning environment. In this sense, the different characteristics that the dynamic statistical software has relating appropriate environment for the teachers and students. The fact that the students use different instructional materials provides the opportunity to organize and configure their own knowledge and to evaluate the mathematical concepts and structures from different perspectives [20, 13]. Drier [6] argued that the materials and visual samples developed the students’ skills to organize the knowledge, they changed this information into the practice and used them fluently and successfully in solving problems. Indeed, in this study, the prospective teachers created models and produced data using these models. At the same time, thanks to the fact that the number of trials of the simulation was changeable, they had the opportunity to observe the situations for larger samples, and they did not have difficulties in inference. Besides, the simulations contributed
to the creations of the environments for the class and group discussions. In this study, the effect of the simulation-based probability teaching on the prospective teacher’ skills to inference was examined. The obtained findings showed that the simulation-based probability teaching improved the prospective teachers’ skills to make predictions and inference based on these predictions, and positively affected their success in general. In this context, it is suggested that the education materials, which are suitable for the different teaching methods in different areas to enable the learners participate in the mathematics in a pleasant way, are used and their effects are revealed.
REFERENCES
[1] Batanero, C., & Diaz, C. (2007). Probabilidad, grado de creencia y proceso de aprendizaje [Probability, degrees of belief and the learning process]. XIII Jornadas Nacionales de Enseñanza y Aprendizaje de las Matemáticas. Granada.
[2] Batanero, C., & Godino, J. (2002). Estocástica y su
Didáctica para Maestros [Stochastics and its Teaching for Teachers]. Proyecto Edumat-Maestros, Granada, Universidad de
Granada.www.ugr.es/~jgodino/edumat-maestros/manual/6_ Estocastica.pdf
[3] Borovcnik, M., & Kapadia, R (2009). Research and
developments in probability education. International Electronic Journal of Mathematics, 4(3). www.iejme.com/032009/IEJME_p00_introd_E.pdf
[4] Cobb, G. (2007). The Introductory Statistics Course: A
Ptolemaic Curriculum?
www.repositories.cdlib.org/uclastat/cts/tise/vol1/iss1/art1.
[5] Coutinho, C. (2001). Introduction to Random Situations
from College: modeling Bernouilli simulation experiments in the IT environment of Cabri Geometry II. Doctoral dissertation, University J. Fourier, Grenoble, France.
[6] Drier, H. (2000). Children’s Probabilistic Reasoning with a Computer Micro world. A Dissertation Presented to the Faculty of the Curry School of Education University of Virginia.
[7] Franklin C, Kader G, Mewborn D, Moreno J, Peck R, Perry
M, Scheafer R. (2007). Guidelines for assessment and instruction in statistics aducation (GA˙ISE) report: a pre-K-12 curriculum framework. Alexandria (VA): American Statistical Association.
www.amstat.org/education/gaise
[8] Fischbein, E. & Schnarch, D. (1997). “The Evolution With Age Of Probabilistic, Intuitively Based Misconceptions”. Educational Studies in Mathematics, 29, 97-105.
[9] Garfield, J., & Ben-Zvi, D. (2009). Helping students develop statistical reasoning: Implementing a Statistical Reasoning Learning Environment. Teaching Statistics, 31(3), 72–77.
[10] Gürbüz, R. (2008). Olasılık Konusunun Öğretiminde
[11] Konold, C. & Miller, C. (2004). TinkerPlots™ Dynamic Data Exploration 1.0. Emeryville, CA.: Key Curriculum Press.
[12] Koparan. T. (2015). Difficulties in Learning and Teaching
Statistics: Teacher Views. International Journal of
Mathematical Education in Science and Technology. 46(1),
94-104.
[13] Koparan T. (2015). The effect on prospective teachers of the learning environment supported by dynamic statistics software, International Journal of Mathematical Education in Science and Technology, DOI:
10.1080/0020739X.2015.1070210.
[14] Koparan. T., Güven. B. (2014). According to the M3ST
Model Analyze of The Statistical Thinking Levels of Middle School Students. Education and Science, 39, 171, 37–51.
[15] Mills, J. (2002). Using computer simulation methods to
teach statistics: A review of the literature. Journal of Statistics Education, 10(1).
www.amstat.org/publications/jse/v10n1/mills.html
[16] National Council of Teachers of Mathematics (2000).
Principles and standards for school mathematics. www.standards.nctm.org
[17] Porter A. L. (2001). Improving statistical education through the experience of reflective practice.
www.stat.auckland.ac.nz/iase/publication/dissertation/01.Por ter.Dissertation.pdf
[18] Schoenfeld, A. H. (1998). Toward A Theory Of
Teaching-In-Context. Issues In Education, 4(1), 1-94.
[19] Snee R. D. (1999). Disscussion: development and use of
statistical thinking: a new era. Int Stat Rev.67(3):255–258. [20] Streefland, L. (1993). Fractions: A realistic approach. In T.P.
Carpenter, E. Fennema, & T.A. Romberg (Eds.), Rational numbers: An integration of research (pp. 289-325). Hillsdale, NJ: Lawrence Erlbaum Associates, Inc.
[21] Tekdal, M. (2002). Etkileşimli fizik simülasyonlarının geliştirilmesi ve etkin kullanılması. V. Ulusal Fen Bilimleri ve Matematik Eğitimi Kongresi, ODTÜ, Ankara.