Journal of Chemical and Pharmaceutical Research, 2013, 5(12):1529-1536
Research Article
CODEN(USA) : JCPRC5
ISSN : 0975-7384
Characterization of taurine and its derivative binding to HSA using
calorimetry and docking
Bingli Jiang
a,
Yanrong Hu
a, Anran Zhao
a, Xuan Luo
a, Weigao Pan
a,band Cuiwu Lin
a*a
School of Chemistry and Chemical Engineering, Guangxi University, Nanning, Guangxi, P. R. China
bGuangxi Botanical Garden of Medicinal Plants, Nanning, Guangxi, China
_____________________________________________________________________________________________
ABSTRACT
To better understand the mechanism of drug binding to proteins, the binding properties of taurine and its derivative 2-phthalimido-ethanesulfonic acid (PESA) with human serum albumin (HSA) were investigated under physiological conditions by calorimetry, circular dichroism (CD) spectroscopy and molecular modeling. Based on the thermodynamic data, molar reaction enthalpy, reaction order (n) and the rate constant (k) were calculated, the kinetics equations of TAU and PESA binding to HSA were obtained; hydrogen bond force played a major role in the complexes; the reactions were spontaneous; binding sites of both complexes were one site. The results of CD spectroscopy showed that the conformation of HSA−TAU and HSA−PESA did not have any high-ordered structural change. Computational mapping revealed the details of their binding conformations.
Key words: taurine, HSA, calorimetry, circular dichroism, molecular modeling
_____________________________________________________________________________________________
INTRODUCTION
Taurine (TAU, scheme 1) or2-Aminoethanesulfonic acid is a sulphur containing free β-amino acid in mammals. Various physiological roles of TAU have been reported, including calcium modulation [1, 2], membrane stabilization [3], intracellular osmotic regulation [4], the regulation of protein phosphorylation, antioxidant agent [5, 6].TAU combination of L-carnitine has a synergistic inhibitory effect on the proliferation and osteoblastic differentiation of vascular smooth muscle cells (VSMCs) [7]. In endothelial cells, taurine variably inhibits apoptosis, inflammation, oxidative stress and cell death, while increasing NO generation [2, 3]. It is involved in variety of important physiological processes, although much progress has been made in discovering its enigmatic and many-sided biological role, scarce insight on the mechanisms of its actions is available. This manuscript is aimed at gaining more thermodynamics and kinetics information on the TAU and its derivative 2-phthalimido-ethanesulfonic acid (PESA)binding to HSA.
Calorimetry is a powerful probe of reaction pathways and mechanisms by virtue of providing high-quality kinetic data. Microcalorimeter provides on-line, quasi-continuous, and non-invasive measures of reaction rate [8]. With the microcalorimetry, Zhai and their team explored the antibiotic resistance in bacteria and reported the thermokinetic parameters of the imipenem hydrolysis with B1 subclasses metallo-β-lactamase CcrA from Bacteroides
fragilis[9].Zhao and his co-workers investigated the effects of two ginsenosides Rg1 and Rb1 on splenic lymphocytes
concentration, [LT], and the total macromolecule concentration, [MT], to generate the binding isotherm (Fig. 1). The
thermodynamic binding parameters are obtained through fitting binding isotherm to the nonlinear least-squares. The adjustable parameters in fits are ∆H (enthalpy change, in kcal· mol-1), ka (association constant, in M-1), and n (number of binding sites per monomer of the (macro) molecule in the cell). So, ∆G, the free energy of binding (kcal· mol–1), can be calculated by Van't Hoff equation. From the Gibbs free energy equation, T∆S (the entropy of binding kcal· mol–1) at the experimental temperature, can be determined [15, 17, 18].
EXPERIMENTAL SECTION
Apparatus and reagents:
Human Serum Albumin (HSA, Sigma–Aldrich) was dissolved daily in phosphate buffered saline (PBS: 150 mmol·L–1 NaCl, 2.7 mmol· L–1 KCl, 8.1 mmol· L–1Na2HPO4, 1.9 mmol·L–1KH2PO4, pH 7.4) to prepare a stock solution (2.0 ×
10–4 mol·L–1). Taurine (Sinopharm Chemical Reagent Co., Ltd.) PESA stock solutions (1 × 10⁻³ mol·L–1) were prepared as follows: 0.025 mmol TAU or PESA, were dissolved in 25 mL of PBS (pH = 7.4).Other reagents were of analytical grade and used without further purification. Double distilled water was used for the experiments.
The thermogram was recorded by Microcalorimeter (RD496−CK2000, MianYang CP Thermal Analysis Instrument Co., Ltd). All pH measurements were made with a pHs–3C digital pH meter (Shanghai Leici Device Works, China) with a combined glass–calomel electrode.1H and 13C NMR spectra were recorded on a Bruker Advance III 300 at 300 MHz for 1H and 75 MHz for 13C, respectively in DMSO–d6. Chemical shifts are given in δ (ppm) and coupling constants in Hz. ESI–MS was obtained on a Shimadzu LC–MS 2010A. ITC experiments were performed using an ITC200 Microcalorimeter from Micro Cal. The CD spectra of all mixtures were measured on anMOS−450 spectrometer (Bio–Logic, France).
Synthesis of 2-phthalimido-ethanesulfonic acid [19]
A suspension of taurine and anhydrous potassium acetate in acetic acid (AcOH) solvent was refluxed at 120 oC for 10 minutes, then phthalic anhydride was added (Scheme 1), and the reaction mixture was refluxed with stirring for additional 3 h. At the end of the reaction, a white precipitation was formed. After cooling in an ice-bath with continued stirring, the white product was filtered off, washed with acetic acid followed by alcohol, and purified by crystallization from water.
Scheme 1: Synthesis of 2-phthalimido-ethanesulfonic acid (PESA)
1H NMR (300 MHz, DMSO-d
6) δ 7.87–7.80 (m, 4H, ArH), 3.85 (t, J = 7.8 Hz, 2H, CH2), 2.77 (t, J = 7.8 Hz, 2H, CH2),
2.52 (s, 1H, OH). 13CNMR (75 MHz, DMSO-d6) δ: 168.16(2C=O), 134.73(2C, aromatic), 132.23(2C, aromatic),
123.40(2C, aromatic), 49.10(CH2), 34.93(CH2). MS calcd [M – H]– for C10H8NO5S 254.2, found 254.1.
Isothermal titration calorimetry (ITC)
HSA stock solution (5 × 10⁻⁵ mol·L–1) was kept in ITC titration cell as a titer and was titrated by drug having a concentration of 1 × 10⁻³ mol·L–1. Drug was injected through the computer-controlled 40 µL microsyringe at a successive time gap of 110 s between two injections into the HSA solution in the same buffer (cell volume = 200 µL) while stirring at 600 rpm. The experimental temperature was kept at 25oC.
Determination of thermodynamic parameters by microcalorimeter
The energy evolution was measured using a microcalorimeter. The structure and technical parameters of this calorimeter have been detailed previously [20]. The microcalorimeter was calibrated first using the Joule effect [20]. The calorimetric system was accurate (accuracy 0.02%) and reliable (precision 0.3%)[21, 22]. Drug solution (1.0 mL, 1 × 10⁻⁴mol·L–1) was placed in a small glass tube above the HSA (1.0 mL, 2.0 × 10⁻⁴mol· L–1), which was in a larger glass tube. After establishment of equilibrium, the small glass tube with drug solution was pushed down simultaneously. This led to mixing of the two solutions and the thermogram was recorded.
Circular dichroismspectra
with a path length of 0.1 cm was used in nitrogen atmosphere.
Molecular modelling studies
The 2D structures of the TAU and PESA were drawn in ACD/ChemSketch (version 12.0), and then energy–minimized in PyRx Open Babel [23] using mm94 force field. The prepared structures were used as input file for the docking. The structure of HSA was taken from the Protein Data Bank having PDB ID: 1H9Z [24]. At the beginning of the docking study, warfarin and all water molecules were removed, In addition, polar hydrogens and Kollman charges were added, as required in the Lamarckian Genetic Algorithm. Grid maps of 232 × 138 × 231 points with a grid–point spacing of 0.3750 Å were generated using the Auto Grid [25] in PyRx 0.8 (Local Execution Mode)[26-29]. The 200 genetic algorithm (GA) runs were performed with the following parameters: population size of 200, maximum number of 2.5 × 10⁵ energy evaluations, maximum number of 27,000 generations.
RESULTS AND DISCUSSION
[image:3.595.183.426.255.433.2]Thermodynamic Parameters from ITC
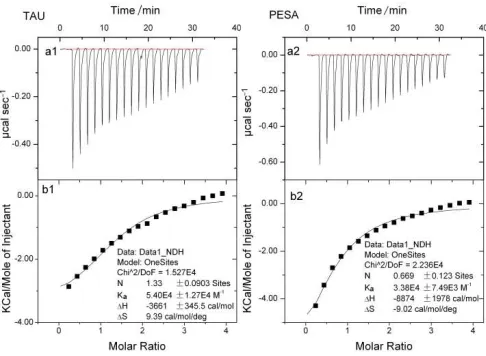
Fig. 1: ITC measurements of the binding of drug to HSA at 298K in phosphate buffer (pH = 7.4)
Parts a1 and a2 are the heat released during the titration of HSA (0.05 mM) by successive additions of a concentrated solution of TAU or PESA (1.0 mM), respectively; Figure parts b1 and b2 are the binding isotherms of TAU/HSA and PESA/HSA, respectively, after correction of heat for the
dilution control; the solid line represents the best fit according to the independent model
The experimental data were fitted to a theoretical titration curve using the software supplied by Micro Cal. A standard one–site model was used with ∆H, Ka, and n as the variables. A typical titration is shown in Fig. 1a. The addition of drug solutions (1.0 mM) to the calorimeter cell which contained a solution of HSA (0.05 mM) resulted in the release of heat until the binding were saturated. The data must be corrected for the dilution heats associated with the addition of drugs into buffer solution. The area under each peak was integrated, heats of dilution are subtracted, and the thermograms for the binding of drugs to HSA have been obtained (Fig. 1b). The heats released during the binding were related to the number of binding sites available, binding constants and thermodynamic parameters of the binding equilibrium[30]. These data were best fitted to a single set of identical binding site model and yielding the binding parameters for drugswere given in Table 1. Additionally, the entropy and free energy of binding can be calculated.
Table 1: thermodynamic parameters of drug binding to HSA
drug Ka(M–1) ∆H(cal·mol–1) ∆G (kcal·mol–1) ∆S (cal·mol–1· K–1) n
TAU 5.40×10⁴ –3661 –6.459 9.39 1.3
PESA 3.38×10⁴ –8874 –6.186 –9.02 0.7
As can be seen, both ∆G values of TAU–HSA and PESA–HSA were negative, which revealed that the binding process
was spontaneous. The negative value of ∆His frequently regarded as an evidence for hydrogen bond in the binding
reaction. ∆S> 0 observed in TAU experiment was mainly attributed to hydrophobic interactions. In addition, a specific
electrostatic interaction between ionic species in an aqueous solution is characterized by apositive ∆S value and
negative ∆H value [31]. So, in the binding of TAU to HSA process, hydrogen bond force most likely played a major
role, but hydrophobic forces also could not be excluded. While in the binding of PESA to HSA process negative values of both ∆H and ∆S imply nonbonded (van der Waals) forces and hydrogen-bond formation [31]. The sites model of
Kinetic investigation from microcalorimetry
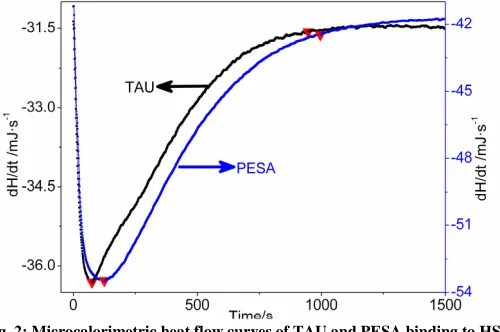
The typical thermogram was obtained during the interaction of HSA and drug (Fig. 2). The energy change in the reaction depends on the reaction progress [32]. The reaction was initiated when the two liquids mixed, and the reaction between HSA and drug could be divided into three stages according to the thermogram. In the curve of HSA-TAU at 303.15 K (Fig. 2), there was an exothermic peak, dividing it into three stages, stage I: (0–76 s), stage II: (76–948 s), and stage III: (after 948 s); The same to PESA-HSA at 303.15 K (Fig. 2), the exothermic peak was also divided into three stages, stage I: (0–126 s), stage II: (126–997 s), and stage III: (after 997 s). Stage I: Reaction was triggered when the reagent solutions were mixed. Drug solution diffused and bound to HSA, which would contain dilution heat and reaction heat. Stage II: The solution was completely mixed and formed a uniform mixture; all of the heat flow was coming out of the heat of reaction. Stage III: The association–disassociation reached equilibrium, so the curve flattened and remained constant for about 3 h.
Fig. 2: Microcalorimetric heat flow curves of TAU and PESA binding to HSA
Equations 1 and 2 were chosen as the model function describing the time-dependent process of drug binding to HSA:
) ( i
i kf a
dt da = (1) n i i a a
f( )=(1− ) (2)
Combining Eqs. 1 and 2 yields
n i i k a
dt da ) 1 ( − = (3)
According to the reaction boundary conditions, the relationship between the reaction extent and the energy change in the reaction system, a = Hi/H∞, and then Eq. 3 can be expressed as
n i i H H k dt dH
H (1 )
1
∞
∞ = − (4)
So, thermokinetic equation at constant temperature and pressure[33-35]was Eq. 5:
) 1 ln( ln ) 1 ln( ∞
∞ = + −H
H n k dt dH H i i (5)
In the above equations, i is any time during the reaction process; αi is the fraction of reaction at time i; dαi/dt is the rate
[image:4.595.182.432.214.380.2]of reaction; f(ai) is the kinetic function; Hi represents the heat at time i; H∞ is the heat of the whole process; (dHi/dt) is the enthalpy change rate at time i, k is the rate constant; n is the reaction order.
Table 2: the reaction enthalpy, rate constant k and reaction order n of TAU and PESA binding to HSA
H∞(J) ∆Hm(J·mol–1) k n
TAU−HSA –33.251 –3.32× 10⁵ 2.41× 10⁻⁴ 0.96
Fig.3: The plots of ln[(1/H∞)(dHi/dt)]versus ln[(1-Hi/H∞)], (a) HSA−TAU; (b) HSA−PESA
Based on the thermokinetic equations (5), the rate constant (k) can be obtained through linear regression analysis of stage II. lnk is the ordinate of the double logarithm regression curve ofln[(1/H∞)(dHi/dt)]versusln[(1–Hi/H∞)] (Fig. 3)
when ln[(1– Hi/H∞)] is set at 0 and n is the slope of the curve. The curves exhibited a comparatively good linear
relationship, the rate constant k and the reaction order n could be achieved from the figures and listed in Table 2. The reaction order nof both TAU and PESA binding to HSA were approximation to 1, which proved that the reaction process between TAU binding to HSA and PESA binding to HSA were similar to a quasi-first-order reaction.
Substituting the values of n and k into Eq. (3), we can get that the kinetics equation of TAU and PESA binding to HSA process is dαi/dt = 10
3.62
(1 – αi)
0.91
, dαi/dt = 10
3.41
(1 – αi)
1.17
, respectively.
Circular dichroism studies
Circular dichroism spectra can provide useful information of protein such as the content changes of the α-helix structure and secondary structure involving the β-sheet component [36].CD spectra of HSA with drug–HSAwere shown in Fig. 4. The native HSA exhibited two negative bands at 208 and 222 nm, which were characteristic of the typical α-helical structure of the protein. A reasonable explanation was that the negative peaks between 208–209 and 222–223 nm contributed to the n →π* transfer for the peptide bond of α-helix [37, 38]. Furthermore, the fact that the 208 nm band was larger than that at 222 nm indicated that there was an α + β structure in native HSA[39]. The secondary structures of native HSA and drug–HSA were evaluated by comparing the α-helix contents, corresponding to the ellipticity of the bands at 208 nm. The CD results were expressed in terms of mean residue ellipticity (MRE) in deg·cm2·d· mol–1 according to equation (6)[40]:
10 ) (
× =
nl C
medg ObservedCD MRE
p (6)
100 4000 33000
4000 208
(%) ×
− − −
= MRE
aHelical
[image:6.595.215.397.108.249.2](7)
Fig.4: CD spectra of free HSA and its TAU or PESA complexes: CHSA = 1.0 × 10⁻⁶ mol·L–1, CTAU/CHSA = CPESA/CHSA = 1:1, pH = 7.40, 298K
Where MRE208 is the observed MRE value at 208 nm, 4000 is the MRE of the β-form and random coil conformation
cross at 208 nm, and 33,000 is the MRE value of a pure α-helix at 208 nm.
With the above equation, the α-helix contents were obtained from CD spectra (Fig. 4). The intensity of the minimum reflects the amount of helicity of HSA. The calculated results exhibited a small increase in the α-helical content from 51.26%in free HSA to 53.01% in HSA–TAU and 52.15% in HSA–PESA, Which showed that the binding of TAU or PESA to HSA may induce minor conformational changes.TAU or PESA binding to the surface of HSA and some of functional groups inserting into the hydrophophobic surface of HSA and the electrostatic action according to the discussion in section 3.1 can stabilize the structure of HSA in solution, which explains the increasing α-helicity of HSA when bound to TAU. It also can be observed from Fig. 4 that the CD spectra of HSA in presence and absence of drugs were similar in shape in the region (190−250nm), which indicated that TAU or PESA did not cause any high-ordered structural change of HSA.
Docking analysis of TAU and PESA to HSA
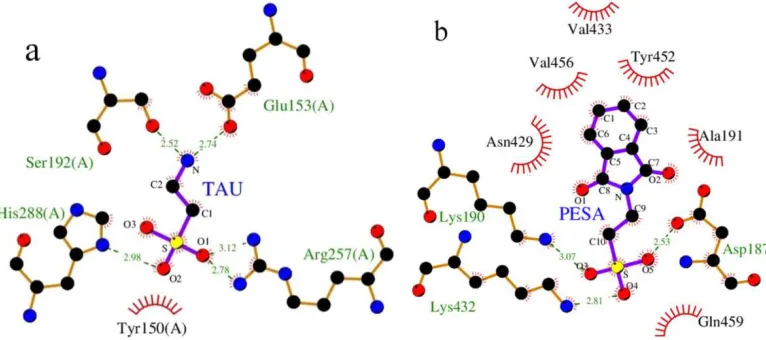
The resulting conformations were clustered using a root-mean-square deviation (rmsd) of 2.0 Å and the clusters were ranked in order of increasing binding free energy of the lowest binding energy conformation in each cluster. The lower binding energy conformer was searched out of 50 different conformers for docking simulation, and the resultant one was used for further analysis MGL Tools[25] and LigPlot [41, 42] were used to visualize the docked conformations and calculate the distances between possible hydrogen bonding partners. The optimum binding mode and binding site were given in Fig. 5. The binding energies of TAU-HSA and PESA-HSA were listed in Table 3. The lowest binding energies of the conformations in clusters were −4.05 and −6.07 kcal· mol–1 for TAU–HSA and PESA–HSA complexes, respectively. These Gibbs free energies indicated that the interaction between TAU or PESA and HSA were highly spontaneous and energetically favorable.
Table 3: binding energy of drug and HSA (kcal·mol–1)
Binding Energy
=(1)+(2)+(3)-(4)Intermol Energy(1)Internal Energy(2) Torsional Energy(3)Unbound Energy(4) –6.07 –7.26 –0.79 1.19 –0.79 –4.05 –5.24 –0.81 1.19 –0.81
Fig. 5: Structural details of the interaction between TAU or PESA and HSA obtained by molecular modeling method
Ligands bonds are shown as purple; the ligands and amino acid residues are denoted as sticks and ball models (C, black; O, red; N, blue; S, yellow.) and the hydrogen bonds depicted by green dotted line, while the spoked arcs represent residues making nonbonded contacts with the
ligand. The ligands are: (a) HSA−TAU. (b) HSA−PESA
CONCLUSION
In summary, in this work, the interaction of TAU and its derivative PESA with HSA were studied by calorimetry techniques, CD spectra and molecular modeling. Isothermal titration calorimetry results revealed that the both binding processes were spontaneous, HSA had one site for interaction with TAU or PESA. Thermodynamic data suggested hydrogen forces played a major role in the binding of TAU to HSA, while hydrophobic forces and hydrogen bond forces were the main interaction forces in HSA−PESA, which were in agreement with the docking results. The kinetics equation of TAU and PESA binding to HAS were also obtained from the microcalorimetry, it was dαi/dt = 10
-3.62 (1 –
αi)0.91, dαi/dt = 103.41(1 – αi)1.17, respectively. The CD spectra of HSA in the presence and absence of TAU or PESA were nearly identical, which meant that TAU or PESA did not cause any high-ordered structural change of HSA.
The kinetics and binding study of TAU and its derivative PESA with serum albumin are helpful for understanding their effects on protein function during their transportation and distribution in blood, which would provide primary information for research and development of new drug.
Acknowledgements
This work was supported by grant from the National Natural Science Foundation of China (21362001), Guangxi Natural Science Foundation (Grant No. 2013GXNSFDA019005),Innovation Project of Guangxi Graduate Education (GXU11T31089), China Postdoctoral Science Foundation (grant No. 2011M500139), the Youth Foundation of Guangxi Botanical Garden of Medicinal Plants project (grant No. guiyaoji 201108)
REFERENCES
[1] E Albiñana; S Sacristán; R Martín del Río; JM Solís; JM Hernández-Guijo. Cellular and Molecular Neurobiology,
2010, 30(8), 1225-1233.
[2] S Schaffer; C Ju Jong; R KC; J Azuma. J Biomed Sci, 2010, 17(Suppl 1), S2. [3] W Abebe; MS Mozaffari. Am. J. Cardiovasc. Dis., 2011, 1(3), 293-311. [4] JE Olson; E Martinho. Journal of Neurochemistry, 2006, 96(5), 1375-1389.
[5] X Shao; Z Hu; C Hu; Q Bu; G Yan; P Deng; L Lv; D Wu; Y Deng; J Zhao; R Zhu; Y Li; H Li; Y Xu; H Yang; Y Zhao; X Cen. Toxicol Appl Pharmacol, 2012, 260(3), 260-270.
[6] C Jong; J Azuma; S Schaffer. Amino Acids, 2012, 42(6), 2223-2232.
[7] H Xie; B Yang; XM Zhou; FL Song; JM Li; K Zhou; W Hu; YQ Peng; SY Tang; LQ Yuan; SY Xiong; XB Liao.
Acta Pharmacol Sin, 2010, 31(3), 289-296.
[8] C LeBlond; J Wang; RD Larsen; CJ Orella; AL Forman; RN Landau; J Laquidara; JR Sowa Jr; DG Blackmond; YK Sun. Thermochim Acta, 1996, 289(2), 189-207.
[12] W Kong; Z Li; X Xiao; Y Zhao; P Zhang. J Therm Anal Calorim, 2010, 102(1), 331-336. [13] Y Zhao; D Yan; J Wang; P Zhang; X Xiao. J Therm Anal Calorim, 2010, 102(1), 49-55.
[14] O Samsonova; S Glinca; A Biela; C Pfeiffer; E Dayyoub; D Sahin; G Klebe; T Kissel. Acta Biomater, 2013, 9(2), 4994-5002.
[15] TK Dam; CF Brewer. Chem Rev, 2002, 102(2), 387-430.
[16] T Cedervall; I Lynch; S Lindman; T Berggard; E Thulin; H Nilsson; KA Dawson; S Linse. PNAS, 2007, 104(7), 2050-2055.
[17] S Leavitt; E Freire. Curr Opin Struc Biol, 2001, 11(5), 560-566. [18] JE Ladbury; BZ Chowdhry. Chem Biol, 1996, 3(10), 791-801.
[19] O Akgul; FS Kilic; K Erol; V Pabuccuoglu. Arch. Pharm. (Weinheim, Ger.), 2007, 340(12), 656-660. [20] M Ji; MY Liu; SL Gao; QZ Shi. Instrum Sci Technol, 2001, 29(1), 53-57.
[21] YX Ren; SL Gao; SP Chen; BJ Jiao; RZ Hu; QZ Shi. Chinese J Chem, 2004, 22(10), 1095-1101. [22] Y Li; J Jiang; G Fan; Y Ma; Z Huang. Chinese Sci Bull, 2011, 56(3), 269-274.
[23] NM O'Boyle; M Banck; CA James; C Morley; T Vandermeersch; GR Hutchison. J cheminform, 2011, 3, 33. [24] I Petitpas; AA Bhattacharya; S Twine; M East; S Curry. J Biol Chem, 2001, 276(25), 22804-22809.
[25] MF Sanner. J. Mol. Graph. Model., 1999, 17(1), 57-61. [26] O Trott; AJ Olson. J. Comput. Chem., 2010, 31(2), 455-461.
[27] DH Utomo; N Widodo; M Rifa'i. Bioinformation, 2012, 8(9), 426-429.
[28] N Suvannang; C Nantasenamat; C Isarankura-Na-Ayudhya; V Prachayasittikul. Molecules, 2011, 16(5), 3597-3617.
[29] RB Jacob; T Andersen; OM McDougal. PLoS Comput Biol, 2012, 8(5), e1002499. [30] T Yuan; AM Weljie; HJ Vogel. Biochemistry, 1998, 37(9), 3187-3195.
[31] PD Ross; S Subramanian. Biochemistry-US, 1981, 20(11), 3096-3102.
[32] L YanFen; J JunYing; F GaoChao; J Yu; H ZaiYin. Chinese Sci Bull, 2011, 56(3), 269-274. [33] W Ng. Aust. J. Chem., 1975, 28(6), 1169-1178.
[34] LD Hansen; EA Lewis; DJ Eatough; RG Bergstrom; D DeGraft-Johnson. Pharmaceut. Res., 1989, 6(1), 20-27. [35] DN Waters; JL Paddy. Anal. Chem., 1988, 60(1), 53-57.
[36] Ap Zhu; Lh Yuan; T Chen; H Wu; F Zhao. Carbohyd. Polym., 2007, 69(2), 363-370. [37] YJ Hu; Y Liu; XS Shen; XY Fang; SS Qu. J. Mol. Struct., 2005, 738(1–3), 143-147. [38] XX Cheng; Y Lui; B Zhou; XH Xiao; Y Liu. Spectrochim. Acta A, 2009, 72(5), 922-928. [39] JT Pelton; LR McLean. Anal Biochem, 2000, 277(2), 167-176.
[40] YZ Zhang; J Dai; XP Zhang; X Yang; Y Liu. J. Mol. Struct., 2008, 888(1-3), 152-159. [41] AC Wallace; RA Laskowski; JM Thornton. Protein Eng, 1995, 8(2), 127-134.