A Modified Postage-stamp Coverage Method for
Local Load Case of Transmission Service Charges
*N. H. Radzi
School of Information Technology & ElectricalEngineering The University of
Queensland St. Lucia, Brisbane,
Australia [email protected]
R.C. Bansal
School of Information Technology & ElectricalEngineering The University of
Queensland St. Lucia, Brisbane,
Australia [email protected]
Z. Y. Dong
School of ElectricalEngineering and Computer Science
The University of Newcastle Callaghan, New South
Wales, Australia [email protected]
M. Y. Hassan
Department of Power Electrical Engineering Universiti TeknologiMalaysia Skudai, Johor Bahru,
Johor Malaysia [email protected]
Abstract - The conventional postage-stamp coverage method assumes that the entire transmission system is used in wheeling, irrespective of the actual transmission facilities that carry the transaction. In order to achieve a fair transmission service charge methodology, modification need to be implemented on the conventional postage-stamp coverage method for a system that consists of local load case. The purpose of this modification is to trace the actual usage of an individual generator injecting power to the transmission line and charge the generator based on the actual amount of power usage in the transmission network. Two case studies based on an idealized 3-bus system and 10-machine IEEE 39-bus (New England) system are used to illustrate the proposed approach. The results show that with the proposed pricing approaches reflect a fair and equitable transmission pricing method as the generators are charged based on the actual usage in the transmission lines.
Index Terms – Local load case, Postage-stamp coverage method and transmission pricing method.
I. INTRODUCTION
The electricity industry has been undergoing a major transition over the past two decades. Utility power generation, transmission, and distribution used to be considered a natural monopoly. As a state-regulated monopoly, each local utility company was vertically integrated, meaning that it was responsible for providing its customers with the full range of electric services including all aspects of generating, delivering, and metering electricity.
In a restructured environment, the transmission network is where generators compete to supply large users and distribution companies. Thus, transmission pricing should be a reasonable economic indicator used by the market to make decisions on resource allocation, system expansion, and reinforcement [1]. The competitive environment of electricity _______________________________________________
*N. H. Radzi is pursuing her PhD from The University of Queensland and she is on study leave from Department of Power Electrical Engineering, Universiti Tun Hussein Onn Malaysia (UTHM), Batu Pahat, Johor, Malaysia.
markets necessitates wide access to transmission and distribution networks that connect dispersed customers and suppliers. Moreover, as power flows influence transmission charges, transmission pricing may not only determine the right entry but also encourage efficiencies in power market [1]. A proper transmission pricing could meet revenue expectations, promote an efficient operation of electricity markets, encourage investment in optimal locations of generation and transmission lines, and adequately reimburse owners of transmission assets [1]. Most important, the pricing strategies should implement fairness and be practical.
II. TRANSMISSION PRICING METHOD The transmission pricing methods can be distinguished into two parts [4]: (1) Locational charges: these charges differentiate the transmission use of system charges (TUoS) tariff according to the customers’ location within the grid; and (2) Non-locational charges: these chargers (also referred to as postage stamp methods) uniformly charge all transmission customers, irrespective of their location within the grid, according to a measure of their usage of the transmission network; this is usually their system-peak-coincident demand (kW) or annual energy demand (kWh).
A. MW-mile method
The most common method for locational charges that have been implemented by the utilities is the MW-mile method. This method is first transmission pricing strategy proposed for the recovery of fixed transmission costs based on the actual use of transmission network [5]. The method calculates charges associated with each wheeling transaction based on the transmission capacity use as a function of the magnitude of transacted power, the path followed by transacted power, and the distance traveled by transacted power [6]. Equation (1) shows the cost allocation principle of the method.
∑ (1)
where
R
(
u
)
is the allocated cost to customer u,k
C
cost of circuit k)
(
u
f
k k-circuit flow caused by customer uk
f
k-circuit capacity Total cost =∑
all k k
C
The MW-mile method is also used in identifying transmission paths for a power transaction. As such, this method requires active power flow calculations. The MW-mile method is the first transmission pricing strategy proposed for the recovery of fixed transmission costs based on the actual use of transmission network [6]. The method reasonably reflects the actual usage of transmission systems.
In MW-mile method, there are three different approaches on how the cost of each circuit is allocated to various users of the network that are [7]:
i) Absolute MW-Mile Method
Calculation is based on the magnitude of the MW-miles of network used and the directions of the power flow imposed on the circuit by user are ignored. Power flow imposed on the circuit i by the user k, , and is treated based on the following condition:
| | for direct and reverse power flows (2)
ii) Reverse MW-Mile Method
The reverse MW-mile approach takes into account of the power flows that are in reverse direction and the charge for each line is based on the net flows. The reason is that the reverse power flows reduce the burden on the line. Power flow imposed on the circuit i by the user k, , is treated based on the following condition:
= +ve for direct power flows and –ve for reverse power
flows (3)
iii) Dominant MW-Mile Method
The dominant MW-mile method can be considered as a hybrid of the absolute and reverse approaches. In this approach, network users are only charged on the basis of direct power flow imposed on each line. Reverse power flows are not counted so users responsible for the reverse power flows do not receive a credit like reverse MW-mile approach and do not pay any charge like the absolute MW-mile approach. In this method, power flow imposed on the circuit i by the user k, , is treated based on the following condition,
| | for direct power flows, or (4) 0 for reverse power flows
However, the existing MW-mile methods have limitations which prevent the wider application of this technique in electricity market practices. The issue in this method concerns with the counterflow users. This issue is still being debated on what basis the credit or reward should be given to the transmission user who reduces the total net flow of the transmission system. However, many transmission utilities felt uncomfortable with the idea of providing a service and in addition paying the users for using it. The reason is clear because by giving the credit to the transmission users for their contribution in counter flow could cause difficulties to the transmission utilities to recover the revenue requirement. Hence, the MW-mile method (negative-flow sharing) was introduced in [3].
iv) MW-mile method (negative flow-sharing
approach)
producing counterflows may not be easily accepted by the transmission service providers. In the proposed approach, the transmission owner and the users will share the benefits of the counterflow using the profit-sharing approach. The concept and formulation of the proposed approach in detail is explained in [3]. In this method, the negative value of fk(u) is shared between the transmission owner and users using profit sharing factor, r. This factor is determined according to the willingness of the transmission owner to share profit with the transmission users [6].
| | (5)
v) Monetary Flow Method
This method is an extension of the MW-mile method where it has some similar formulas and procedures as the MW-mile method. This method introduces a uniform measurement for transmission service usages by active and reactive powers [8]. These power flows are converted into monetary flows by using nodal prices. Because monetary flows are related to the nodal prices, the impacts of generators and loads on operation constraints and the interactive impacts between active and reactive powers can be considered [8].
However, in this paper only the active power is considered as it is more simple and easy to measure, fast and commonly used throughout the transmission utilities for determine the transmission service charges.
B. Postage-Stamp approach
For the non-locational charges, the Postage-stamp method has been used to cover the total transmission revenue. This method is traditionally used by electric utilities to allocate the fixed transmission cost among the users of firm transmission service. This method is an embedded cost method, which also known as the rolled-in embedded method. Postage-stamp method is based on the assumption that the entire transmission system is used, regardless of the actual facilities that carry the transmission service. The method allocates charges to a transmission user based on an average embedded cost and the magnitude of the user’s transacted power [1]. The wheeling charge for this scheme can be written mathematically as
(6)
Where Rt is wheeling charge for transaction t, TC the total transmission cost, Pt the power of transaction, Ppeak the system peak load.
The postage stamp method is considered to send incorrect and unfair economic signals since it ignores the state of the actual system operation. The method is very simple as no distinction is made between transactions with regard to the power flow path, supply or delivery points, or the time when
the transaction takes place [6].
i) Postage-Stamp coverage method
The postage-stamp coverage (or average) method is the methodology used to cover the total transmission system cost by sharing among the generators the costs associated with the unused capacity. The mathematical equation for the postage-stamp coverage method are:
for generator:
(7)
where Ck is the cost of circuit k, Ri the locational charges i, PGi the power served by generator i.
locational tariff for Gi
(8)
for load:
(9)
where Ck is the cost of circuit k, Ri the locational charges i, PLi the power served by load i.
locational tariff for Li
(10)
III. TRACING-BASED POSTAGE-STAMP
METHOD
The previously stated methods in Section II have been used by the power industry; they considered the real network conditions using power flow analysis, forecasted loads and the generation configuration. However, there is still room for improvement in order to achieve fairness and practicability such as the Postage-stamp coverage method. In this method, local load case is not considered. With the existence of local load at buses, the power served by generator or load to the transmission line system was reduced as some of the power will flow directly to the local load. Therefore, in this paper, the local load case is considered by modified the Postage-stamp
∑
∑
∑
=
= =
−
=
ni Gi nlin
k
n
i i k
P
R
c
PS
1
1 1
∑
∑
∑
=
= =
−
=
ni Li nlin
k
n
i i k
P
R
c
PS
1
coverage method and introduced the tracing-based Postage-stamp method.
The main purpose of this modification is to achieve the fair and equitable transmission pricing strategies where only the actual usage of an individual generator injected into the transmission line will be charged. This method can be implemented to both network systems either with or without local load case in order to determine a fair and equitable transmission charges for market users.
For generator, we determine the power injected from Gi to the transmission line which are connected directly to the bus i where the Gi is located. Power from generator at bus i, Gi, injected to transmission line system:
… (11)
where Pix, Piy and Pin is the power flow in the transmission line which connected directly with the bus i where generator, Gi is located.
Remaining of (12)
Gi contribute to Li = RGi (13)
where PGi is the power generation and Li the load at bus i. Hence, the actual usage of Gi in the transmission line system is PGiT.
For load, the steps are similar with the generator in order to trace the power usage in transmission line system. Li used the transmission line system:
… (14)
where Pix, Piy and Pin is the power flow in the transmission line which connected directly with the bus i where load, Li is located.
Remaining of (15)
Li received power from Gi = RLi (16)
Therefore, the actual usage of Li in the transmission line system is PLiT.
The development of new technique for transmission pricing method is to charge the market participants based on the actual usage in the transmission line system. The actual power usage in the line system from (11) and (16) will be used in postage-stamp coverage method to achieve a fair and equitable transmission service charge methodology.
Tracing-based postage-stamp method (for generator):
(17)
modified locational tariff for Gi
(18)
Tracing-based postage-stamp method (for load):
(19)
modified locational tariff for Li:
(20)
Through equations (11) – (20) the modification made on the conventional Postage-stamp coverage method where the local load case is considered. The new method which called the tracing-based Postage-stamp method was introduced in order to achieve fair and equitable transmission pricing strategies where considering the actual usage of individual users to the transmission line systems. In addition, it also covers the total transmission system cost by sharing among the users the costs associated with the unused capacity.
IV. CASE STUDIES
The modification approach has been tested on 3-bus system and 10-machine IEEE 39-bus (New England) system by using Matlab simulation programs. These case studies are based on DC power flow and losses are neglected. The wheeling transaction is assumed to involve only real power and the contributions of reactive power flows are also neglected. For simplicity, the percentages of charging between the users are divided equally which is 50% to the loads and 50% to the generators. In practice, the cost would be shared between the generator and the consumer in certain ratio, which would be determined by the regulatory authority [2].
A. Case 1: 3-bus system
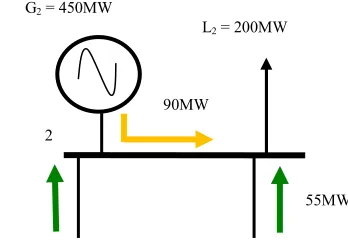
A simple 3-bus system illustrated in Fig. 1 is used to provide an understanding on the basic concept of proposed approach. The value of the impedances at line 1-2 is 0.02 p.u. and 0.01 p.u. for line 1-3 and 2-3. The total transmission revenue is $2,203,902.
∑
∑
∑
=
= =
−
=
ni GiT nlin
k
n
i i k
P
R
c
PS
1
1 1
∑
∑
∑
=
= =
−
=
ni LiT nlin
k
n
i i k
P
R
c
PS
1
Figure 1. An idealized lossless 3-bus system
Table I-IV illustrate the data obtained from a 3-bus system that are used in calculating the transmission service charge for the individual users. Each generating plant allocates its share with the Generalized Generation Distribution Factors (GGDFs) method while each customer’s share is determined with the Generalized Load Distribution Factors (GLDFs) method [9].
TABLE I. DATA OF GENERATOR 1 FOR 3-BUS SYSTEM __________________________________________________ Line Cost, k$ Capacity, Total Power Generator 1
MW Flow, MW
_________________________________________________
1-2 560.155 800 75 165
1-3 754.385 800 475 385
2-3 889.362 800 325 55
__________________________________________________
TABLE II. DATA OF GENERATOR 2 FOR 3-BUS SYSTEM _________________________________________________ Line Cost, k$ Capacity, Total Power Generator 2
MW Flow, MW
__________________________________________________
1-2 560.155 800 75 -90
1-3 754.385 800 475 90
2-3 889.362 800 325 270
__________________________________________________
TABLE III. DATA OF LOAD 2 FOR 3-BUS SYSTEM _________________________________________________ Line Cost, k$ Capacity, Total Power Load 2
MW Flow, MW
__________________________________________________
1-2 560.155 800 75 55
1-3 754.385 800 475 55
2-3 889.362 800 325 -55
__________________________________________________
TABLE IV. DATA OF LOAD 3 FOR 3-BUS SYSTEM _________________________________________________ Line Cost, k$ Capacity, Total Power Load 3
MW Flow, MW
__________________________________________________
1-2 560.155 800 75 20
1-3 754.385 800 475 420
2-3 889.362 800 325 380
__________________________________________________
As can be seen in Fig. 1, there is a local load at bus 2. Therefore, an analysis should be done by using the equation from (11) to (16) in order to trace the actual usage of generator G2 and load L2 in the transmission lines system.
Analysis for local load case at bus 2:
Figure 2. Local load case at bus 2: Analysis for G2
Generator at bus 2, G2
G2 injected power to transmission line system, PG2T: 90 270 360
450 360 90
90
As can be seen, instead of 450MW, G2 only uses 360MW in the transmission line system.
Figure 3. Local load case at bus 2: Analysis for L2
2
55MW G2 = 450MW
L2 = 200MW
90MW
55MW 2
270MW G2 = 450MW
L2 = 200MW
90MW
90MW L3 :800MW
1
3
2
[image:5.612.312.565.92.172.2] [image:5.612.323.526.273.390.2] [image:5.612.352.526.557.678.2] [image:5.612.44.293.577.658.2]Load at bus 2, L2
L2 used the transmission line system, PL2T:
55 55 110
450 360 90
90
Similar to generator case, instead of using 200MW, L2 actually uses 110MW in the transmission network system.
[image:6.612.314.570.68.262.2]According to the proposed approach, the negative flow MW-mile impacts of each line should be shared between the transmission owner, generators and loads. Therefore, the profit sharing factor, r will be 3. The effectiveness of this proposed method by applying the tracing-based Postage-stamp method can be seen by comparing it with the existing method (before modification on local load case) which illustrated in Table V and VI.
TABLE V. TRANSMISSION CHARGES FOR MARKET USERS BY USING THE EXISTING METHOD
User Generation/Load
(MW) sharing) + Postage-stamp MW-mile (negative-flow coverage method ($)
G1 550 638,487.23
G2 450 474,174.50
L2 200 190,080.35
L3 800 901,159.92
TABLE VI. TRANSMISSION CHARGES FOR MARKET USERS BY USING THE PROPOSED METHOD
User Power usage in the network
(MW)
MW-mile (negative-flow sharing) + Tracing-based Postage-stamp method ($)
G1 550 674,161.23
G2 360 438,500.50
L2 110 138,190.90
L3 800 953,049.37
As shown in Fig. 4, the transmission charge for G2 and L2 are decreased about 8.14% and 37.5%, respectively. In contrast, for G1 and L3, the transmission charges increased because they fully utilized the lines. In conclusion, by using the proposed method, it reflects a fair and equitable charging method as the charge is based on the actual usage in the transmission lines system.
Figure 4. Transmission service charges based on existing and proposed methods
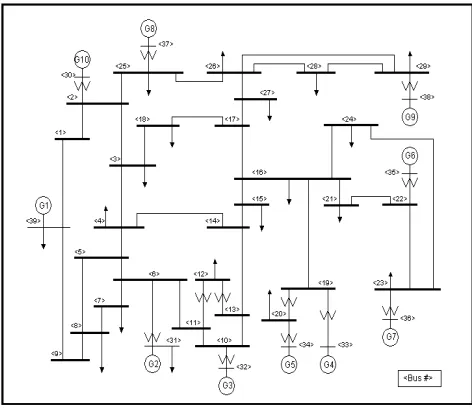
B. Case II: 10-machine IEEE 39-bus (New-England) systemsystem
Fig. 5 shows the IEEE 39-bus (New England) system with local load at bus 31 and 39. The transmission revenue is $ 12,224,200.00.
Figure 5. 10 machine IEEE 39-bus (New England) System 0.00
200,000.00 400,000.00 600,000.00 800,000.00 1,000,000.00 1,200,000.00
G1 G2 L2 L3
Tr
an
sm
issio
n
ser
vice
ch
ar
ges,
$
Users
[image:6.612.322.558.356.560.2]TABLE VII. GENERATORS USAGE OF TRANS SYSTEM
TABLE VIII. LOADS USAGE OF TRANSMISSION
Users Load (MW) Actual Power
Usage (MW)
L3 322 322 L4 500 500
L7 233.8 233.8
L8 522 522 L12 7.5 7.5 L15 320 320 L16 329 329 L18 158 158 L20 628 628 L21 274 274 L23 247.5 247.5 L24 308.6 308.6 L25 224 224 L26 139 139 L27 281 281 L28 206 206 L29 283.5 283.5
L31 532.1 451.72
L39 1104 937.23
Tables VII and VIII show the generation actual power usage of each generator and load It can be seen that generators G30, G32, G33, G37, and G38 have fully utilized the trans deliver their available power to the load. happens to load L3, L4, L7, L8, L12, L15, L21, L23, L24, L25, L26, L27, L28, and L2 hand, G31, G39, L31 and L39 have slightly the generation and load due to the local load and 39.
Users Generation (MW) Actual Power Usage (MW) ReG
G30 250 250
G31 1000 919.62
G32 650 650
G33 632 632
G34 508 508
G35 650 650
G36 560 560
G37 540 540
G38 830 830
G39 1000 833.23
SMISSION LINES
N LINES SYSTEM
r
) Remaining of Li(MW) 0 0 0 0 0 0 0 0 0 0 0 0 0 0 0 0 0 80.38 166.77
n / load and the d to the line flow.
, G34, G35, G36, smission lines to The same case L16, L18, L20, 29. On the other y difference from d case at bus 31
Figure 6. Non-locational transmission serv proposed Postage-stamp met
Figure 7. Non-locational transmission serv proposed Postage-stamp m
Figures 6 and 7 show the n charges for the transmission us traditional and proposed postage clearly seen that the generators and local load pay less charges compa without local load. With the propos G31, G39, L31 and L39 are reduce and 1.87% and on the other hand i other users by 0.56% to 0.86%.
0.00 10,000.00 20,000.00 30,000.00 40,000.00 50,000.00 60,000.00 70,000.00 80,000.00 90,000.00 100,000.00 110,000.00 120,000.00 130,000.00 140,000.00 150,000.00 160,000.00 170,000.00 180,000.00 190,000.00
L3 L7 L12 L16
Non-locati
onal
charges,
$
Postage-stamp coverage method
emaining of Gi (MW)
0 80.38
0 0 0 0 0 0 0 166.77
vice charges based on existing and thod for generator
vice charges based on existing and method for load
on-locational transmission sers calculated based on stamp methods. It can be
loads with the existence of ared to those market user sed method, the charges for d by 0.91%, 3.57%, 1.94% it increases the charges for
L20 L23 L25 L27 L29 L39
Load
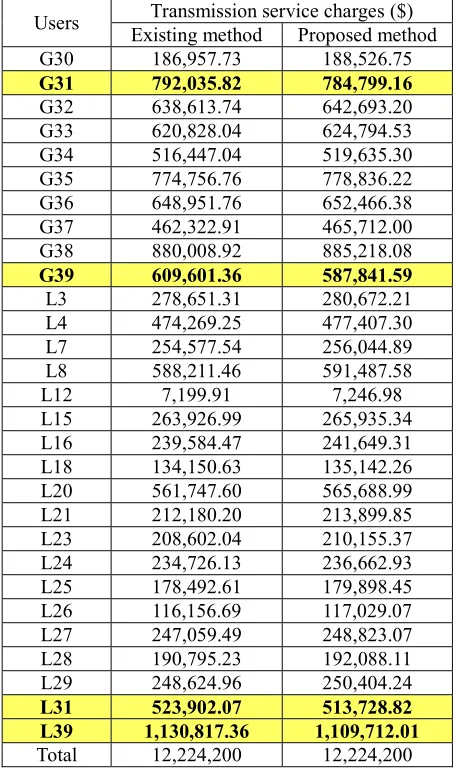
[image:7.612.41.282.97.247.2] [image:7.612.38.304.281.534.2] [image:7.612.317.567.300.535.2]TABLE IX. TRANSMISSION SERVICE CHARGES USING COMBINED MW-MILE (NEGATIVE FLOW-SHARING) WITH EXISTING AND PROPOSED POSTAGE-STAMP METHOD
Users Existing method Transmission service charges ($) Proposed method G30 186,957.73 188,526.75
G31 792,035.82 784,799.16
G32 638,613.74 642,693.20 G33 620,828.04 624,794.53 G34 516,447.04 519,635.30 G35 774,756.76 778,836.22 G36 648,951.76 652,466.38 G37 462,322.91 465,712.00 G38 880,008.92 885,218.08
G39 609,601.36 587,841.59
L3 278,651.31 280,672.21 L4 474,269.25 477,407.30 L7 254,577.54 256,044.89 L8 588,211.46 591,487.58 L12 7,199.91 7,246.98 L15 263,926.99 265,935.34 L16 239,584.47 241,649.31 L18 134,150.63 135,142.26 L20 561,747.60 565,688.99 L21 212,180.20 213,899.85 L23 208,602.04 210,155.37 L24 234,726.13 236,662.93 L25 178,492.61 179,898.45 L26 116,156.69 117,029.07 L27 247,059.49 248,823.07 L28 190,795.23 192,088.11 L29 248,624.96 250,404.24
L31 523,902.07 513,728.82
L39 1,130,817.36 1,109,712.01 Total 12,224,200 12,224,200
Table IX shows the transmission service payment for generators and loads based on postage-stamp method incorporated with the MW-mile method. Again, it can be observed that the proposed method provides opportunity to G31, G39, L31 and L39 to pay less charge due to the existence of the local load.
V. CONCLUSION
In conclusion, it is very important to design and develop an appropriate methodology that could allocate the transmission services based on the actual usage. The main goal of this paper is to develop a fair and equitable transmission pricing methodology for restructured market. The GGDFs and GLDFs are used to identify the net power flow and trace the contribution of each market user to the transmission lines system. The proposed pricing method, which includes the MW-mile (negative-flow sharing) and tracing-based Postage-stamp can be implemented in any situation of network system
either with or without local load case. This method successfully provides a fair and equitable transmission service charges as the market participants are charged based on their actual usage of the transmission lines system.
ACKNOWLEDGEMENT
Mrs. N. H. M. Radzi wishes to acknowledge the University Tun Hussein Onn Malaysia for their financial support. This work is supported in part by a Hong Kong Polytechnic University grant (G-U791) - Electricity Market Risk Management and Planning.
REFERENCES
[1] M. Shahidehpour, H. Yamin, and Z. Li, Market Operations in Electric Power Systems. New York: United States of America: The Institute of Electrical and Electronics Engineers, Inc., 2002. [2] A. R. Abhyankar, S. A. Soman, and S. A. Khaparde, "Optimization
approach to real power tracing: an application to transmission fixed cost allocation," IEEE Transactions on Power Systems, vol. 21, no. 3, pp. 1350-1361, 2006.
[3] K. L. Lo, M. Y. Hassan, and S. abd Jovanovic, "Assessment of MW-mile method for pricing transmission services: a negative flow-sharing approach," IET Proceedings -Generation, Transmission & Distribution, vol. 1, no. 6, pp. 904-911, 2007. [4] A. Bakirtzis, P. Biskas, A. Maissis, A. Coronides, J. Kabouris, and
M. Efstathiou, "Comparison of two methods for long-run marginal cost-based transmission use-of-system pricing," IEE Proceedings-Generation, Transmission and Distribution, vol. 148, no. 5, pp. 477-481, 2001.
[5] M.Z. Meah, A. Mohamed, and S. Serwan, "Comparative analysis of using MW-Mile methods in transmission cost allocation for the Malaysia power system," in Power Engineering Conference, Bangi, Malaysia, 2003, pp. 379-382.
[6] M. Y. Hassan, M. S. Majid, F. Hussin, H. A. Rahman, and K. L. Lo, "Certain Considerations In Pricing Unbundled Transmission Services," in IEEE International Power and Energy Conference, 2006, pp. 272-275.
[7] J. Bialek, "Topological generation and load distribution factors for supplement charge allocation in transmission open access," IEEE Transactions on Power Systems, vol. 12, no. 3, pp. 1185-1193, 1997.
[8] G. Duan, Z. Y. Dong, W. Bai, and X. F. Wang, "Power flow based monetary flow method for electricity transmission and wheeling price," Electric Power Systems Research, vol. 74, no. 2, pp. 293-305, 2005.