Optimization of Lower Limbs MR for Angiography with
Contrast Injection in 1.5 Tasla by Time of Flight Method
Seyed Ali Rahimi, Shokrolae Salar
*Faculty of Health, Mazandaran University of Medical Sciences, Kilometer 18 KHAZARABAD Road, SARI, Iran *Corresponding Author: [email protected]
Copyright © 2013 Horizon Research Publishing All rights reserved.
Abstract
During different studies on 1.5 Tasla equipments it was possible to obtain proper images with different values for different parts of limb. To date no research of such kind has been done in Iran and angiography of lower limbs is not done at present. In this study, it was tried to proper images of lower limbs considering the capabilities of designed protocol system.1.5 Tasla MRI equipment with optimized parameters for different positions calculated on the volunteers, patients and phantom was used. SNR and CNR images were compared, and categorized by radiologist based on diagnostic values. First stage of recovery current, a lower, mobile pre saturated pulses, NSA=1, matrix size 128 to 180 at direct phase and 256 direct frequency were selected. The qualitative value of the images 3 at pelvis area; 3 at femoral and knee areas; and 4 for knee was obtained. Total time required for imaging of lower limb was 45 minutes. This techniques is useful particularly for the patients who can not go under conventional angiography. The value of the MR images using contrast drug is higher than the images obtained by this method, however this method is cheaper.Keywords
Magnetic Resonance Angiography (MRI), Extremities, Lower Extremity1. Introduction
Atherosclerosis is a main problem in elderly men worldwide. Most of the study is in this regard is done on coronary artery and less Athens ion has been paid to the lower extremity (l). Concomitant Presence of this disease in periphery organs and cardiac vessels increases the incidence of death. In 25% of the patients having problem with the lower extremity there is significant, progress on pass of time, which leads to lack of motility gang rent, and organ for cut (1). Early diagnosis and prompt treatment help in prevention of acute complications. In addition, degree lower extremities problems indicating the rate of atherosclerosis in whole body organ which show's that the patient is at a high risk condition. Finding of the easy, quick and cheap procedure in diagnosis
of this disease always has been in the mind (1). Of the researchers of the non-invasive procedure excluding MRA1, there are other procedures like B-mode sonography and color Doppler which hare certain limitation at the back bone and gas and in the fat patients therefore need an export and skillful personal.
and recorded.
1.1. Time of Flight Angiography
(TOF) The time of flight angiography is used for the imaging of vessels. Usually the sequence type is a gradient echo sequences with short TR, acquired with slices perpendicular to the direction of blood flow. The source of diverse flow effects is the difference between the unsaturated and presaturated spins and creates a bright vascular image without the invasive use of contrast media. Flowing blood moves unsaturated spins from outside the slice into the imaging plane. These completely relaxed spins have full equilibrium magnetization and produce (when entering the imaging plane) a much higher signal than stationary spins if a gradient echo sequence is generated. This flow related enhancement is also referred to as entry slice phenomenon, or inflow enhancement (44).
Performing a presaturation slab on one side parallel to the slice can selectively destroy the MR signal from the in-flowing blood from this side of the slice. This allows the technique to be flow direction sensitive and to separate arteriograms or venograms. When the local magnetization of moving blood is selectively altered in a region, e.g. by selective excitation, it carries the altered magnetization with it when it moves, thus tagging the selected region for times on the order of the relaxation times (44).For maximum flow signal, a complete new part of blood has to enter the slice every repetition (TR) period, which makes time of flight angiography sensitive to flow-velocity. The choice of TR and slice thickness should be appropriate to the expected flow-velocities because even small changes in slice thickness influence the performance of the TOF sequence. The use of sequential 2 dimensional Fourier transformation (2DFT) slices, 3DFT slabs, or multiple 3D slabs (chunks) are depending on the coverage required and the range of flow-velocities (44).
2. Materials and Methods
Tesla 1.5 MRI VISTA Q800 model with trade mark of PIGKER with 13mT/m grad en power and frequency of Larrmor hydrogen with 63 Mega hertz on the middle of field. Body coil with 30 cm diameter of giving -receiving type was used. Phantom current was designed and produced for arrangement of the parameters.
This phantom was cubical form storage with diameters 30×15×15 centimeters as 2 mm diameter plastic tube was installed from both sides, in such a way that, pumping of current in plastic tube causes current in both sides of the storage in opposite direction. In this way the of opposite direction of current in lower extremity loud vessel is Assimilated 200-400 ml per minute water passes form the tube through pumping per minute (about the speed of blood current in lower extremity vessels).Time of flight method angiography and pulse frequency 2Dspoiled GRE toward
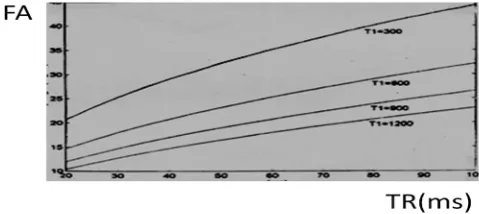
axial was considered for angiography of lower extremity and different parameters considering the speed limit and blood flow, time of proper imaging, proper rate of differentiating power, SNR1 and CNR2 were calculated and tested. These parameters were as follow: Time of repetition (TR), time of echo(TE), slice thickness(Th), matrix size, avemge number of imaging from signals (NSA) field of view (FOV), presaturmtes pulse (PS) and flip angle (FA).For selection of FA using Ernest angle formula equation 1 and figures of the fable number 1 from different TR graph number 1 was plotted (2).
[image:2.595.312.552.256.382.2]ae = l - Cose-TR/TI (1)
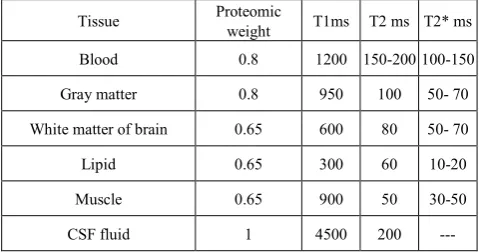
Table 1. T 2 and T, blood and the other tissues proteomic weight in Tesla 1.5 view (2)
T2* ms T2 ms T1ms Proteomic weight Tissue 100-150 150-200 1200 0.8 Blood 50- 70 100 950 0.8 Gray matter 50- 70 80 600 0.65
White matter of brain
10-20 60 300 0.65 Lipid 30-50 50 900 0.65 Muscle --- 200 4500 1 CSF fluid
For occultation of blood signal rate in 0-90 FA as compare to the adjacent tissues in non flow blood equation 2 and for current blood equation 3 of signal at spoiled echo gradient were used and relevant graphs were plotted using different considered figures for TR, TE and n (number of received pulses) and also for Tl, T2 of blood, lipid and muscle. In this way suitable FA and TR were selected (1).(Equation 2) equation of blood and tissues in non flow:
Sspoiled = ((N sina e-TR/T1) e-TE/T2* / (1-cose - TR/T1) -1) (2)
(N= proteomic density, a = Deviation angle) (Equation 3) equation of current blood signal:
Sn = M0 e- TE/T2* sina (ms+ (1-ms) An (3)
ms =(l-El)/(1-A) , A=El cosa , El=e-TR/T1, n = Z/V.TR (V=
blood speed, Z=slice thickness)
The plans were done on 30 volunteer (mean age 42) and two patients (75 and 63) were under study. The obtained images were compared to the SNR aspect of equation 4 and CNR of equation 5 (3, 4).
SNR=S blood /SD back ground (4)
CNR= S blood-S tissue /SD bark ground (5)
radiologist as follow: 1 for poor images, 2 for average images, 3 for good images and 4 for excellent images(5).
3. Findings
The obtained best FA using Ernest angle formula (equation 1) at TR of 20- 40 ms is about 10 degree (graph 1) .Based on the figure 1, at this range, of TR, rate of FA for muscle (T1=900 ms) was about 15 degree and for fat T1=300 ms about 20 degree.
Graph 1. Determination of best FA using Ernest equation for TR changes
[image:3.595.65.305.211.318.2]for tissues with different Tl. With increasing of T1 rate best FA for causing maximum opposition (deam-hght) dechnes.
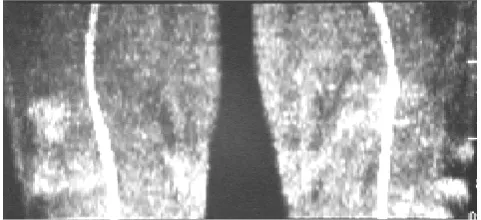
Figure 1. Discretion blood of vessels at FA=90 using TR/TE/TH= 14/6/5
parameters is due to the trochaic effect at tight region (left and middle images).Increasing of TR for 25 and reduction of FA to 60 degree at tight region the discretion of the vessels dies appeared (right image).The adjacent densities of the vessels and negated to the artifact deem which is done to unsoldering left –right (LR) axes for coding of the phase, which is shown in AP image.
The obtained figure for motionless blood (graph 2) show that blood signal at two selected TR of 15 and 30 ms(millisecond) is less than for signal and at FA a higher than 50 degree is approximately same as of tissue signals. Considering the plotted figures for current blood n rate for blood ranged from 1 to 15 and for blood was n=15 (graph 3).
Graph 2. Signal changes for different FA for dormant blood, fat and tissue
at TR 15 (for the right) and 30 millisecond (for the left), blood signal for two TR is less than fat.
Graph 3. Changes of blood flow signal for different speed (n) as compare
As shown in the figure you will notice that at TR=30 for receiving 2 RF pulse (n=2 or N=3) at the devoid angles lower than 75 and for N=5 at the deviation angles lower than 55 degree blood signal is higher than that of fat. At TR=15ms for N=3 at angles of deviation lower than 80 degree and for N=5 at the deviation angles lower than 65 degree blood signal is higher than that of fat. Blood signal for n= 15 for all FA at higher than 20 degree is less than fat signal. From the test of deviation angles for 40, 60 and 90 degree on 5 volunteers on pelvis site by the TR/TE/Th = 14/6/5 parameters the best score were for SNR and CNR and the diagnostic score were obtained at the 90 degree deviation angle (graph 4).
At the thigh and knee using TR/TE/FA/Th =14/6/49/6 parameters discrete of the vessels was observed, while the proximal and vessels showed continues, images by increasing TR for 25 ms(millisecond) and decline of FA for 60 degree the vessel images shown to be continuous (graph 4 and figure 2). At knee site using FA of 60, 40, 90 degrees by the parameters of TR/TE/Th =35/8/2.5 the best rate of SNR and CNR and diagnostic value. were obtained at FA=90 (graph 4, figure 2).
Graph 4. At pelvis site, median SNR changes in 5 volunteers using
[image:4.595.58.299.522.632.2]TR/TE/TH=14/6/5 parameters FA=90,FA=60 and FA=40 degrees, showing standard deviation, the highest SNR rate at FA=90.Since the conditions of the system during performance are not the same, sate of standard deviation are different tests significant.
Figure 2. The best view signals were obtained at 90 angle deviation. At
knee and tibia, the best rate of SNK CNR and the diagnostic value score using TR=35 were obtained. At shorter TR desecration of vessels was observed TR discretion of vessels was observed. Imaging was done from 60 slices during 5 minutes. The lower extremities were divided in 5 regions from bifurcation of aorta to the foot wrist took time of 25 minutes, and 20 minutes for peroration and shimming. In all daring 45 minutes imaging of all body organs was done.
4. Discussion
Considering the anatomy and physiology of the body, complexity of vessel network and diameter of the vessels there great changes of blood in current form. Also during cardiac cycle flow speed changes with different rates in different blood vessels particularly of lower extremity during systolic and diastolic functions. Different blood vessels diseases, cause charges are the form and flow speed.
All of these factors in addition the complexity the other unnatural natural variations are the reasons not to have a clear cut and accurate definition about blood flow and based on that, to define MRA Parameters (which is flow dependent) in this condition, it is passable to know the bestparameters and test them by knowing the form speed, direction and type of blood flow using cert specific formula then obtains the liable to propose results. On this basis, in this designing, theoretical calculation related to each parameter, relation and related to each parameter to each other and also the ability the system were considered together and tested. Based on comparison of a the graphs between non flow blood and proximal tissues at TR=20 ms (millisecond) the best deviation angle is equal to 10 degree. In this condition, FA and needed signal for proper image was not obtained. In a study using TR/TE/FA=15/5/15 parameters and turbo flash no rescannable image was produced (5, 30).In the graphs related to the comparison of blood flow with different speeds and proximal tissues, at high speeds blood flow pass completely from the slice (N = 1), optimized FA is 90 degree, and when blood flow reduces gradually such an extent that number of receiving pulses increases to 20 to 3, optimized FA also reduces to less than 75 degree. In case of receiving RF pulses more than 3 to 5 optimized FA reaches to less than 55 degree.
Generally deviation angles of 50 to 90 degrees are used (6, 33, 34). In a study by Thomas and et al, in 1994, parameters of TR/TE/FA=50/7.4/60 and thickness of 5 mm at pelvis site and of 33/6.7/60 thickness of 2.9 ml from knee to the tight ware used and there fine, reasonable images as compare with the normal angiography was produced (7). Rolf and et al, in 1998 incorporative study used parameters of TR/TE/FA=434-608/7/70 along with Gating method of 2D-TOF with 3D method of injecting contrasts at power extremity (8, 35, 36, and 37).
Susan et al, in 1999 an john et al, in 1998, recommended TR=30 in optimizing MR angiography parameters for power extremity using 2D-TRF method with deviation angles of 60-70 and 5 mm thickness of 2.5-2.9mm for the knee and tibia (9, 10, 11, 12, 38).At the end sites of tight and knee at lower TR and higher FA, blood vessel image was observed descried.
In which, by increasing TR, decreasing of FA and slice thickness, continuous vessel image was produced. In the organs, particularly at the end due to peripheral resistance vessels, trochaic flow was observed in which in a gratin period of time stoppage of blood flow is observed. If blood stoppage occurs concomitantly during filling of matrix middle k lower there would be reduction of signal, which is shown as low signal desecrated points on the image (13, 14, 15, and 39). TR increase particularly along with increase of imaging time form each slice results in uncompleted fill1ng of blood to the middle line of k only at the time of blood stoppage. Reduction of imaging time for each slice to 1 second causes elimination of opaque and respiratory artifacts (16, 17, 18, and 40). Quality of the images at this region due to this reason increases at short TR (about 15 ms). But this reduction at knee and tibia causes desertion of blood vessels. Otherwise, use gating which in turn causes increment of imaging time. In lower extremity which takes longer time, there is need of applying quick method. 2D-TOF which is a quick method, due low differential efficiency and saturating of apparel flow of slice do not have the same diagnostic value as that of general angiography and or DSA (having high differential efficiency) (19, 20, 21, and 41). But inspire of this disadvantage because cost bereft painless in help full may patients don't prefer general angiography .in this designing some what proper images from pelvis, tight, knee and tibia during reasonable time (45minates) it was shown that is use full and unique for many patients (22, 23, 24). Renovation images at power extremity would lead to the overlapping of the left and right organs vessels if done normally. Therefore by selection of suitable parameters in renovation of MIP it is possible renovate organs images separately by rotating angles of 30 degree (25, 26, 27and 28). Placement of expected site at the middle of coil is very necessary, which is done through adding of pads under pelvis, knee and foot wrist. Purchasing of good MR instilment and considering the efficiency in producing least TE and TR also having suitable TE and the other advantages such as reading MOTSA, TONE methods, having 180 degree pulse at the beginning of GRE sequences. Along with specific coil for
organ in taking more accurate images image is important (42, 43and 44).
Acknowledgments
We sincerely appreciate to dear professor Nader Riahi Alam for guidance.
REFERENCES
[1] Edleman; Hesrelink; Zlatkin: Clinical magnetic resonance imaging. 1996.
[2] E.james Potchen, E.Mark Haack, James E. Siebert, Alexander Goltschalk. Magnetic resonance angiography. Mosby, 1993. [3] Catherine w; Carolyn k. MRI in practice.Blackwell science
ltd, 1998.
[4] Ray h hashemi; William G: Bradley,JR. MRI the basics . Baltimore: Williams & willkins, 1997.
[5] David d. stark; William G; Bradly, JR. Magnetic resonance imaging. Mosby - year book, second edition, volume one, 1992.
[6] Martin R. prince; Thomas M. Grist; Grog F. Debatin. 3D contrasts Mr Angiography. Springer, 1999.
[7] H.farner; J. staubesand . Sobota atlas of human anatomy 2. Baltimor: urban & schwarzenberg, 1998.
[8] B.M Cramor; E Schlegel ; M. Boos , G. Laub . MR angiography of vessels in the pelvic region and the lower extremities for occlusive arterial disease. Electro medica. 1990.58: 89-95.
[9] Steinberg F ; Yucel Ek ; Duwon lin a; Zouza sp. Peripheral vascular and abdominal application of Mr Flow imaging techniques. magi- reson-med. 1990. 14 (2) : 315-20.
[10] Hertz-Sm RA; et al. Comparison of MRA and contrast autobiography in peripheral arterial stenos is. Am. J. Surj. 1990 Aug. 166(20): 112-6.
[11] Robert R. Edelman; Daisy C; John S. Fast time - of - flight Mr Angiography with improved background suppression. Rediology. 1991. 179: 767-870.
[12] Weili lin E; Mark H; Robert R. Edelman. Black blood angiography. Radiology. 1991. 181 : 655 – 660.
[13] Jonathan S; Gerhard H; Richard H. Three dimensional time - of - flight mr angiography : application in the abdomen and thorax. Radiology. 1991. 179: 261 – 264.
[14] Susan A; Tetsuya M; Peter L; Gray M; William D; Frederick S; etal. Peripheral arterial occlusive disease : prospective comparison of mr angiography and color duplex US with conventional angiography . Radiology. 1991 - 178: 695-700. [15] Steven V. Lossef; Sunder S. Rajan ; Richard H. Palt ; Mark
[16] Kirsten E; George G ; Linda A; Kenne- th R; J. paul F. MR angiography as the sole method in evaluating abdominal aortic aneurysms: correlation with conventional techniques and surgery . Radiology 1994. 192 345 – 350.
[17] J. Shannon Swan; Ian A. sport. Peripheral Mr Angiography. mri decisions international 1994 . spring : 15 - 21.
[18] Georg G. hartoell; J. poul Finn; Martin zenni; Mylan C. cohen; Damian E. Dapuy; G. wheeler; etal. MR imaging of the thoracic aorta: comparison of spin - echo, angiographic, and breath - bold techniques. Radiology. 1994 . 191 : 697 – 704. [19] Thomas R .hccauley ; Ahmed Monib ; Kevrin w.Dickey; John
clemett; George H.Meier; Thomas K.Egglin; etal. Peripheral vascular occlusive disease: accuracy and reliability of time- of- flight mar angiography. Radiology.1994-192:351-357. [20] Geert G; Peter M; Peter C; Cornelis V; John H; Albert R.
Magnetic resonance angiography of dialysis access shunts: initial results. Magnetic resonance imaging 1996-14(2): 197-200.
[21] Kaiviu J; Michel W; Alfons G; Peter J; Joseph M, Peripheral vascular tree stenoses: detection with subtracted and no subtracted mr angiography. Radiology 1998-206:673-681. [22] Kaiviu J; Michiel W; Alfonse G; Peter J; Joseph M.
Peripheral vascular tree stenoses: evaluation with moving-bed infusion- tracking mr angiography. Radiology.1998-206:683-692.
[23] Stephen F;Robert C; Kevin G; Victor J; Kryss K; Jerzy S.Aortic and lower extremity arterial disease: evaluation with mr angiography versus conventional angiography. Radiology 1998-206:693-701.
[24] Bryan R; David M; Martin R;In vitro model of arterial stenosis: correlation of mr signal dephasing and trans-stenotic pressure gradients
.
Mag.reson. imaging 1998-16(3):301-310.
[25] Rolf R;Lars K; Ernesto C; Uwe B;Jochen G;EckhardtG
.
Electro cardio graph triggered two- dimensional time-of-flight versus optimized contrast enhanced three dimensional mr angiography of the peripheral arteries. Magn. Reson. Imaging 1998-16(8):887-892.[26] Alan R:J Graham P; Angus R;Mark B
.
Lower-limb deep venus thrombosis: direct mr imaging of the thrombus. Radiology. 1998.209:349-355.[27] John A; Douglas M; Stuart C; Arthur C
.
Two-dimensional time- of- flight mr angiography of the lower extremities: artifacts and pitfalls.
AJR. 1998-171:129-135.
[28]
Jos J; Martin N; Rob J; Peter M; Albert R;
Jan V.
Scan optimization of gadolinium contrast-enhanced three dimensional mra of peripheral arteries with multiple bolus injections and inrvitro validation of stenosis.
Quantification magn. Reson. Imaging. 1999. 17(1): 47-57.
[29] Romhild M; Chris J
;
Max A.
MR digital subtraction angiography with asymmetric echo acquisition and complex subtraction: improved lumen and stensis visualization. Magn.rosen.imaging. 1999. 17(2): 305-311.[30] Ward EV, Galizia MS, Usman A, Popescu AR, Dunkle E, Edelman RR,Comparison of quiescent inflow single-shot and native space for nonenhanced peripheral MR angiography.J Magn Reson Imaging. 2013 Apr 5. doi: 10.1002/jmri.24124.
[31] Lim RP, Fan Z, Chatterji M, Baadh A, Atanasova IP, Storey P, Kim DC, Kim S, Hodnett PA, Ahmad A, Stoffel DR, Babb JS, Adelman MA, Xu J, Li D, Lee VS. Comparison of nonenhanced MR angiographic subtraction techniques for infragenual arteries at 1.5 T: a preliminary study. Radiology. 2013 Apr;267(1):293-304. doi: 10.1148/radiol.12120859. Epub 2013 Jan 7.
[32] Kramer M, Nkenke E, Kikuchi K, Schwab SA, Janka R, Uder M, Lell M. Whole-body magnetic resonance angiography for presurgical planning of free-flap head and neck reconstruction. Eur J Radiol. 2012 Feb;81(2):262-6. doi: 10.1016/j.ejrad.2010.11.016. Epub 2010 Dec 13.
[33] Floery D, Fellner FA, Fellner C, Ginthoer CM, Uder M, Pallwein-Prettner L, Roeper-Kelmayr J, Dirisamer A. Rofo, [Time-resolved contrast-enhanced MR angiography of the lower limbs: solving the problem of venous overlap].. 2011 Feb;183(2):136-43. doi: 10.1055/s-0029-1245722. Epub 2010 Oct 11. German.
[34] Koenigkam-Santos M, Sharma P, Kalb B, Carew J, Oshinski JN, Martin D ,Lower extremities magnetic resonance angiography with blood pressure cuff compression: quantitative dynamic analysis.. J Magn Reson Imaging. 2009 Jun;29(6):1450-6. doi: 10.1002/jmri.21777.
[35] Jang J, Kim BS, Kim BY, Choi HS, Jung SL, Ahn KJ, Byun JY ,Reflux venous flow in dural sinus and internal jugular vein on 3D time-of-flight MR angiography..,Neuroradiology. 2013 Jul 19.
[36] Naguib NN, Bohrt K, Nour-Eldin NE, Schulz B, Tawfik AM, Siebenhandel P, Bodelle B, Eichler K, Moritz A, Vogl TJ, Zangos S Whole-body MR angiography: First experiences with the new timct technology with single contrast injection.,J Magn Reson Imaging. 2013 May 16:0. doi: 10.1002/jmri.24182.
[37] Ward EV, Galizia MS, Usman A, Popescu AR, Dunkle E, Edelman RR ,Comparison of quiescent inflow single-shot and native space for nonenhanced peripheral MR angiography..J Magn Reson Imaging. 2013 Apr 5. doi: 10.1002/jmri.24124. [38] Gitsioudis G, Stuber M, Arend I, Thomas M, Yu J, Hilbel T, Giannitsis E, Katus HA, Korosoglou G.Steady-state equilibrium phase inversion recovery ON-resonant water suppression (IRON) MR angiography in conjunction with superparamagnetic nanoparticles. A robust technique for imaging within a wide range of contrast agent dosages. J Magn Reson Imaging. 2013 Feb 15. doi: 10.1002/jmri.24043. [39] Lim RP, Fan Z, Chatterji M, Baadh A, Atanasova IP, Storey P,
Kim DC, Kim S, Hodnett PA, Ahmad A, Stoffel DR, Babb JS, Adelman MA, Xu J, Li D, Lee VS. Comparison of nonenhanced MR angiographic subtraction techniques for infragenual arteries at 1.5 T: a preliminary study. Radiology. 2013 Apr;267(1):293-304. doi: 10.1148/radiol.12120859. [40] van den Bosch HC, Westenberg JJ, Caris R, Duijm LE,
Tielbeek AV, Cuypers PW, de Roos A. Peripheral arterial occlusive disease: 3.0-T versus 1.5-T MR angiography compared with digital subtraction angiography. Radiology. 2013 Jan;266(1):337-46. doi: 10.1148/radiol.12112184. Epub 2012 Nov 9.
doi: 10.1148/radiol.12111804.
[42] Bauman G, Scholz A, Rivoire J, Terekhov M, Friedrich J, de Oliveira A, Semmler W, Schreiber LM, Puderbach M. Lung ventilation- and perfusion-weighted Fourier decomposition magnetic resonance imaging: in vivo validation with hyperpolarized 3He and dynamic contrast-enhanced MRI. Magn Reson Med. 2013 Jan;69(1):229-37. doi: 10.1002/mrm.24236.
[43] Kramer M, Nkenke E, Kikuchi K, Schwab SA, Janka R, Uder M, Lell M. Whole-body magnetic resonance angiography for presurgical planning of free-flap head and neck reconstruction. Eur J Radiol. 2012 Feb;81(2):262-6. doi: 10.1016/j.ejrad.2010.11.016.