Proceedings International Conference of Technology Management, Business and Entrepreneurship 2012 (ICTMBE2012), Renaissance Hotel, Melaka, Malaysia 18-19 Dec 2012
643
PERFORMANCE ANALYSIS ON ISLAMIC UNIT TRUST
Suhana, M. (Corresponding author)
Department of Finance, Faculty of Business Management, UiTM Johor Kampus Johor Bahru, Jln Heman, Kg Aman, Larkin, 80350 Johor Bahru, Johor, Malaysia
Tel: +6019-7459392 E-mail: [email protected]
Raja Zuraidah, R.
Faculty of Technology Management and Business, Universiti Tun Hussien Onn Malaysia, 86400 Batu Pahat, Johor, Malaysia
Tel: +607-4533932 E-mail: [email protected]
Nooririnah, O.
Faculty of Engineering Technology, Universiti Teknikal Malaysia Melaka, Hang Tuah Jaya, 76100 Durian Tunggal, Melaka, Malaysia
Tel: +6012-9500154 E-mail: [email protected]
Ruziah, A. L.
Department of Finance, Faculty of Business Management, UiTM Johor Kampus Segamat, KM. 12, Jln Muar, 85009 Segamat, Johor, Malaysia
Tel: +607-9352119 E-mail: [email protected]
Zaibedah, Z.
Department of Finance, Faculty of Business Management, UiTM Johor Kampus Segamat, KM. 12, Jln Muar, 85009 Segamat, Johor, Malaysia
Tel: +607-9352355 E-mail: [email protected]
ABSTRACT
Proceedings International Conference of Technology Management, Business and Entrepreneurship 2012 (ICTMBE2012), Renaissance Hotel, Melaka, Malaysia 18-19 Dec 2012
644
KLCI. This study hope to help the investors in their decision making; whereby this study provides information and prior knowledge to the investors which Islamic unit trust funds is the best fund to invest. Moreover, revealing the specific volatility patterns in returns might also benefits investors in risk management and portfolio optimization.
Keywords: Islamic Unit Trust; Islamic Investment; Sharpe Index, Treynor Index and Jensen Alpha
Introduction
Unit trust funds or well known as mutual funds is an investment created by investment management companies with the concept of pooling investments from both individual and institutional investors. This type of investment is getting popular among investors and has been talk of the town because of the advantages that can be enjoyed by investors. The three most popular advantages are, firstly, unit trust reduce the risk of investing in the stock market by diversification. Second, they provide professional management by the industry experts. Thirdly, as the concept is pooling of investment, unit trust allow small investors to hold a diversified portfolio.
The activities of professional fund managers within the industry involve a series of delegated process with investors increasingly delegating the management of their fund managers. In recent years, there has been a sharp increase in the scale of delegated investing as readily evident from the size of asset under management. The rapid growth of the unit trust industry could be observed from the number of management companies from 13 in 1992 to almost triple the size to 39 in 2009. Similarly, the number of funds approved has also increased to 595 from 39 for the same period. A number of factors have jointly contributed to the rapid expansion of the industry and those include strong economic and good stock market performance, expansion of the local stock market and success of the privatization companies.
The growth can be attributed to the increasing investor’s interest in seeking inexpensive access to professional management of their funds. While the return of a given fund is generally observable by investors, the extent to which fund characteristics influences fund performance may not be obvious to the investing public at large. Given the increasing popularity of mutual fund as an investment vehicle for individual investors, it would certainly be of interest for investors to know how fund performance relates to fund’s fundamental characteristics. The awareness to know the performance of their investment makes them more educated and alert when doing the investment.
Proceedings International Conference of Technology Management, Business and Entrepreneurship 2012 (ICTMBE2012), Renaissance Hotel, Melaka, Malaysia 18-19 Dec 2012
645
‘gharar’ or ambiguity.
The performance on Malaysian Islamic and Conventional unit trust has been a very well researched topic. This study focused on performance of Malaysian Islamic unit trust funds in comparison to prices of the market benchmark which is FTSE Bursa Malaysia KLCI (KLCI).
This study aims in helping Muslim investors to evaluate the performance of Islamic and unit trust industry in Malaysia over the 120 months period commencing January 2005 until December 2009. Performance on 4 Islamic unit trust funds and 4 conventional unit trust funds in Malaysia are evaluated based on the standard performance measures for funds known including Jensen, Sharpe and Treynor index. Eventually, the performance Islamic unit trust is compared against its benchmark which is KLCI. The finding should support the conclusion that unit trust can be an ideal investment for investors seeking for diversification.
Past Researches
Many researches were done on the performance of unit trust funds. The hot topics been debated for decades include the risk-return performance, selection and market timing abilities of fund managers and the level of diversification of unit trust funds.
Majority of the funds did not perform as well as the New York Stock Exchange (NYSE) index, (McDonald, 1974). Reversely, the multiple levels of beta exist for 37 funds, (Kon and Jen 1979). The 14 funds have positive overall timing performance but none is statistically significant at a reasonable level, (Kon 1983).
Fund managers do not retain market timing abilities but they also find a trade-off between market timing and security selection abilities, (Chen et al. 1992). A positive correlation between selectivity and timing performances and the results also show that the funds have not achieved the expected level of diversification, (Annuar et al. 1997). The risk-return characteristics of the unit trust funds are generally inconsistent with their stated objectives. The market timing abilities of managers are found to be poor for both the actively and passively managed funds, (Shamsher et al. 2000).
The other hot debated topic is the relationship between mutual funds and local stock market indices. One of the earliest studies on Islamic Funds in Malaysia was done by (Annuar, Shamsher and Ngu 1997) found that these Malaysian funds did outperform their benchmark, but were poor at timing the market. (Shamsher et. al. 2000) study findings show that there is no significant difference in the performance of actively and passively managed funds. (Bailey and Lim 1992) found significant correlations between the returns of country funds and the returns of the market index. However, they found that the pricing of country 3 funds reflects more of the domestic US stocks than of the foreign equities in which these funds are invested.
Proceedings International Conference of Technology Management, Business and Entrepreneurship 2012 (ICTMBE2012), Renaissance Hotel, Melaka, Malaysia 18-19 Dec 2012
646
market. Their findings also suggest that the choice of market benchmark is important in measuring the investment performance of Malaysian mutual funds. The analyses done by (Abdullah et. al. 2002) found that both Islamic and conventional fund slightly underperformed the Kuala Lumpur Composite Index (KLCI) benchmark. They also found that returns of the Islamic and Conventional Funds are quite the same.
Past researches have shown various results on the performance of the Islamic unit trust fund in Malaysia. This may derive from the fact that previous studies include all types of Islamic fund which are bond fund, balance fund, fixed income fund as well as equity fund in measuring their performance. In the current study, since majority (50%) of the Islamic unit trust fund is equity fund, the data of eight unit trust funds were selected to measure specifically the performance of those funds. Based on the earlier works by (Sharpe 1966), (Treynor 1965) and (Jensen 1968) in the evaluation of portfolio performance, the present study again trying to evaluate the Islamic equity fund performance by analysing both risk and return in comparison to the KLCI.
Methodology
This paper focuses on examining Unit Trust performance in Malaysia from using Sharpe, Treynor, and Jensen measure in comparison with market index, KLCI. The performance for 4 Islamic unit trust funds and 4 conventional unit trust funds that measured by secondary data using monthly Net Asset Value (NAV).
The monthly fund prices were obtained from Bursa Malaysia. Information about the fund’s dividend payment was collected from the annual reports and the fund’s prospectus through official websites. The risk-free rate was obtained from Treasury-bills for 5 years. The average monthly T-bills were calculated in order to get absolute amount by 2.92.
Measuring Return
Return calculated based on the formulas below which refer to the average monthly return achieved by the mutual funds under consideration. The monthly returns for the evaluation period were calculated using the following equation:
R1= NAV1 + DIV1 – NAV0 (1)
NAV0
R1 = Monthly return of a unit trust in the period 1
NAV1 = Monthly net asset value per unit of a unit trust in the period 1
DIV1 = Dividend of the unit trust in the period 1
Proceedings International Conference of Technology Management, Business and Entrepreneurship 2012 (ICTMBE2012), Renaissance Hotel, Melaka, Malaysia 18-19 Dec 2012
647 Measuring Average Return
R = ∑ r (2)
n
R = Average return for the unit trust. ∑ r = Sum of a unit trust in the year1.
N = Number of monthly return.
Measuring Risk
Risk was measured based on the standard deviation of the monthly returns which was calculated using the following formula:
SD = ∑( R – R )2
(3)
n
SD = Standard deviation (total risk) of the unit trust. N = Number of monthly return.
R = Monthly returns of the unit trust. R = Average return of the unit trust
Coefficient of Variation
Coefficient of variation (CV) is a measure of relative variability that indicates risk per unit return. It is equal to standard deviation divided by the mean value.
CV = σ (4)
R Where;
σ = Standard deviation (the total risk) of the unit trust R= Average return of a unit trust
Sharpe Performance Measurement
Sharpe Index consists of a composite measure to evaluate the performance of Unit Trusts. The measure followed closely Sharpe earlier work on the capital asset pricing model (CAPM), dealing specifically with the capital market line (CML).
Adjusted Sharpe measure of portfolio performance given by the following formula:
SI = Risk Premium = R1 – rfr (5)
Total Risk σ1
Proceedings International Conference of Technology Management, Business and Entrepreneurship 2012 (ICTMBE2012), Renaissance Hotel, Melaka, Malaysia 18-19 Dec 2012
648
R1 = the average rate of return for portfolio 1 during specified time period.
Rfr = the average rate of return on risk-free assets during the same time period. σ1 = the standard deviation of the rate of return for portfolio 1 during the time
period.
Treynor Performance Measurement
Treynor Index measures the performance that would apply to all investors-regardless of their risk preferences. Building on developments in capital market theory, Treynor introduced risk-free assets that could be combined with different portfolios to form a straight portfolio possibility line. He showed that rational, risk intolerance investors would always prefer portfolio possibility line with larger slopes because such possibility line is equal to:
T = R1 – RFR (6)
β1
Where: R1 = the average rate of return for portfolio 1 during a specified time
period.
RFR = the average rate of return on a risk – free investment during the same time period.
β1 = the slope of the fund’s characteristic line during that time period
(this indicates the portfolio’s relative volatility).
Jensen Performance Measurement
Jensen Index measure bases in the capital asset pricing model (CAPM). All versions of the CAPM calculate the expected one-period return on any security or portfolio by the following:
α= R – [RFR + β1 (RM – RFR)] (7)
Where:
R = the expected return on security or portfolio 1
RFR = the one – period risk – free interest rate
β1 = the systematic risk (beta) for security or portfolio 1
RM = the expected return on the market portfolio of risky assets
The expected return and the risk – free return vary for different periods. Consequently, this type of portfolio performance measurement concerned with the time series of expected rates of return for Security or Portfolio 1.
Results and Discussion
Proceedings International Conference of Technology Management, Business and Entrepreneurship 2012 (ICTMBE2012), Renaissance Hotel, Melaka, Malaysia 18-19 Dec 2012
[image:7.595.100.537.213.321.2]649 The Descriptive Analysis
Table 1 : Average Return and Total Risk (measured by Standard Deviation)
Coefficient of Variation and Beta Coefficient for Conventional Unit Trust Funds
CONVENTIONAL Average Return Standard SD
Coefficient
of CV Beta
T BILL UNIT TRUST
FUNDS Return Rank Deviation Rank Variation Rank
RHB Capital -0.93 5 14.2 1 -15.2688 5 0.76 2.9200
MAAKL Value Fund 0.60 2 4.47 4 7.4500 2 0.38 2.9200
PRU Small-cap fund 0.59 3 5.29 2 8.9661 1 0.29 2.9200
KLCI 0.66 1 4.58 3 6.9394 3 1 2.9200
Select Income Fund 0.27 4 1.41 5 5.2222 4 0.05 2.9200
[image:7.595.94.544.596.705.2]Table 1 shows the average return and total risk (measured by standard deviation), coefficient of variation and beta coefficient for conventional unit trust funds. The calculations were done using estimating equation (2), total risk (3), and coefficient of variation (4). Result shows that the highest average monthly returns are market index (KLCI) which shows the value of 0.66. Other funds including MAAKL Value Fund, PRUsmall-Cap Fund and Select Income Fund were below the average value of market index.
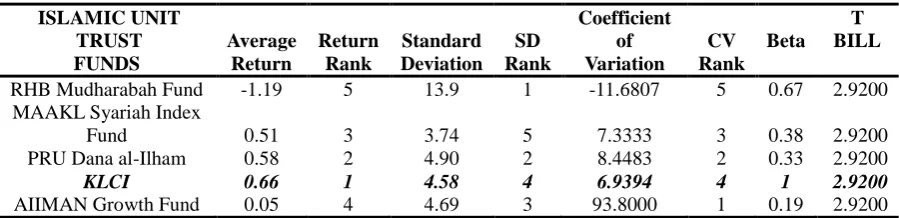
Table 2 : Average Return and Total Risk (measured by Standard Deviation)
Coefficient of Variation and Beta Coefficient for Islamic Unit Trust Funds
ISLAMIC UNIT
TRUST Average Return Standard SD
Coefficient
of CV Beta
T BILL
FUNDS Return Rank Deviation Rank Variation Rank
RHB Mudharabah Fund -1.19 5 13.9 1 -11.6807 5 0.67 2.9200
MAAKL Syariah Index
Fund 0.51 3 3.74 5 7.3333 3 0.38 2.9200
PRU Dana al-Ilham 0.58 2 4.90 2 8.4483 2 0.33 2.9200
KLCI 0.66 1 4.58 4 6.9394 4 1 2.9200
AIIMAN Growth Fund 0.05 4 4.69 3 93.8000 1 0.19 2.9200
Proceedings International Conference of Technology Management, Business and Entrepreneurship 2012 (ICTMBE2012), Renaissance Hotel, Melaka, Malaysia 18-19 Dec 2012
650
RHB Mudharabah Fund show negative values (-1.19).
Total Risk
Standard Deviation
Table 1 show that the highest total risk calculated was for RHB Capital followed by PRUsmall-Cap Fund. The SD for MAAKL Value Fund and Select Income Fund were lower than SD of KLCI as compared to market risk level which is 4.58. Meaning that, the overall unit trust funds have higher risk compared to market index except Select Income Fund. It shows that Select Income Fund has lower internal risk factor compared to the overall risk. This fund also shows lower values by comparing Conventional and Islamic unit trust funds. Result in Table 2 shows that RHB Mudharabah Fund has the highest total risk by 13.9 followed by PRUdana al-ilham and AIIMAN Growth Fund. MAAKL Syariah Index Fund provides investor with relatively low risk as compared to other funds by 3.74. This also indicates that Conventional is outperformed the Islamic unit trust funds.
Coefficient of Variance
Coefficient of Variation measures relative variability indicates by risk per unit return. In the world of investing, the word coefficient of variation will trigger the investors on the volatility of the risk which can help investor to forecast how much to expect from the investment they have made. If the ratio is low ratio meaning that the better the risk-return trade off. In the case of both Conventional and Islamic unit trust funds, AIIMAN Growth Fund has the highest risk-return trade off followed by Prusmall-cap Fund. In conclusion, AIIMAN Growth Fund is more risky than any other unit trust fund. This is because 1 unit returns of AIIMAN Growth Fund is 93.8 unit of risk compared to RHB Mudharabah Fund which 1 unit of return of RHB Mudharabah Fund is -11.6 unit of risk. The lowest rank from both funds was RHB income fund and RHB Mudharabah Fund which shows negative values.
Beta (Systematic Risk)
Beta shows the systematic risk in the unit trust funds such as inflation risk. Low beta will show that these funds relatively low sensitivity to the market. Overall funds for both Conventional and Islamic unit trust funds have lower beta compared to the market beta. The beta ranges from 1.000 to 0.050 for the Conventional unit trust. Meanwhile, for the Islamic unit trust is from 1.000 to 0.1900. All Funds has positive values and it indicates that the fund relatively more sensitivity compared to other funds performances.
Performance Measurement
Proceedings International Conference of Technology Management, Business and Entrepreneurship 2012 (ICTMBE2012), Renaissance Hotel, Melaka, Malaysia 18-19 Dec 2012
651
[image:9.595.88.559.214.322.2]Jensen’s Index. The evaluation performance of Conventional and Islamic unit trust funds is measured by portfolio performance measurement consists of Sharpe, Treynor, and Jensen method. The result obtained from the estimating equation (5), (6) and (7).
Table 3: Conventional unit trust fund performance measured by Sharpe’s, Treynor’s, and Jensen index.
CONVENTIONAL Sharpe's Sharpe's Treynor's Treynor's Jensen's Jensen's
UNIT TRUST FUNDS Index Rank Index Rank Index Rank
RHB Capital -0.2711 1 -5.0658 2 -1.7176 4
MAAKL Value Fund -0.5190 4 -6.1053 3 -0.8588 3
PRU Small-cap fund -0.4405 2 -8.0345 4 -0.6554 2
KLCI -0.4934 3 -2.2600 1
Select Income Fund -1.8794 5 -53.0000 5 -0.1130 1
Based on the risk adjusted performance measured for Conventional unit trust funds, the ranking for Sharpe Index show the highest return was RHB Capital by -0.2711.
For Treynor Index, all funds are underperformed the KLCI. The other result indicates the lowest ranking for the Treynor’s Index is Select Income Fund by -53.
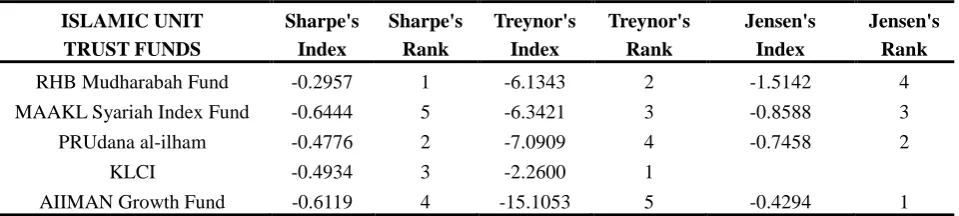
As seen in Table 4, the result for Islamic unit trust funds shows that the overall performance indicates all funds are underperforming the market index using Treynor’s method. The lowest ranking for the Treynor’s Index is AIIMAN Growth Fund by -15.1053 and the lowest ranking for the Sharpe Index is MAAKL Syariah Index Fund by -0.6444. All the funds are underperformed the KLCI except fund of RHB Mudharabah Fund and PRUdana al-ilham.
Table 4: Islamic unit trust fund performance measured by Sharpe’s, Treynor’s, and Jensen index.
ISLAMIC UNIT Sharpe's Sharpe's Treynor's Treynor's Jensen's Jensen's
TRUST FUNDS Index Rank Index Rank Index Rank
RHB Mudharabah Fund -0.2957 1 -6.1343 2 -1.5142 4
MAAKL Syariah Index Fund -0.6444 5 -6.3421 3 -0.8588 3
PRUdana al-ilham -0.4776 2 -7.0909 4 -0.7458 2
KLCI -0.4934 3 -2.2600 1
AIIMAN Growth Fund -0.6119 4 -15.1053 5 -0.4294 1
[image:9.595.74.554.542.650.2]Proceedings International Conference of Technology Management, Business and Entrepreneurship 2012 (ICTMBE2012), Renaissance Hotel, Melaka, Malaysia 18-19 Dec 2012
652
Overall performance for Jensen Index for both unit trust funds indicates all funds have negative value. The negative value for alpha (α) shows the less ability of the fund managers to manage the unit trust funds. As a result, the fund is having a negative return and it is sign a bad decision making for the investors to achieve their profit.
Test of Relationships
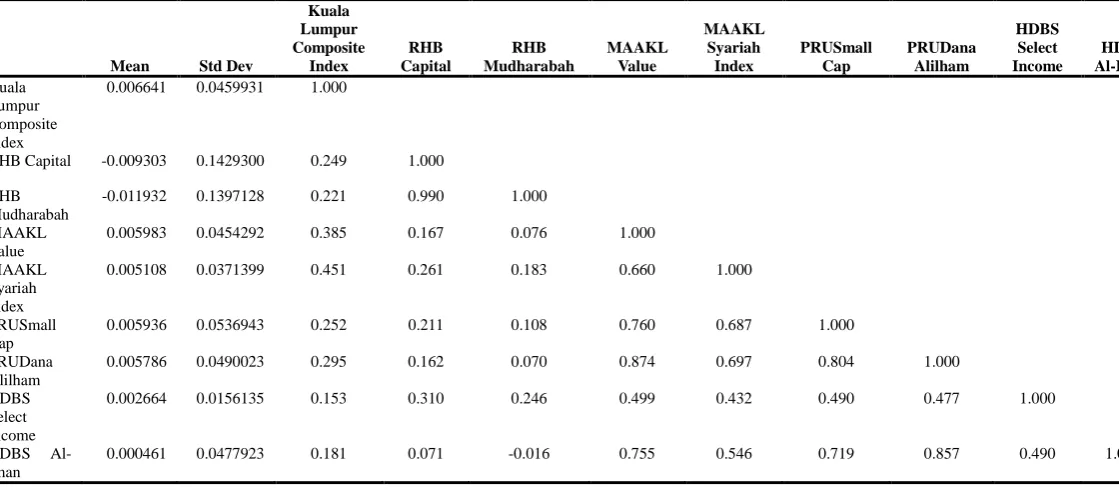
Correlation Analysis
[image:10.595.13.573.504.749.2]Referring to Table 5, it shows that there are significant and positive relationships exist between returns for conventional and Islamic unit trust funds with the market return. These correlations indicate that conventional as well as Islamic unit trust funds and KLCI show significant relationship in multiple regressions analysis. Although the result shows a positive correlation but it is a weak correlation which means a small change in market return will not affect the unit trust funds returns. The result can be seen as follows:-
Table 5: Correlation Analysis for KLCI and Unit Trust Funds
Mean Std Dev
Kuala Lumpur Composite Index RHB Capital RHB Mudharabah MAAKL Value MAAKL Syariah Index PRUSmall Cap PRUDana Alilham HDBS Select Income HDBS Al-Iman Kuala Lumpur Composite Index
0.006641 0.0459931 1.000
RHB Capital -0.009303 0.1429300 0.249 1.000 RHB
Mudharabah
-0.011932 0.1397128 0.221 0.990 1.000 MAAKL
Value
0.005983 0.0454292 0.385 0.167 0.076 1.000 MAAKL
Syariah Index
0.005108 0.0371399 0.451 0.261 0.183 0.660 1.000
PRUSmall Cap
0.005936 0.0536943 0.252 0.211 0.108 0.760 0.687 1.000 PRUDana
Alilham
0.005786 0.0490023 0.295 0.162 0.070 0.874 0.697 0.804 1.000
HDBS Select Income
0.002664 0.0156135 0.153 0.310 0.246 0.499 0.432 0.490 0.477 1.000
HDBS Al-Iman
Proceedings International Conference of Technology Management, Business and Entrepreneurship 2012 (ICTMBE2012), Renaissance Hotel, Melaka, Malaysia 18-19 Dec 2012
653
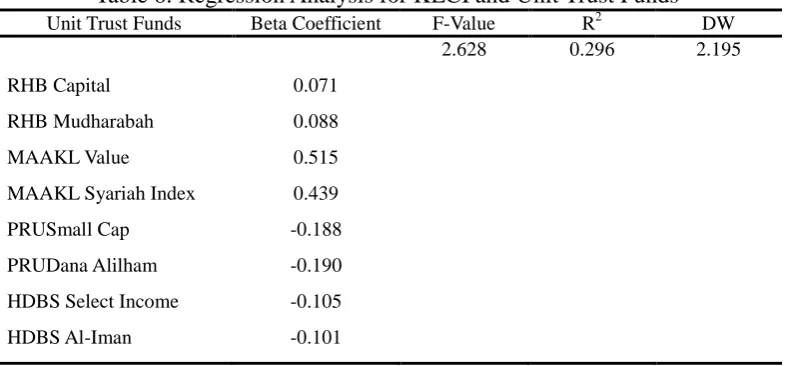
Multiple Regression Analysis
[image:11.595.118.512.209.392.2]Table 6 shows the result for regression analysis for unit trust funds and KLCI. The result explained how the market return influenced the unit trust funds return.
Table 6: Regression Analysis for KLCI and Unit Trust Funds
Unit Trust Funds Beta Coefficient F-Value R2 DW
2.628 0.296 2.195
RHB Capital 0.071
RHB Mudharabah 0.088
MAAKL Value 0.515
MAAKL Syariah Index 0.439
PRUSmall Cap -0.188
PRUDana Alilham -0.190
HDBS Select Income -0.105
HDBS Al-Iman -0.101
The relationship between market return and conventional as well as Islamic unit trust returns were based on the results in Table 6. The result shows that R-square is 0.296, meaning that 29.6 percent of the variance in KLCI can be explained by the variations in the conventional and Islamic unit trust returns. The F-value used to check how well the model fits the data used in this study. The significant value of F-statistics meaning that KLCI is giving an impact to at least one of the unit trust funds returns.
Based on the result in Table 6, it shows that the market return only give an impact to MAAKL Value and MAAKL Syariah Index funds. This can be seen as their beta coefficient shows figure of 0.515 and 0.439 respectively which are significant at 5 percent level.
Conclusion
MAAKL Value fund and MAAKL Syariah Index funds were found to achieve same level average return with Kuala Lumpur Composite Index and this finding consistent with (Annuar, Shamsher and Ngu 1997) who also found that unit trusts produce lower returns than the market portfolio. The same findings were from (Fikriah et. al. 2007) conclude that both conventional and Islamic unit trust slightly underperformed the KLCI.
The result for performance measurement for both Conventional and Islamic unit trust funds using Sharpe and Treynor index had shown negative result which indicates many funds have beaten by the market index (KLCI). The result for Jensen Index indicates all funds have negative value and indicate less ability of the fund managers to manage the unit trust funds.
Proceedings International Conference of Technology Management, Business and Entrepreneurship 2012 (ICTMBE2012), Renaissance Hotel, Melaka, Malaysia 18-19 Dec 2012
654
Islamic unit trust funds is the best fund to invest. From the calculation done, by ranking the conventional as well as Islamic fund, it reveals that, at the point of this study been done, conventional fund still outperformed the Islamic fund. Both funds are statistically significant towards the KLCI. Though the Islamic funds are underperformed but the room for improvement is there and sooner or later the growth will be seen. Moreover, revealing the specific volatility patterns in returns might also benefits investors in risk management and portfolio optimization.
References
Abdullah, F., S. Mohamed and T. Hassan, (2002) “A Comparative Performance of Malaysian Islamic and Conventional Mutual Funds”, Pertanika, 8(2), 30-49.
Annuar M. N., Shamsher M. and Ngu, M.H (1997), “Selectivity and Timing: Evidence from the Performance of Malaysian Unit Trusts”, Pertanika 5(1), 45-57.
Bailey and Lim (1992). “Costly information, diversification and international mutual fund Performance”, Pacific-Basin Finance Journal; 11(4), 463-482.
Chen, C.R., Cheng F.L., Rahman, S. and Chan, A. (1992), ‘‘A cross sectional analysis of mutual fund’s market timing and security selection skill’’, Journal of Business Finance and Accounting, Vol. 19, pp. 659-74.
Choong, D., 2001,”Investor’s Guide to Malaysian Unit Trust Industry”, SAGE Information Services.
Fama, E.F., 1972, “Components of Investment Performance”, Journal Of Finance, vol. 27, pp. 551-567.
Fikriyah et. Al. (2000), “Investigation of performance of Malaysian Islamic unit trust funds: Comparison with conventional unit trust funds”, Journal of Managerial Finance, 3 (2), 142 – 153
Friend, I., F.E. Brown, E.S. Herman and D. Vickers, “A Study of Mutual Funds”, U.S. Government Printing Office, 1962: Washington, D.C.
Jensen, M.C., “The Performance of Mutual Funds in the Period 1945-1964”, Journal of Finance 23, 1968, pp. 389-416.
Kon, S.J. (1983), ‘‘The market timing performance of mutual fund managers’’, Journal of Business, Vol. 56, pp. 321-47.
Kon, S.J. and Jen, F.C. (1979), ‘‘The investment performance of mutual funds: an empirical investigation of timing, selectivity and market efficiency’’, Journal of Business, Vol. 63, pp. 261-78.
Proceedings International Conference of Technology Management, Business and Entrepreneurship 2012 (ICTMBE2012), Renaissance Hotel, Melaka, Malaysia 18-19 Dec 2012
655
Capital Market Review, 5 (2), 27-44
McDonald, John G. 1974, “Objectives and Performance of Mutual Funds 1960-1969” Journal of Financial and Quantitative Analysis,vol.9,no.3,pp. 311-333.
Shamsher, M., Annuar, M.N. and Taufiq, H. (2000), ‘‘Investment in unit trusts: performance of active and passive funds’’, Proceedings of FEP Seminar 2000: Issues in Accounting and Finance 2, Universiti Putra Malaysia Press, Serdang, pp. 129-41.
Shamsher, M. and Annuar, M.N. (1995), ‘‘The performance of unit trusts in Malaysia: some evidence’’, Capital Markets Review, Vol. 3 No. 2.
Sharpe, W.F., 1966, “Mutual Fund Performance”, Journal of Business, vol. 39, no. 2,pp.119-138
Treynor, J.L., (1965), How to Rate Management of Investment Funds, Harvard Review, 43(1), 63-75