http://dx.doi.org/10.4236/ajac.2014.514106
How to cite this paper: Abdelkader, S.B., Yahia, F.B.H. and Khattech, I. (2014) Preparation, Characterization and Statistical
Preparation, Characterization and Statistical
Studies of the Physicochemical Results of
Series of “B” Carbonated Calcium
Hydroxyapatites Containing Mg
2+
and
2
3
CO
−
S. Ben Abdelkader, F. Bel Hadj Yahia, I. Khattech
Applied Thermodynamics Laboratory, Chemistry Department, Faculty of Sciences, Tunis, Tunisia Email: [email protected]
Received 21 August 2014; revised 6 October 2014; accepted 21 October 2014
Copyright © 2014 by authors and Scientific Research Publishing Inc.
This work is licensed under the Creative Commons Attribution International License (CC BY).
http://creativecommons.org/licenses/by/4.0/
Abstract
In this study, series of hydroxyapatites containing Mg2+ and 2 3
CO − are prepared by the precipita-tion method with independently varying concentraprecipita-tions of 2
3
CO − and Mg2+. All the compounds are characterized by infrared spectra (IR); powder X-ray diffraction (PXRD) and elemental analy-sis. The physical analysis results show that the prepared compounds are pure B-type carbonate apatite. The presence of Mg2+ and 2
3
CO − in the apatite cause the following effects on its physical properties: a decrease in a-dimension but no changes in c-dimension and a decrease in crystallin-ity as shown in XDR patterns and IR spectra. The results of the chemical analysis allow us to pre-dict the predominant substitution mechanisms for the 2
3
CO − and the Mg2+ incorporations in the calcium hydroxyapatites and to calculate their relative contributions x, y and z.
2 3 Ca 2
4 3
Ca ++2PO− ↔V +2CO − (II); 2 Ca⋅ 2++ ⋅2 OH− ↔Mg2++ ⋅2 VOH 2. (IV); PO34 CO23 OH
− ↔ −+ −
(V). Statistical studies of the results “multiple linear regression, analysis of variance (ANOVA) and t-test of the regression coefficients” allow us to determine and to test the mathematical model proposed. Finally, the present study makes it possible to write the general formula for these com-pounds.
Keywords
1. Introduction
A number of studies have reported that the incorporation of magnesium in hydroxyapatites Ca10(PO4)6(OH)2 is
limited [1]-[3]. Previously, it has been shown that the magnesium can disturb the crystallization of apatites when its concentration in the solution is sufficient to be a major competitor for calcium [4]. But when the molar ratio of Mg/Ca is higher than 0.1, another phase is observed, the whitlockite [3] [5]-[7]. The co-substitution of a second ionic species like the carbonate ion can increase the insertion of magnesium in the lattice and prevent the decomposition while stabilizing the structure [8] [9].
On the other hand, it is now well established that the biological minerals are best described as carbonated apa-tites rather than as a hydroxyapatite [2] [10]-[12]. The carbonate presents at 3% - 6% in biological apaapa-tites, mostly substitutes for the phosphate ion in the crystal structure and has a significant influence on the incorpora-tion of other foreign ions into the apatite lattice. Magnesium is one of the most abundant trace ions present in the biological hard tissues and in dental enamel, its content approximately being 0.1% - 0.4%. In dentin, the magne-sium content is up to 1.1%, while in bone, it is found at 0.6% [13]-[15]. Thusly, Magnemagne-sium has been the subject of many studies. To understand the role of magnesium on biological apatites, the works using synthetic carbo-nated apatites are very helpful.
Previous studies suggest that the magnesium is incorporated into or onto the carbonated apatites during their formation [16]-[24]. Some of these works demonstrate the role of the carbonate concentration, the pH of prepa-ration, and the magnesium content incorporated into the apatites at similar quantities to those found in biological apatites [16] [17] [23]. Other works report the effect of the magnesium on the parameters of the lattice of apa-tites prepared by precipitation or high-temperature synthesis [4] [25]. Legeros et al. [22] noted an increase in the dissolution rates, of carbonate-containing apatites when the magnesium was incorporated. Some studies have investigated the phase’s composition after heat-treatment of the magnesium/carbonate co-substituted in the hy-droxyapatite [16] [23] [24].
Despite numerous investigations, the mechanism(s) by which the carbonate and the magnesium are incorpo-rated in the apatite lattice are not yet known. Indications are found in the literature about the mechanisms by
which 2
3
CO− and alkalimetal M+ are incorporated in the apatite lattice [26]-[28]. In these works, De Maeyer and Verbeeck suggest that six fundamental substitution mechanisms can contribute theoretically for these subs-titutions .
2 3 Ca 2 OH
4 3
Ca ++PO−+OH− ↔V +CO−+V (I)
2 3 Ca 2
4 3
Ca ++2PO− ↔V +2CO − (II)
2 3 2
4 3
Ca ++PO− ↔M++CO − (III)
2 OH
Ca ++OH− ↔M++V (IV)
3 2
4 3
PO− ↔CO−+OH− (V)
2 OH
3
2OH− ↔CO−+V (VI)
where VX stands for a vacancy in the X-sublattice. The contributions of each of these mechanisms should be es-timated on the basis of a thorough physicochemical studies of the samples.
The present study tries to find the mechanism(s) which contribute to the incorporation of magnesium and carbonate in the apatites lattice. For this purpose, series of “B” carbonated calcium hydroxyapatites containing magnesium are prepared by the precipitation method. In the first series, the concentration of the 2
3
CO − solution is Cc = 0.00 M while the Mg
2+
concentration CMg is 0.00, 1.7, 6.8 and 13.6 mM. For the second, the same
pro-cedure is remade with Cc = 0.025 M in the hydrolysis solution and for the third, Cc is equal to 0.05 M. The
chemical and physical characteristics of the samples prepared are determined and an attempt is made to deduce the fundamental substitution mechanisms which determine their stoichiometry. Finally, statistical studies of the experiment results allow us to find the relationship between the different variables and to verifythe proposed mechanisms by which 2
3
2. Methods and Materials
2.1. Preparation of “B” Type Carbonated Hydroxyapatites Containing Magnesium
The method of preparation used in this work is inspired from the method used in reference [23] but it is slightly modified. The apaties are prepared by dropping 200 mL of a phosphate solution (NH4)2HPO4 (0.18 M) into 200
mL of a calcium solution Ca(NO3)·4H2O (0.44 M) under reflux at 87˚C. To the calcium solution is added 20 mL
of a magnesium solution Mg(NO3)2·6H2O containing different concentrations: CMg (0.00; 1.7; 6.8 and 13.6) mM.
The same procedure is remade by adding to the phosphate solution 5 mL of a carbonate solution NH4HCO3 (1
M). A third set of preparations is performed by adding 10 mL from the above carbonate solution. The pH is maintained at 9.0 during the precipitation by adding an ammonia concentrated solution (28% weight). The pre-cipitation is carried out over 3 h. Then, the system is refluxed for an additional duration of 2 h. The samples are filtered, thoroughly washed with hot distilled water and dried overnight at 120˚C.
2.2. Physical Analysis
The powdered samples are identified by X-ray diffraction and by infra red spectroscopy. Infrared spectra of the samples dispersed in KBr tablets are recorded using a Shimadzu Fourier transform infrared spectrophotometer in the range of 4000 - 400 cm−1. Then, the samples are analyzed by X-ray diffraction (XRD) using a Philips dif-fractometer using Cu Kα radiation. The samples are scanned in the 2θ range of 20˚ - 60˚. The “a and c” parame-ters of the lattice of the hexagonal unit cell are calculated using “wincell” refinement program.
2.3. Chemical Analysis
The samples are analyzed for Ca, PO4, CO3 and Mg. The calcium content of the precipitates is determined by a
complexometric titration with the ethylenediaminetetraacetic acid [29], the magnesium by atomic absorption, the carbonate content is determined by coulometrically method and the phosphorus content by spectrophotome-trie of the phosphomolybdate complex [30].
3. Results
3.1. Results of Physical Analysis
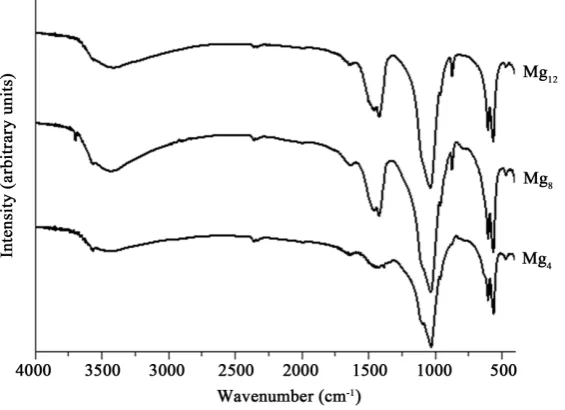
The IR Spectra of some representative samples (Mg4, Mg8 and Mg12) are shown in Figure 1. The spectra contain
the characteristic bands of the phosphate group 3 4
[image:3.595.159.442.498.703.2]PO− in the ranges 960 - 1100 and 570 - 610 cm−1. Two broad bands, around 1635 cm−1 and 3400 cm−1, confirm that the samples contain a significant amount of water. On the
spectra of the samples (Mg8 and Mg12) are displayed typical absorption bands of CO23
− at ~873 and ~1420
cm−1 and between 1450 and 1500 cm−1, characterizing the vibration of the 2 3
CO − on 3 4
PO− lattice sites (B-
type 2
3
CO −) [31]. From Figure 1, we can clearly see that the intensity of these absorptions increases with the increase of the carbonate content. On the other hand, the IR spectra of the compounds (Mg4, Mg8 and Mg12)
show that the magnesium incorporated in the apatites causes the loss of resolution of the 3 4
PO − absorptions bands suggesting a decrease in the crystallinity [31].
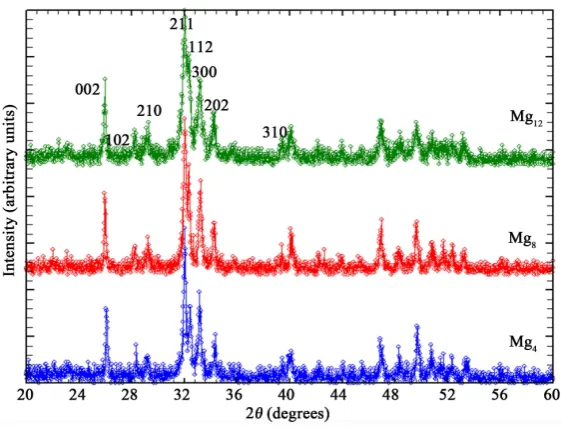
The X-ray diffraction patterns of some representative samples are shown in Figure 2. The X-ray diffraction powder patterns of the compounds show only one crystal phase. The peaks are sharp, well resolved and charac-teristic of the hexagonal apatite phase. No extraneous peaks attributable to other phases than apatite could be found in the diffractograms. The increase of the level of 2
3
CO − substitution produces a loss of the resolution of the 112 peak and a decrease in the intensity of the 300, 202 and 002 peaks.
The Table 1 contains the values of the lattice parameters “a” and “c” obtained for the different compounds. From this table,we can see that simultaneous incorporation of two elements “CO3 and Mg” results in an
de-crease of the “a” parameter. This contraction is attributed to the simultaneous effects of the 2 3
[image:4.595.158.439.273.487.2]CO − and Mg2+ substitutions [2].
Figure 2.X-ray diffraction patterns of some representative samples.
Table 1. “a” and “c” Lattice parameters of “B” CO3Mg-Haps.
Samples CC/M CMg/mM a/Å c/Å c/a
Mg1 0.000 00.0 9.439 ± 0.004 6.911 ± 0.004 0.732
Mg2 0.000 01.7 9.428 ± 0.004 6.901 ± 0.003 0.732
Mg3 0.000 06.8 9.412 ± 0.006 6.869 ± 0.004 0.730
Mg4 0.000 13.6 9.409 ± 0.007 6.862 ± 0.005 0.729
Mg5 0.025 00.0 9.410 ± 0.005 6.910 ± 0.005 0.735
Mg6 0.025 01.7 9.412 ± 0.008 6.911 ± 0.005 0.734
Mg7 0.025 06.8 9.386 ± 0.008 6.889 ± 0.005 0.734
Mg8 0.025 13.6 9.375 ± 0.006 6.896 ± 0.004 0.735
Mg9 0.050 00.0 9.369 ± 0.007 6.895 ± 0.004 0.736
Mg10 0.050 01.7 9.360 ± 0.010 6.899 ± 0.007 0.737
Mg11 0.050 06.8 9.343 ± 0.014 6.879 ± 0.010 0.736
[image:4.595.88.540.525.721.2]3.2. Chemical Results
The results of the chemical analysis of the samples in Weight % are summarized inTable 2. This table also gives the hydroxide content of the samples calculated on the basis of the electroneutrality condition and the total mass balance ∑ % obtained from the equation:
4
PO P 3
% %Ca %P M M %CO %Mg %OH
∑ = + ⋅ + + + (1)
With MXthe atomic or ionic mass of X. ∑ % value is lower than 100% indicating that the samples of the
present study still contain some water after drying at 120˚C.
The results of the chemical and physical analysis (Table 2) allow us to calculate the number of each ion X per unit cell, nx according to the following equation:
(
3)
X
X P 3 CO
%X 6
n
M %P M %CO M
=
+ (2)
[image:5.595.89.540.312.499.2]The results of these calculations are summarized in Table 3. The errors in Table 4 are estimated by the means of error propagation theory.
Table 2.Chemical Composition (weight percent) and Total Mass Balance ∑ % of the hydroxyapatites obtained by
precipita-tion in soluprecipita-tions containing Cc (M) CO3 and CMg (mM) Mg.
Sample CC/M CMg/mM % Ca % P % CO3 % Mg % OH− ∑ %
Mg1 0.000 00.0 36.97 16.83 0.99 0.01 3.19 92.73
Mg2 0.000 01.7 37.09 16.83 1.58 0.22 3.25 93.71
Mg3 0.000 06.8 34.75 16.83 0.00 0.82 2.99 90.13
Mg4 0.000 13.6 34.35 17.22 0.00 1.50 2.96 91.58
Mg5 0.025 00.0 37.32 15.84 4.45 0.01 3.15 93.47
Mg6 0.025 01.7 36.73 15.94 4.16 0.21 2.93 92.87
Mg7 0.025 06.8 36.73 16.33 4.65 0.84 2.89 95.15
Mg8 0.025 13.6 35.14 16.23 5.34 1.55 2.31 94.07
Mg9 0.050 00.0 37.91 14.85 8.22 0.01 3.15 94.80
Mg10 0.050 01.7 37.62 14.25 8.78 0.21 3.85 94.13
Mg11 0.050 06.8 35.74 14.75 8.71 0.80 2.29 92.74
Mg12 0.050 13.6 35.64 15.34 9.11 1.52 2.02 95.30
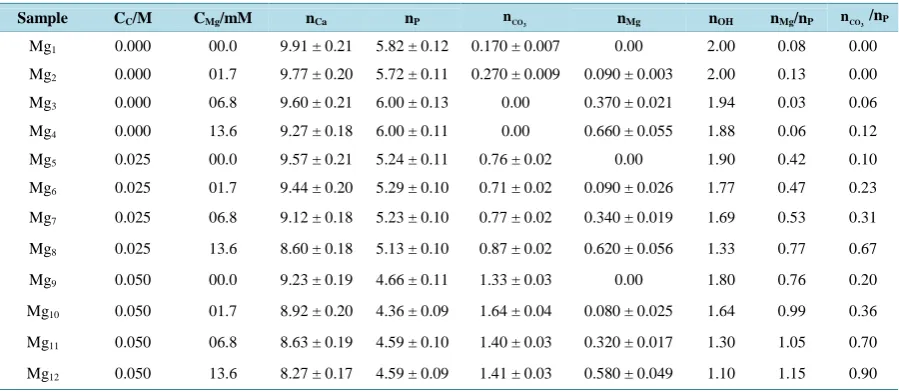
Table 3. Unit cell compositions of NaCO3 Aaps calculated on the basis of the chemical composition and using Equation (2).
Sample CC/M CMg/mM nCa nP nCO3 nMg nOH nMg/nP nCO3/nP
Mg1 0.000 00.0 9.91 ± 0.21 5.82 ± 0.12 0.170 ± 0.007 0.00 2.00 0.08 0.00
Mg2 0.000 01.7 9.77 ± 0.20 5.72 ± 0.11 0.270 ± 0.009 0.090 ± 0.003 2.00 0.13 0.00
Mg3 0.000 06.8 9.60 ± 0.21 6.00 ± 0.13 0.00 0.370 ± 0.021 1.94 0.03 0.06
Mg4 0.000 13.6 9.27 ± 0.18 6.00 ± 0.11 0.00 0.660 ± 0.055 1.88 0.06 0.12
Mg5 0.025 00.0 9.57 ± 0.21 5.24 ± 0.11 0.76 ± 0.02 0.00 1.90 0.42 0.10
Mg6 0.025 01.7 9.44 ± 0.20 5.29 ± 0.10 0.71 ± 0.02 0.090 ± 0.026 1.77 0.47 0.23
Mg7 0.025 06.8 9.12 ± 0.18 5.23 ± 0.10 0.77 ± 0.02 0.340 ± 0.019 1.69 0.53 0.31
Mg8 0.025 13.6 8.60 ± 0.18 5.13 ± 0.10 0.87 ± 0.02 0.620 ± 0.056 1.33 0.77 0.67
Mg9 0.050 00.0 9.23 ± 0.19 4.66 ± 0.11 1.33 ± 0.03 0.00 1.80 0.76 0.20
Mg10 0.050 01.7 8.92 ± 0.20 4.36 ± 0.09 1.64 ± 0.04 0.080 ± 0.025 1.64 0.99 0.36
Mg11 0.050 06.8 8.63 ± 0.19 4.59 ± 0.10 1.40 ± 0.03 0.320 ± 0.017 1.30 1.05 0.70
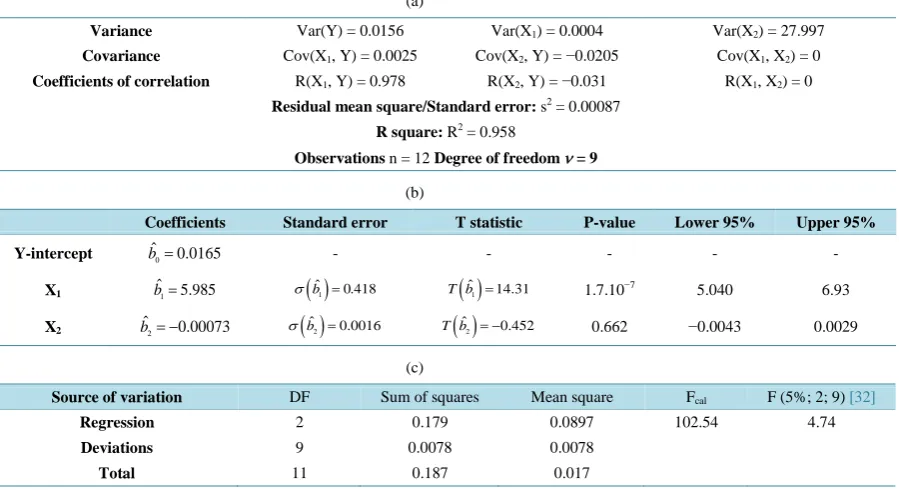
[image:5.595.89.539.525.721.2]Table 4. Multiple linear regression analysis of Yi = nCO3/nP the molar ratio (Table 3) as a function of the concentration of
carbonate Cc/M and magnesium CMg/mM in the solution. (a) Regression statistic; (b) Coefficients; (c) Analysis of variance.
(a)
Variance Var(Y) = 0.0156 Var(X1) = 0.0004 Var(X2) = 27.997
Covariance Cov(X1, Y) = 0.0025 Cov(X2, Y) = −0.0205 Cov(X1, X2) = 0
Coefficients of correlation R(X1, Y) = 0.978 R(X2, Y) = −0.031 R(X1, X2) = 0
Residual mean square/Standard error: s2 = 0.00087
R square: R2 = 0.958
Observations n = 12 Degree of freedom ν = 9
(b)
Coefficients Standard error T statistic P-value Lower 95% Upper 95%
Y-intercept bˆ0=0.0165 - - - - -
X1 bˆ1=5.985 σ
( )
bˆ1 =0.418 T b( )
ˆ1 =14.31 1.7.10−7 5.040 6.93
X2 bˆ2= −0.00073
( )
2ˆ 0.0016
b
σ =
( )
2ˆ 0.452
T b = − 0.662 −0.0043 0.0029
(c)
Source of variation DF Sum of squares Mean square Fcal F (5%; 2; 9) [32]
Regression 2 0.179 0.0897 102.54 4.74
Deviations 9 0.0078 0.0078
Total 11 0.187 0.017
4. Statistical Analysis of the Physicochemical Results
4.1. Influence of the Experimental Conditions on the Composition
of the Synthetic Apatites
To know the influence of the experimental conditions on the incorporation of 2 3
CO − and Mg2+ in the lattice of these synthetic apatites, we graph Yi = nCO3/nP and nMg/nP the molar ratios contents of the samples against Xi the concentration of 2
3
CO − Cc or the concentration of Mg2+ CMg in the solution, Figure 3and Figure 4.
From the Figure 3(a) and Figure 4(a), it is seen that 3 CO
n /nP the molar ratio increases with the increase of
the concentration of 2 3
CO − in the solution (Cc/M). Contrariwise, it varies slightly with the concentration of the
Mg2+ ions in the solution and vice versa for nMg/nP (Figure 3(b)and Figure 4(b)).
To estimate the simultaneous influence of the experimental conditions on 3 CO
n /nP and nMg/nP the molar ratios,
we construct a mathematical model of Yi = nCO3/nP or nMg/nP on two variables X1,i = Cc and X2,i = CMg. The mathematical model is described by the equation:
0 1 1,i 2 2,i
Yi=b +bX +bX +e (3) The method of least squares (O.L.S.) allows us to establish the predicted equation
i ˆ0 ˆ1 1,i ˆ2 2,i ˆ
Y =b +b X +b X (4) that is most suitable to the data. On the other hand, this method allows us to calculate the estimated standard er-rors of the coefficients σ
( )
bˆ1 andσ( )
bˆ2 , the individual confidence interval at 95% level, R2the standardized statistic and to test the null hypothesis H0: bj = 0 and its significances level. The analysis of the variance for thelinear regression or the F test allows us to ensure that at least one of the X-variables contributes to the regression. The theoretical basis of these calculations is given in references [32]-[34]. The calculations are summarized in Table 4and Table 5.
4.2. Influence of the Incorporation of
2 3CO −
and Mg
2+on the Variation of Ca
2+and OH
−the Molar Ions Contents of the Synthetic Apatites
In attempts to disentangle and to measure the effects of the insertion of 2 3
[image:7.595.126.473.83.229.2]
(a) (b)
Figure 3.(a)
3
CO
n /nP molar ratio of the solid versus CMg/mM for the samples prepared at different Cc/M; (b) nMg/nP
molar ratio of the solid versus CMg/mM for the samples prepared at different Cc/M.
[image:7.595.129.470.271.412.2]
(a) (b)
Figure 4.(a)
3
CO
n /nP molar ratio versus Cc/M for the samples prepared at different CMg/mM; (b) nMg/nP molar ratio
versus Cc/M for the samples prepared at different CMg/mM.
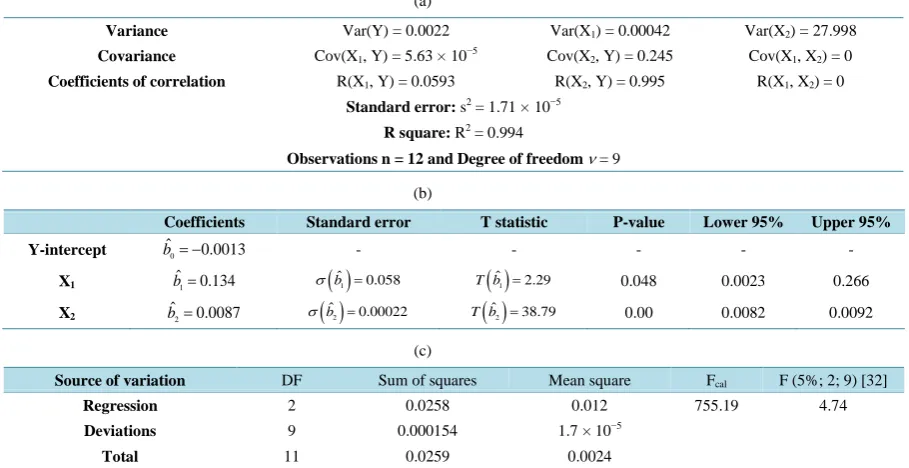
Table 5.Multiple linear regression analysis of Yi = nMg/nP molar ratio (Table 3) as a function of the concentration of
carbo-nate Cc/M and magnesium CMg/mM in the solution. (a) Regression statistic; (b) Coefficients; (c) Analysis of variance.
(a)
Variance Var(Y) = 0.0022 Var(X1) = 0.00042 Var(X2) = 27.998
Covariance Cov(X1, Y) = 5.63 × 10⁻⁵ Cov(X2, Y) = 0.245 Cov(X1, X2) = 0
Coefficients of correlation R(X1, Y) = 0.0593 R(X2, Y) = 0.995 R(X1, X2) = 0
Standard error: s2 = 1.71 × 10⁻⁵
R square: R2 = 0.994
Observations n = 12 and Degree of freedom ν = 9
(b)
Coefficients Standard error T statistic P-value Lower 95% Upper 95%
Y-intercept bˆ0= −0.0013 - - - - -
X1 bˆ1=0.134 σ
( )
bˆ1 =0.058 T b( )
ˆ1 =2.29 0.048 0.0023 0.266X2 bˆ2=0.0087 σ
( )
bˆ2 =0.00022 T b( )
ˆ2 =38.79 0.00 0.0082 0.0092(c)
Source of variation DF Sum of squares Mean square Fcal F (5%; 2; 9) [32]
Regression 2 0.0258 0.012 755.19 4.74
Deviations 9 0.000154 1.7 × 10⁻⁵
[image:7.595.86.541.484.718.2]tent of Ca2+ of the solid, we use the multiple linear regression on two X-variables where, X1 = nCO23
− and X 2 =
[image:8.595.88.542.180.431.2]nMg2+ and Y is the estimate molar content of Ca2+ or OH− (data Table 3). The results of these calculations are given in Table 6 and Table 7.
Table 6.Multiple linear regression analysis of the estimated Yi = nCa2+ on X1,i = nMg 2+
, X2,i =
2 3
nCO− calcium, carbonate and magnesium respectively molar contents of the solid “B” Mg-CO3 Haps. (a) Regression statistic; (c) Coefficients; (c)
Analysis of variance.
(a)
Variance Var(Y) = 0.235 Var(X1) = 0.059 Var(X2) = 0.307
Covariance Cov(X1, Y) = −0.071 Cov(X2, Y) = −0.194 Cov(X1, X2) = −0.013
Coefficients of correlation R(X1, Y) = −0.607 R(X2, Y) = −0.722 R(X1, X2) = −0.101
Residual mean square/Standard error: s2 = 0.0033
R square: R2 = 0.989
Observations n = 12 and Degree of freedom ν = 9
(b)
Coefficients Standard error T statistic P-value Lower 95% Upper 95%
Y-intercept bˆ0=10.09 - - - - -
X1 bˆ1= −1.373 σ
( )
bˆ1 =0.068 T b( )
ˆ1 = −20.17 1.10−8 −1.527 −1.219 X2 bˆ2= −0.693 σ( )
bˆ2 =0.030 T b( )
ˆ2 = −23.25 0.00 −0.760 −0.625(c)
Source of variation DF Sum of squares Mean square Fcal Ftab (5%; 2; 9) [32]
Regression 2 2.79 1.397 428.12 4.74
Deviations 9 0.029 0.0033
Total 11 2.823 0.257
Table 7.Multiple linear regression analysis of the estimated Yi = OH− on X1, i = nMg2+ and X2,i =
2 3
nCO− the molar con-tents of the solid “B” Mg-CO3 Haps. (a) Regression statistic; (b) Coefficients; (c) Analysis of variance.
(a)
Variance Var(Y) = 0.082 Var(X1) = 0.059 Var(X2) = 0.307
Covariance Cov(X1, Y) = −0.038 Cov(X2, Y) = −0.111 Cov(X1, X2) = −0.013
Coefficients of correlation R(X1, Y) = −0.551 R(X2, Y) = −0.697 R(X1, X2) = −0.101
Residual mean square/Standard error: s2 = 0.0137
R square: R2 = 0.875
Observations n = 12 and Degree of freedom ν = 9
(b)
Coefficients Standard error T statistic P-value Lower 95% Upper 95%
Y-intercept bˆ0=2.19 - - - - -
X1 bˆ1= −0.740 σ
( )
bˆ1 =0.139 T b( )
ˆ1 = −5.32 0.00048 −1.054 −0.426 X2 bˆ2= −0.393 σ( )
bˆ2 =0.061 T b( )
ˆ2 = −6.45 0.00012 −0.531 −0.255(c)
Source of variation DF Sum of squares Mean square Fcal F (5%; 2; 9) [32]
Regression 2 0.862 0.431 31.61 4.74
Deviations 9 0.123 0.0136
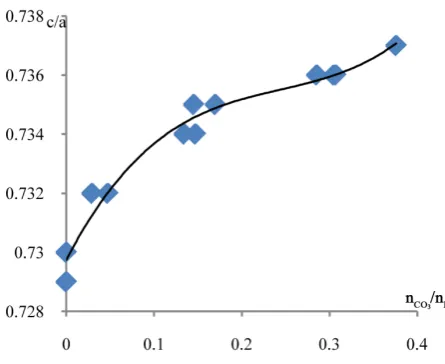
[image:8.595.84.542.467.719.2]4.3. The Determination of the Relationship between Y = c/a Crystallographic
Parameters Ratio and
3
CO
n
/
n
pthe Molar Ratio
To estimate the influence of the incorporation of carbonate on the lattice parameters “a” and “c” in presence of magnesium, we plot c/acrystallographic parameters ratio (Table 1) as a function of molar ratio
3 CO
n /nP (Table
3) for 0 ≤ nMg≤ 17.4 mM (Figure 5).
Given that the shape of the curve obtained inFigure 5 is a polynomial, we construct a multiple linear regres-sion on Yi = c/a as a function of three X-variables where, X1 = nCO3/nP, X2 = (nCO3/nP)
2
and X3 = (nCO3/nP) 3
(data Table 2) and Y is the estimate ratio of the hexagonal lattice dimensions (data Table 1). The mathematical model equation is
0 1 1 2 2 3 3
Y=b +b X +b X +b X + ε (5) Least square [33] allows calculating the regression and correlation coefficients regression of the predicted equation
0 1 1 2 2 3 3
ˆ ˆ ˆ ˆ
ˆ
Y=b +b X +b X +b X (6) These estimated rgression coefficients b , b , b and bˆ0 ˆ1 ˆ2 ˆ3 are calculated from the values of correlation coeffici- ents, variance and covariance according to the method of Scherrer [33].This method allows us to test the utility of the model or the F-test according to:
(
)
(
)
2
2
n m 1 R
F
m 1 R
− − ⋅ =
⋅ − (7)
where n is sample size, m is number of parameters and (n − m − 1) is degree of freedom.
On the other hand, this method allows us to calculate the standard errors of the coefficients b , b , b and bˆ0 ˆ1 ˆ2 ˆ3
and to conduct t-tests on the b’s (to discover which variable(s) is related to estimate Yˆ ) and to calculate the individual confidence interval at 95% level. The results of these calculations are given inTable 8.
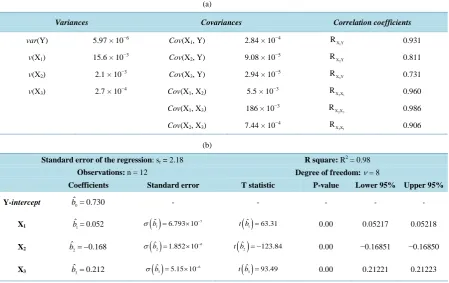
[image:9.595.90.540.440.723.2]The analysis of variance (ANOVA) shows that F-test = 2018.9 is higher than criterion F(5%; 3; 8) = 4.07.
Table 8.Multiplelinear regression analysis of Yi= c/a ratio of the lattice parameters of Mg-CO3 HAps (Table 1) on: X1i =
3
CO
n /nP, X2i = (nCO3/nP)
2
, X3i = (nCO3/nP)
3
the molar ratio Table 3. (a) Statistic regression; (b) Coefficients.
(a)
Variances Covariances Correlation coefficients
var(Y) 5.97 × 10⁻⁶ Cov(X1, Y) 2.84 × 10⁻⁴ RX Y1 0.931
v(X1) 15.6 × 10⁻³ Cov(X2, Y) 9.08 × 10⁻⁵ RX Y2 0.811
v(X2) 2.1 × 10⁻³ Cov(X3, Y) 2.94 × 10⁻⁵ RX Y3 0.731
v(X3) 2.7 × 10⁻⁴ Cov(X1, X2) 5.5 × 10−3 RX X21 0.960
Cov(X1, X3) 186 × 10−3 RX X23 0.986
Cov(X2, X3) 7.44 × 10−4 RX X31 0.906
(b)
Standard error of the regression: sr = 2.18 R square: R2 =0.98
Observations: n = 12 Degree of freedom:ν = 8
Coefficients Standard error T statistic P-value Lower 95% Upper 95%
Y-intercept bˆ0=0.730 - - - - -
X1 bˆ1=0.052
( )
7 1
ˆ 6.793 10
b
σ = × −
( )
1
ˆ 63.31
t b = 0.00 0.05217 0.05218
X2 bˆ2= −0.168
( )
6 2
ˆ 1.852 10
b
σ = × −
( )
2
ˆ 123.84
t b = − 0.00 −0.16851 −0.16850
X3 bˆ3=0.212
( )
6 3
ˆ 5.15 10
b
σ = × −
( )
3
ˆ 93.49
Figure 5. c/a parameters ratio as a function of
3
CO n /nP the
molar ratio for the apatites prepared at different values of CMg.
5. Determination of the General Formula of the Unit Cell
of the Synthetic “B” CO
3Mg-HAps
The relative composition (Table 3) and the results of the physical analysis demonstrate that the samples are pure “B” type carbonated apatites containing Mg2+ ions. Thus, mechanisms I, II, III and V could be account in the incorporation of 2
3
CO − on 3 4
PO− and Mg2+ ions are incorporated in the apatite lattice according to mechan-isms III and/ or IV.
Moreover, the study carried out previously (paragraph 4.1) show that the 2 3
CO − ions are incorporated in the apatite lattice independently of the concentration of Mg2+ ions solution. This result confirms that mechanism IV
does and mechanism III does not contribute to the incorporation of Mg2+ in the apatites.
Many works [27] [28] have demonstrated that mechanism I and/or II are the main mechanisms for the incor-poration of CO3. Otherwise, according the reference [27], the contribution of mechanism I seems to be hardly
influenced by the alkali metal which is not our case. Therefore, we consider that mechanism II contribute to the insertion of CO3 ions in the lattice of the solid.
Table 7 show that the variation of nOH− depends on the increase of 2
3
CO − and Mg2+. So, it may be said in the present study, that the mechanism V could account.
Then the fundamental substitution mechanisms for the incorporation of 2 3
CO − and Mg2+ in the HAp lattice are:
2 3 Ca 2
4 3
Ca ++2PO−↔V +2CO− (II)
2 2 OH
2Ca ++2OH− ↔Mg++2V 2.(IV)
3 2
4 3
PO− ↔CO −+OH− (V) where VOH stands for a vacancy in the OH− sub lattice. If x, y and z are the contributions of mechanisms II, 2.IV and V respectively, thus,
2
nCa + =10− − ⋅x 2 y (8) 3
4
nPO−= − ⋅ −6 2 x z (9) 2
nMg + =y (10) 2
3
nCO− = ⋅ +2 x z (11) and nOH− = − ⋅ +2 2 y z (12) and the generic formula has the following expression:
(10 x 2 y) y
(
4)
(6 2x z)(
3)
(2x z)( )
(2 2y z)The values of x, y and z the contribution of mechanisms II, 2.IV and V respectively are calculated from the data (Table 3) and the following equations. Then statistical studies are conducted to verify the accuracy of the proposed formula. The results of these calculations are summarized inTables 9-11.
Table 9.Thevalues of x, y and z the contributions of the mechanisms II, 2.IV and V respectively calculated from Equations (10)-(14).
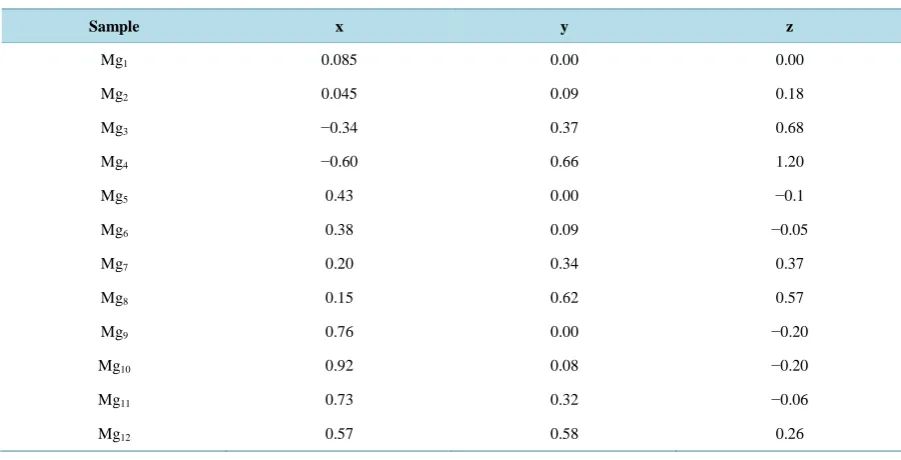
Sample x y z
Mg1 0.085 0.00 0.00
Mg2 0.045 0.09 0.18
Mg3 −0.34 0.37 0.68
Mg4 −0.60 0.66 1.20
Mg5 0.43 0.00 −0.1
Mg6 0.38 0.09 −0.05
Mg7 0.20 0.34 0.37
Mg8 0.15 0.62 0.57
Mg9 0.76 0.00 −0.20
Mg10 0.92 0.08 −0.20
Mg11 0.73 0.32 −0.06
Mg12 0.57 0.58 0.26
Table 10.Multiple linear regression analysis of the estimated Yi = nCa2+ the molar content of the solid “B” Mg-CO3 HAps
(Table 3) on X1,i = x- and X2,i = y the contribution of mechanisms II and 2.IV (Table 9). (a) Regression statistic; (b)
Coeffi-cients; (c) Analysis of variance.
(a)
Variance Var(Y) = 0.235 Var(X1) = 0.187 Var(X2) =0.059
Covariance Cov(X1, Y) = −0.093 Cov(X2, Y) = −0.071 Cov(X1, X2) = −0.046
Coefficients of correlation R(X1, Y) = −0.443 R(X2, Y) = −0.607 R(X1, X2) = −0.443
Residual mean square/Standard error: s2 = 1.88 × 10⁻⁵
R square: R2 = 0.999
Observations n = 12 and Degree of freedom ν = 9
(b)
Coefficients Standard error T statistic P-value Lower 95% Upper 95%
Y-intercept bˆ0=9.99 - - - - -
X1 1
ˆ 0.995
b = −
( )
1ˆ 0.0032
b
σ =
( )
1ˆ 308.16
T b = − 0.00 −1.002 −0.987
X2 bˆ2= −1.999 σ
( )
bˆ2 =0.0057 T b( )
ˆ2 = −347.79 0.00 −2.012 −1.986(c)
Source of variation DF Sum of squares Mean square Fcal F (5%; 2; 9) [32]
Regression 2 2.862 1.412 74148.88 4.74
Deviations 9 0.00017 1.904 × 10⁻⁵
[image:11.595.73.541.432.721.2]Table 11.Multiple linear regression analysis of the estimated Yi = nOH− the molar content of the solid “B” Mg-CO3 HAps
(Table 3) on X1,i = z and X2,i = z the contribution of mechanisms II and V (Table 9). (a) Regression statistic; (b) Coefficients; (c)
Analysis of variance.
(a)
Variance Var(Y) = 0.082 Var(X1) = 0.164 Var(X2) = 0.059
Covariance Cov(X1, Y) = 0.0055 Cov(X2, Y) = −0.038 Cov(X1, X2) = 0.079
Coefficients of correlation R(X1, Y) = −0.443 R(X2, Y) = −0.607 R(X1, X2) = −0.443
Residual mean square/Standard error: s2 = 2.74 × 10⁻³²
R square: R2 = 1.00
Observations n = 12 and Degree of freedom ν = 9
(b)
Coefficients Standard error T statistic P-value Lower 95% Upper 95%
Y-intercept bˆ0=2.00 - - - - -
X1 1
ˆ 1.00
b=
( )
161
ˆ 1.997 10
b
σ = × −
( )
151
ˆ 5.00 10
T b = × + 0.00 1 1
X2 bˆ2= −2.00
( )
16 2
ˆ 3.338 10
b
σ = × −
( )
152
ˆ 5.99 10
T b = − × + 0.00 −2 −2
(c)
Source of variation DF Sum of squares Mean square Fcal
Regression 2 2.862 1.412 74148.88
Deviations 9 0.00017 1.904 × 10⁻⁵
Total 11 2.823 0.2567
6. Discussion
From Table 1,, we can see that simultaneous incorporation of two elements “CO3 and Mg” results in an
de-crease of the “a” parameter. This contraction is attributed to the simultaneous effects of the 2 3
CO − and Mg2+ substitutions [4].
In Table 2 andTable 3, it is seen that the concentration of the 2 3
CO − ions in the solution Cc does not affect
the quantities of Mg2+ ions inserted in the solid. Because, regardless of the concentration of the 2 3
CO − ions in the solution Cc, the Mg2+ ions contents of the samples increase proportionally with the increase of the
concentra-tion of Mg2+ ions in solution CMg. This result is in agreement with reference [4]. For the same concentration of
Mg2+ions in the solution CMg, the variation of PO34
− and 2 3
CO − contents of the solid do not seem to be corre-lated with the concentration of the Mg2+ ions in the solution, while the Ca2+content depends on the concentra-tions of 2
3
CO − Cc and Mg2+ CMg in the solution.
Figure 3 and Figure 4, show that nCO3/nP the molar ratio increases with the increasing of the concentration
of 2
3
CO− in solution (Cc/M). Contrariwise, it varies slightly with the concentration of Mg2+ ions in solution and
vice versa for nMg/nP. The statistical treatment of the experimental data Table 4 and Table 5 allows us to es-tablish the estimated equations between these variables at 95% levels
(
)
3 c
nCO nP=0.0165+ 5.986±0.945 ⋅C M (13)
and nMg nP= −0.0013+
(
0.135±0.132)
⋅Cc M+(
0.0087±0.0005)
⋅CMg mM (14)Equations (9) and (10) show that the concentration of the 2 3
CO − ions in the hydrolysis solution Cc affects the
quantities of 2 3
CO − and Mg2+ ions incorporated in the solid, but the concentration of Mg2+ ions in solution CMg
does not affects the quantities of 2 3
To know the relationship between the variation of Ca2+ and OH− with the increasing of 2 3
CO − and Mg2+ content in the solid, statistical studies are conducted. The results of multiple linear regression Table 6 and Table 7show that the estimated equations on these variables are represented at 95% level by:
(
)
2(
)
23
2
Mg CO
nCa + =10.09− 1.373 0.153 n± ⋅ + − 0.698 0.067 n± ⋅ − (15)
(
)
2(
)
23
Mg CO
nOH−=2.19− 0.740 0.313 n± + − 0.393 0.138 n± ⋅ − (16)
From the intercepts of the following equations it can seen that, within experimental error, a carbonate and magnesium-free apatite (nCO3 = 0, nMg = 0) contains 10 Ca2+ and 2 OH− ions per unit cell Equations (11) and
(12). These results are in agreement with those in literature [24]-[26] [34] [35].
As shown in Figure 5, there is a correlation of the unit cell parameters of the apatites with their chemical compositions. Indeed, the changes in the unit cell parameter “a” of the compounds are attributed to the additive effects of the substitution in the lattice of either carbonate and magnesium [2] [34] [35]. The solid line of best fit for these series of compounds in Figure 5 extrapolates to a ratio c/a very close to that in hydroxyapatite. This result is similary to these obtained previously [34] [35]. The application of multiple linear regression to Yi = c/a
on
(
)
3 3
2
1,i CO P 2,i CO P
X =n n , X = n n and X3,i =
(
nCO3 nP)
3 allows us to establish the predicted equation at95% level:
(
)
(
)
(
)
(
)
(
)
2
6 6
i CO3 P CO3 P
3 5
CO3 P
Y c a 0.73 0.052 1.56 10 n n 0.168 4.26 10 n n 0.212 1.18 10 n n
− −
−
= = + ± × ⋅ + ± × ⋅
+ ± × ⋅ (17)
To verify the general formula proposed, We apply the multiple linear regression to Yi = nCa2+ on X1i = x and
X2i = y (the contributions of the mechanisms II and IV). Similar treatment is realized for Yi = nOH− on X1i = z
and X2i = y (the contributions of the mechanisms V and IV) Table 10 and Table 11. The results of these
calcu-lations show that the predicted equations at 95% level are:
(
)
(
)
2
nCa + =9.99− 0.995±0.007 x− 1.999±0.013 ⋅y (18)
(
16) (
16)
nOH−=2.00+ 1.00±4.52 10× − ⋅ −z 2.00±7.54 10× − ⋅y (19)
7. Conclusion
The theoretical calculations of the present study indicate unambiguously that the mechanisms II, III and V con-tribute to the incorporation of Mg and Ca in the lattice of apatite. This corroborates in more definite way our as-sumptions obtained from the experimental data and allows us to propose for these compounds the general for-mula:
(10 x 2 y) y
(
4)
(6 2x z)(
3)
(2x z)( )
(2 2 y z) 2Ca − − ⋅ Mg PO − − CO + OH − + ⋅nH O.
References
[1] Kreidler, E.R. and Hummel, F.A. (1970) The Crystal Chemistry of Apatite: Structure: Fields of Fluor- and Chlorapatite.
American Mineralogist, 55, 170.
[2] Legeros, R.Z. (1984) Tooth Enamel IV. In: Fearnhead, R.W. and Sugas, S., Eds., Elsevier, Amsterdam, 32-36.
[3] Ben Abdelkader, S., Khattech, I., Rey, C. and Jemal, M. (2001) Synthése, Caractérisation et Thermochimie d’Apatites Calco-Magnésiennes Hydroxylées et Fluorées. Thermochimica Acta, 376, 25-36.
http://dx.doi.org/10.1016/S0040-6031(01)00565-2
[4] Terpstra, R.A. and Driessens, F.C.M. (1986) Magnesium in Tooth Enamel and Synthetic Apatites. Calcified Tissue In-ternational, 39, 348-354. http://dx.doi.org/10.1007/BF02555203
[5] Hayek, E. and Newsely, H. (1958) Über die Existenz von Tricalciumphosphat in wäBriger Lösung. Mn. Chem., 89, 88. [6] Rowles, S.L. (1968) Crystallographic Study of Biological Apatites. Bulletin de la Société Chimique de France, 1797. [7] Hamad, M. and Heughebaert, J.C. (1987) Study of Apatite and Whitlockite Formation at 100˚C in the System CaO-
[8] Vignoles, M., Bonel, G. and Young, R.A. (1987) Occurrence of Nitrogenous Species in Precipitated B-Type Carbo-nated Hydroxyapatites. Calcified Tissue International, 40, 64-70. http://dx.doi.org/10.1007/BF02555707
[9] Vignoles, M., Bonel, G., Holcomb, D.W. and Young, R.A. (1988) Influence of Preparation Conditions on the Compo-sition of Type B Carbonated Hydroxyapatite and on the Localization of the Carbonate Ions. Calcified Tissue Interna-tional, 43, 33.
[10] Young, R.A. and Spooner, S. (1969) Neutron Diffraction Studies of Human Tooth Enamel. Archives of Oral Biology,
15, 47-63. http://dx.doi.org/10.1016/0003-9969(70)90144-5
[11] Bigi, A., Foresti, E., Gregorini, R., Ripamonti, A., Roveri, N. and Shah, J.S. (1992)The Role of Magnesium on the Structure of Biological Apatites. Calcified Tissue International, 50, 439-444. http://dx.doi.org/10.1007/BF00296775
[12] Holden, J.L., Clement, J.G. and Phakey, P.P. (1995)Age and Temperature Related Changes to the Ultrastructure and Composition of Human Bone Mineral. Journal of Bone and Mineral Research, 10, 1400-1409.
http://dx.doi.org/10.1002/jbmr.5650100918
[13] Robinson, C., Weatherell, J.A. and Hallsworth, A.S. (1981)Distribution of Magnesium in Mature Human Enamel. Ca-ries Research, 15, 70-77. http://dx.doi.org/10.1159/000260502
[14] Steinfort, J., Driessens, F.C.M., Heijligers, H.J.M. and Bertseen, W. (1991)The Distribution of Magnesium in Devel-oping Rat Incisor Dentin. Journal of Dental Research, 70, 187-191. http://dx.doi.org/10.1177/00220345910700030601
[15] Tsuboi, S., Nakagi, H., Ishiguro, K., Kondo, K., Mukai, M., Robinson, C. and Weatherell, J.A. (1994) Magnesium Distribution in Human Bone. Calcified Tissue International, 54, 34-37. http://dx.doi.org/10.1007/BF00316287
[16] Bigi, A., Marchetti, F., Ripamonti, A., Roveri, N. and Foresti, E. (1981)Magnesium and Strontium Interaction with Carbonate-Containing Hydroxyapatite in Aqueous Medium. Journal of Inorganic Biochemistry, 15, 317-327.
http://dx.doi.org/10.1016/S0162-0134(00)80235-4
[17] Featherstone, J.D.B., Mayer, I., Driessens, F.C.M., Verbeeck, R.M.H. and Heijligers, H.J. (1983) Synthetic Apatites Containing Na, Mg, and CO3 and Their Comparison with Tooth Enamel Mineral. Calcified Tissue International, 35,
169-171. http://dx.doi.org/10.1007/BF02405026
[18] Apfelbaum, F., Mayer, I. and Featherstone, J.D.B. (1991)The Role of 2 4
HPO− and 2 3
CO− Ions in the Transformation of Synthetic Apatites to β-Ca3(PO4)2. Journal of Inorganic Biochemistry, 38, 1-8.
http://dx.doi.org/10.1016/0162-0134(90)85001-D
[19] Aoba, T., Moreno, E.C. and Shimoda, S. (1992) Competitive Adsorption of Magnesium and Calcium Ions onto Syn-thetic and Biological Apatites. Calcified Tissue International, 51, 143-150. http://dx.doi.org/10.1007/BF00298503
[20] Okazaki, M. and Legeros, R.Z. (1992) Crystallographic and Chemical Properties of Mg-Containing Apatites before and after Suspension in Solutions. Magnesium Research, 5, 103-108.
[21] Zhou, J.M., Zhang, X.D., Chen, J.Y., Zeng, S.X. and De Groot, K. (1993) High Temperature Characteristics of Syn-thetic Hydroxyapatite. Journal of Materials Science: Materials in Medicine, 4, 83-85.
http://dx.doi.org/10.1007/BF00122983
[22] Legeros, R.Z., Kijkowska, R., Bautista, C. and Legeros, J.P. (1995) Synergistic Effects of Magnesium and Carbonate on Properties of Biological and Synthetic Apatites. Connective Tissue Research, 333, 203.
[23] Mayer, I., Schlam, R. and Featherstone, J.D.B. (1997) Magnesium-Containing Carbonate Apatites. Journal of Inor-ganic Biochemistry, 66, 1-6. http://dx.doi.org/10.1016/S0162-0134(96)00145-6
[24] Gibson, I.R. and Bonfield, W. (2002) Preparation and Characterization of Magnesium/Carbonate Co-Substituted Hy-droxyapatites.Journal of Materials Science: Materials in Medicine, 13, 685-693.
http://dx.doi.org/10.1023/A:1015793927364
[25] Baravell, S.S., Bigi, A., Ripamonti, A., Roveri, N. and Foresti, E. (1984)Thermal Behavior of Bone and Synthetic Hy-droxyapatites Submitted to Magnesium Interaction in Aqueous Medium. Journal of Inorganic Biochemistry, 20, 1-12.
http://dx.doi.org/10.1016/0162-0134(84)80001-X
[26] De Maeyer, E.A.P. and Verbeeck, R.M.H. (1993)Possible Substitution Mechanisms for Sodium and Carbonate in Cal-ciumhydroxyapatite. Bulletin des Sociétés Chimiques Belges, 102, 601-609.
http://dx.doi.org/10.1002/bscb.19931020907
[27] De Maeyer, E.A.P., Verbeeck, R.M.H. and Pieters, I.Y. (1996)Influence of the Solution Composition on the Stoichi-ometry of Na+- and of K+-Containing Carbonated Apatites Obtained by the Hydrolysis of Monetite. Journal of Crystal Growth, 169, 539-547. http://dx.doi.org/10.1016/S0022-0248(96)00424-1
[28] De Maeyer, E.A.P., Verbeeck, R.M.H. and Pieters, I.Y. (1996)Effect of K+ on the Stoichiometry of Carbonated Hy-droxyapatite Obtained by the Hydrolysis of Monetite. Inorganic Chemistry, 35, 857-863.
http://dx.doi.org/10.1021/ic950916k
[30] Gee, A. and Deitz, V.R. (1953)Determination of Phosphate by Differential Spectrophotometry. Analytical Chemistry,
25, 1320-1324. http://dx.doi.org/10.1021/ac60081a006
[31] Legeros, R.Z. (1991) Calcium Phosphates in Oral Biology and Medicine. Monographs in Oral Science, 15, 89-95. [32] Snedecor, G.W. and Cochran, W.G. (1980) Statistical Methods. 7th Edition, The Iowa State University Press, Ames.
[33] Borcard, D. (2009) Regression Multiple. Université de Montréal, Montréal.
http://biol09.biol.umontreal.ca/BIO2042/Regr_mult.pdf
[34] Bel Hadj Yahia, F. and Jemal, M. (2010) Synthesis, Structural Analysis and Thermochemistry of B-Type Carbonate Apatites. Thermochimica Acta, 505, 22-32. http://dx.doi.org/10.1016/j.tca.2010.03.017