http://dx.doi.org/10.4236/me.2014.512103
How to cite this paper: Chen, Y.J. and Xiong, X.M. (2014) An Empirical Analysis for Over-Sophisticated Export and Regional Economic Growth. Modern Economy, 5, 1114-1119. http://dx.doi.org/10.4236/me.2014.512103
An Empirical Analysis for
Over-Sophisticated Export and
Regional Economic Growth
Yanjin Chen, Xiangmin Xiong
School of Economics, Beijing Wuzi University, Beijing, China Email: [email protected]
Received 17 September 2014; revised 26 October 2014; accepted 14 November 2014
Copyright © 2014 by authors and Scientific Research Publishing Inc.
This work is licensed under the Creative Commons Attribution International License (CC BY).
http://creativecommons.org/licenses/by/4.0/
Abstract
This paper investigates the hypothesis of export sophistication-led growth in the case of China. Using a panel data covering Chinese provinces and the period between 2003 and 2008, this paper examines whether regional exports with higher sophistication help to increase rates of regional growth. The empirical results reveal a positive relationship between export sophistication and growth in China. And the relationship is found to be driven by the export of coastal provinces.
Keywords
Export Sophistication, Over-Sophisticated Export, Regional Growth, Panel Data, China
1. Introduction
1115
The empirical results suggest that more sophisticated export induces rapid growth. But as pointed out by Shan and Sun [1], cross-country studies implicitly assume a common economic structure and similar production technologies across countries. Results indicated by significant coefficients may therefore be highly misleading. Therefore, different methods and data need to be used for more robust results. This paper enriches research in this line by examining the effect of productivity level reflected in regional export package on local economic growth in the case of China.
In this paper, the indicator PEXPY is defined to capture productivity level associated with a Chinese prov-ince’s export basket. With export values of 1245 products of 70 counties and 31 Chinese provinces 2002-2007, PEXPY is calculated. Analysis shows that most provinces do have an export basket that is more sophisticated than what would be normally expected for a province at its income level. Next, I test the hypothesis that higher export sophistication causes regional economic growth with panel data of 31 provinces 2002-2007. The empiri-cal results support promotion effect of higher export sophistication on economic growth. The hypothesis is also tested with sub-samples of inland and coastal provinces respectively. The effect of export sophistication to eco-nomic growth is only found in coastal provinces.
This paper is organized as follows. Section 2 describes the data and specification. The empirical results are discussed in Section 3. Section 4 concludes the paper.
2. Provincial Export Productivity Level
Indicator PEXPY
Hausmann and Rodrik construct an indicator EXPY that measures the productivity level associated with a coun-try’s export basket. Here I define indicator PEXPY for measuring a province’s export sophistication as
EXPYj PRODYi ij i
s
=
∑
⋅where PRODYi is a proxy for the benchmark level of productivity of each particular export commodityi. Us-ing it as weights I can measure the average export sophistication of province j. PRODYi is calculated accord-ing to Hausmann, Hwang and Rodrik [5].
PRODY ic
i c
c ic
c S
Y S =
∑ ∑
where Sic is the value-share of the commodity i in the country c’s overall export basket and Yc is the PPP adjusted GDP per capita expressed in 2000 constant terms for country c. It’s necessary to note that sij is the value-share of the commodity i in the Chinese province j’s overall export basket here. In doing so, EXPY could be used to measure product sophistication of any geographic scope’s export according to the definition of
j.
3. Data and Methodology
3.1. Methodology
For study of one country, more econometric studies use time-series data to investigate the causal relationship between exports and growth by means of Granger-type causality tests. A handful of scholars use panel data, such as An and Iyigun [7]. Although Granger tests are available in this study, panel data analysis provides more regional information. So following An and Iyigun [7], Our empirical estimates of the effect of the export sophis-tication on economic growth is obtained by estimating the following equation with panel data1:
, 0 , 1 , 1 , 1 , 1 PEXPY, 1
j t j t j t j t j t j t j jt
g =β +G − +I − +H − +EI − + − +α +u (1)
Here time dummy is controlled and fixed-effects model is adopted. The variables in Equation (1) are defined as follows: gj t, is the average growth rate of province j’s per-capita GDP; Gj t,−1 the province j’s per-capita income at the beginning of each period (in logs); Ij t,−1 the investment to GPP ratio; Hj t,−1 the percentage of “primary and secondary school complete” in the population aged 15 or above. EIj t,−1the export value to GPP
1An and Iyigun [7] is a cross-national study for export skill content on growth. Here we dropped regressors describing regional characteristic
1116
ratio. PEXPYj t,−1 in logs is a proxy for commodities sophistication of Chinese provinces’ export. Presently, index EXPY has been designed to measure average commodities sophistication/quality for a country’ export in study of previous studies [6] [8].
3.2. Data
The first dataset includes regional information on 31 provinces that constitute Mainland China. Original data is compiled from three series public publications of National Bureau of Statistics of China: China’s Statistical Yearbook, China Population Statistic Yearbook and China Industry Economy Statistical Yearbook. The infor-mation includes nominal per capita GPP 2002-2008 in RMB Yuan, provincial consumer price index (CPI), fixed asset investment 2003-2007, GPP in 100 million RMB Yuan, population aged 15 or above, population with pri-mary schooling and secondary schooling as highest education respectively, and export commercial value in 10 million RMB Yuan. The real per capita GDP growth rate from 2003 to 2008 is dependent variable. Prior to cal-culation for growth rate; the yearly levels have been adjusted to reflect 2000 constant prices using provincial CPI.
The second dataset includes the data of the United Nations Commodity Trade Statistics Database (COMTRADE) obtained through the WITS platform to construct proxy of PRODYi. Under the HS2002 classification there are 1245 products at the 4-digit level. For purposes of consistency the analysis is confined to countries that reported information for every year between 2002 and 2007 and for which data on GDP per capita were available from the World Development Indicators. This left us with 70 countries representing around 50 percent of total trade.
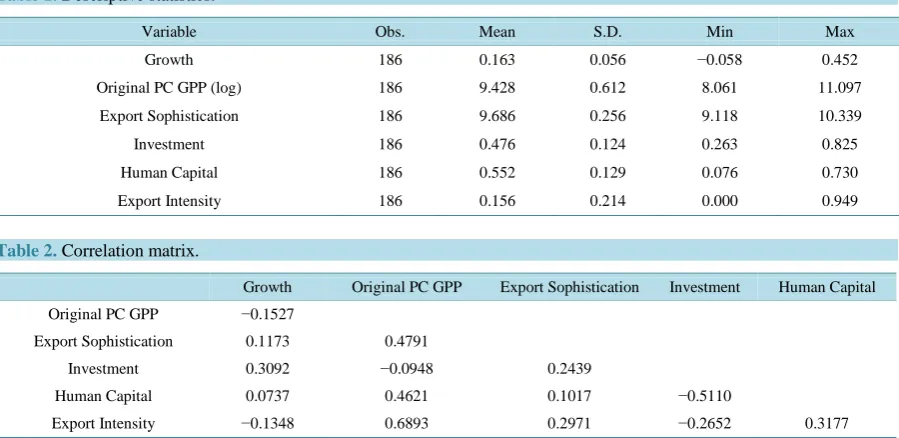
The third dataset of Chinese provincial export value 2002-2007 under the HS2002 classification at the 4-digit level is obtained from Customs of the People’s Republic of China to calculate index PEXPYj. Table 1 presents the summary statistics of our sample and Table 2reports the Correlation matrix.
4. Results
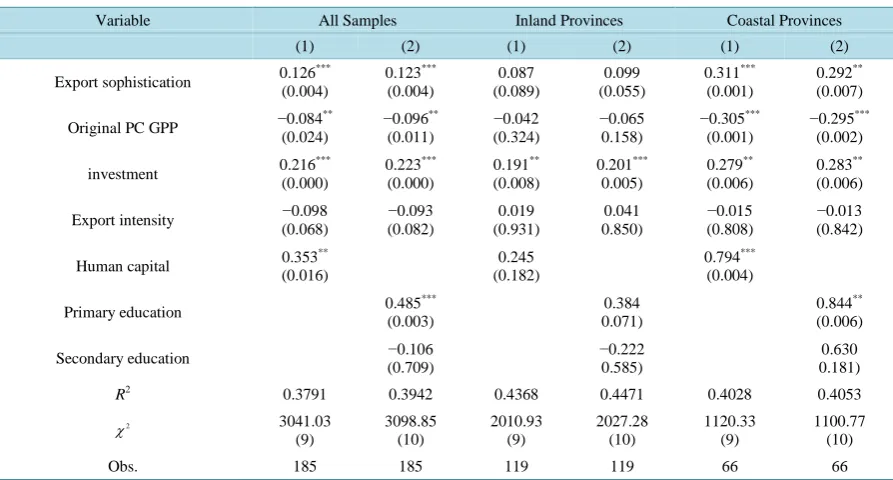
There are several potential econometric problems in this estimation need to be addressed. First, to alleviate mul-ticollinearity, I exclude the regressors that are highly correlated with the regressors in the model. As shown by Table 2, multicollinearity is no longer a concern with weakly correlated regressors. Second, the empirical anal-ysis is based on data for China’s 31 provinces and autonomous regions over the years 2003 to 2008. The small sample size necessarily calls for cautious analysis of the results. Therefore, I here use the robust variance esti-mator to improve the overall estimate’s small-sample properties. Third, it’s necessary to address the possible endogeneity of explanatory variables. And I use Fixed-Effects Anderson-Hsiao IV Regression for robust result.
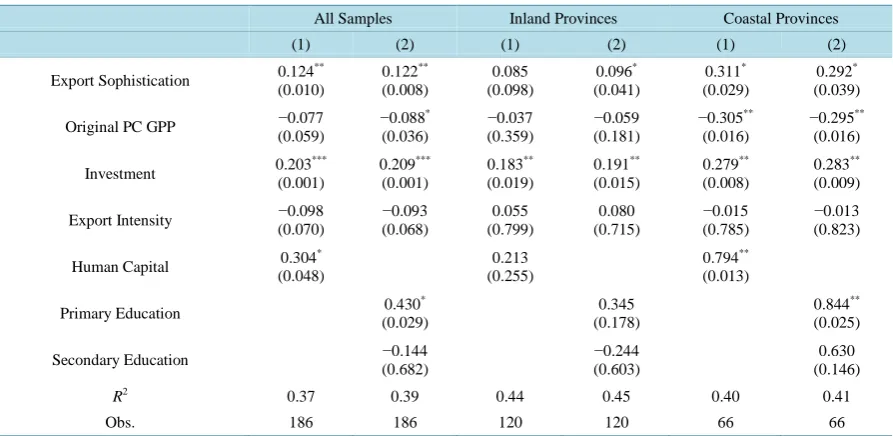
[image:3.595.89.539.501.720.2]The results are shown byTable 3. Fixed-effects analysis is used with the robust variance estimator adopted to
Table 1. Descriptive statistics.
Variable Obs. Mean S.D. Min Max Growth 186 0.163 0.056 −0.058 0.452 Original PC GPP (log) 186 9.428 0.612 8.061 11.097
Export Sophistication 186 9.686 0.256 9.118 10.339 Investment 186 0.476 0.124 0.263 0.825 Human Capital 186 0.552 0.129 0.076 0.730 Export Intensity 186 0.156 0.214 0.000 0.949
Table 2. Correlation matrix.
Growth Original PC GPP Export Sophistication Investment Human Capital Original PC GPP −0.1527
Export Sophistication 0.1173 0.4791
Investment 0.3092 −0.0948 0.2439
Human Capital 0.0737 0.4621 0.1017 −0.5110
Table 3. Fixed effects regression result.
All Samples Inland Provinces Coastal Provinces (1) (2) (1) (2) (1) (2)
Export Sophistication 0.124
** (0.010) 0.122** (0.008) 0.085 (0.098) 0.096* (0.041) 0.311* (0.029) 0.292* (0.039)
Original PC GPP −0.077 (0.059) −0.088* (0.036) −0.037 (0.359) −0.059 (0.181) −0.305** (0.016) −0.295** (0.016)
Investment 0.203
*** (0.001) 0.209*** (0.001) 0.183** (0.019) 0.191** (0.015) 0.279** (0.008) 0.283** (0.009)
Export Intensity −0.098 (0.070) −0.093 (0.068) 0.055 (0.799) 0.080 (0.715) −0.015 (0.785) −0.013 (0.823)
Human Capital 0.304
* (0.048) 0.213 (0.255) 0.794** (0.013)
Primary Education 0.430
* (0.029) 0.345 (0.178) 0.844** (0.025)
Secondary Education −0.144 (0.682)
−0.244 (0.603)
0.630 (0.146)
R2 0.37 0.39 0.44 0.45 0.40 0.41
Obs. 186 186 120 120 66 66 The Fixed-Effects analysis is reported with the robust variance estimator calculated. Province-specific and time-specific fixed effects estimate. P-Value in parentheses. The symbols *, **, and ***denote significance at the 10%, 5% and 1% levels, respectively. Province-specific and time-specific
fixed effects estimate.
improve the overall estimate’s small-sample properties. Column 1 of Table 3 reports the results of the fixed-ef- fects model using all samples. Column 2 and 3 report the results using the sample of inland provinces and coast al provinces respectively. Specification (1) is a parsimonious specification in which I include original per-capita GPP, investment ratio, export intensity and human capital as independent variables. Specification (2) uses pri-mary education and secondary education instead of aggregated human capital measure.
The coefficient of average export sophistication is 0.12 in specification (1), statistically significant in the four specifications using all samples, and 0.31 in specification using coastal provinces, also statistically significant in spite of the lowered significant level. However, it is insignificant in 3 specifications using inland samples. This result suggests that higher export sophistication is an important factor that explains the Chinese economic per-formance in recent years. The export sophistication-led growth hypothesis can be empirically supported with cross-provincial dataset of China. This result is consistent with Hausman, Huang and Rodrik [5] in spite of using different methodology and dataset. The basic economic theory underlying this is simple: exporter operates products with high productivity means more profit, which attracts more local entrants. Learning effect from im-itating or creation by entrants leads to the development of regional economy.
Besides, in China, the huge regional discrepancy still exists currently according to our results: 1% increase in export commodities’ sophistication will lead to 0.31% economic growth in coastal provinces. But such causal relationship is not found in inland provinces. Therefore, the export sophistication-led growth method exists only in the east developed regions. According to the study of Xu and Lu [9], level of export sophistication is posi-tively related to the share of wholly foreign owned enterprises from developed countries and the share of pro- cessing export of foreign-invested enterprises. Coastal provinces are typical habitat for foreign enterprises with high-tech and upgraded processing export which maybe the origin of regional economic growth. For this con-jecture further studies are needed for cautious conclusion.
1118
Table 4. Fixed-Effects Anderson–Hsiao IV Regression result.
Variable All Samples Inland Provinces Coastal Provinces (1) (2) (1) (2) (1) (2)
Export sophistication 0.126
*** (0.004) 0.123*** (0.004) 0.087 (0.089) 0.099 (0.055) 0.311*** (0.001) 0.292** (0.007)
Original PC GPP −0.084
** (0.024) −0.096** (0.011) −0.042 (0.324) −0.065 0.158) −0.305*** (0.001) −0.295*** (0.002)
investment 0.216
*** (0.000) 0.223*** (0.000) 0.191** (0.008) 0.201*** 0.005) 0.279** (0.006) 0.283** (0.006)
Export intensity −0.098 (0.068) −0.093 (0.082) 0.019 (0.931) 0.041 0.850) −0.015 (0.808) −0.013 (0.842)
Human capital 0.353
** (0.016) 0.245 (0.182) 0.794*** (0.004)
Primary education 0.485
*** (0.003) 0.384 0.071) 0.844** (0.006)
Secondary education −0.106 (0.709)
−0.222 0.585)
0.630 0.181)
R2 0.3791 0.3942 0.4368 0.4471 0.4028 0.4053
2 χ 3041.03 (9) 3098.85 (10) 2010.93 (9) 2027.28 (10) 1120.33 (9) 1100.77 (10) Obs. 185 185 119 119 66 66 The Fixed-Effects Anderson-Hsiao IV analysis is reported for robust validity. Province-specific and time-specific fixed effects estimate. P-Value in parentheses. The symbols *, **, and ***denote significance at the 10%, 5% and 1% levels, respectively.
growth. This result is consistent with Wang and Wei [10]. The coefficients of export intensity are statistically insignificant. This result suggests that export scale be not a significative drive for economic growth, when com-pared with export sophistication. Additionally, our results show that primary educated population prompts eco-nomic growth instead of the secondary educated. It is puzzled and needs to be further studied.
5. Conclusion
Using a panel dataset covering 31 Chinese regions and the period between 2003 and 2008, I examine whether exports with higher quality help to sustain higher rates of economic growth. After controlling for differences in the initial levels of per-capita income, investment level, human capital, as well as export intensity, I find that higher export sophistication induces economic growth of China. It is an important factor that explains the Chi-nese coastal provinces’ economic performance, but not for inland provinces. I think this result correctly reports the relationship between export sophistication and Chinese economic growth in recent years, and it further shows huge discrepancy between Chinese inland and coastal provinces.
References
[1] Shan, J. and Sun, F. (1998) On the Export-Led Growth Hypothesis: The Econometric Evidence from China. Applied
Economics, 30, 1055-1065.http://dx.doi.org/10.1080/000368498325228
[2] Mah, J.S. (2005) Export Expansion, Economic Growth and Causality in China. Applied Economics Letters, 12, 105- 107.http://dx.doi.org/10.1080/1350485042000314343
[3] Tang, T.C. (2006) New Evidence on Export Expansion, Economic Growth and Causality in China. Applied Economics
Letters, 13, 801-803.http://dx.doi.org/10.1080/13504850500425303
[4] Ljungwall, C. (2006) Export-Led Growth: Application to China’s Provinces, 1978-2001. Journal of Chinese Economic
and Business Studies, 4, 109-126.http://dx.doi.org/10.1080/14765280600736866
[5] Hausmann, R., Hwang, J. and Rodrik, D. (2007) What You Export Matters. Journal of Economic Growth, 12, 1-25. http://dx.doi.org/10.1007/s10887-006-9009-4
[6] Schott, P. K. (2008) The Relative Sophistication of Chinese Exports. Economic Policy, 23, 5-49.
[7] An, G. and Iyigun, M.F. (2004) The Export Skill Content, Learning by Exporting and Economic Growth. Economic
[8] Rodrik, D. (2006) What’s So Special about China’s Exports. China and World Economy, 14, 1-19. http://dx.doi.org/10.1111/j.1749-124X.2006.00038.x
[9] Xu, B. and Lu, J. (2009) Foreign Direct Investment, Processing Trade, and the Sophistication of China’s Exports.
China Economic Review, 20, 425-439.http://dx.doi.org/10.1016/j.chieco.2009.01.004