© 2016, IRJET | Impact Factor value: 4.45 | ISO 9001:2008 Certified Journal | Page 229
FAKE BIOMETRIC DETECTION USING NOVEL SOFTWARE FOR GOOD
SECURITY
K. Aparna Jyothi
1K.Venkatesulu
2V.Srinivas
31 PG Scholar, Swarnandhra institute of engineering & technology, narasapur, INDIA 2,3 Department of ECE, Swarnandhra institute of engineering & technology, narasapur, INDIA
[email protected] [email protected]
---***---Abstract - Biometrics-based authentication systems
offer obvious usability advantages over traditional password and token-based authentication schemes. However, biometrics raises several privacy concerns. A biometric is permanently associated with a user and cannot be changed. Hence, if a biometric identifier is compromised, it is lost forever and possibly for every application where the biometric is used. Moreover, if the same biometric is used in multiple application s, a user can potentially be tracked from one application to the next by cross-matching biometric databases. In this paper, we demonstrate several methods to generate multiple cancelable identifiers from fingerprint images to overcome these problems. Designing of a novel software-based fake detection method that can be used in multiple biometric systems to detect different types of fraudulent access attempts. We outlined several advances that originated both from the cryptographic and biometric community to address this problem. In particular, we outlined the advantages of cancelable biometrics over other approaches and presented a case study of different techniques.This project can be enhanced by reducing the image using DTCWT. This modification can decrease the image size and execution can be reduced by enhancing the image clarity. This enhancement can be shown using PSNR values.
The experimental results, obtained on publicly available data sets of fingerprint, iris, and 2D face, show that the proposed method is highly competitive compared with other state-of-the-art approaches and that the analysis of the general image quality of real biometric samples reveals highly valuable information that may be very efficiently used to discriminate them from fake traits.
Key Words: Image quality assessmet, biometrics, security,
attacks, countermeasures.
1.INTRODUCTION IN RECENT years, the
increasing interest in the evaluation of biometric systems security has led to the creation of numerous and very diverse initiatives focused on thismajor field of research
[1]: the publication of many research worksdisclosing and evaluating different biometric vulnerabilities
[2], the proposal of new protection methods the publication of several standards and the dedication of specific tracks, sessions, the acquisition of specific datasets, is the main interest.
All these initiatives clearly highlight the importance given by all parties involved in the development of biometrics (i.e., researchers, developers and industry) to the improvement of the systems security .
Among the different threats analyzed, the so called
direct or spoofing attacks have motivated the biometric
community
© 2016, IRJET | Impact Factor value: 4.45 | ISO 9001:2008 Certified Journal | Page 230 Besides other anti-spoofing approaches such as the
use of multibiometrics or challenge-response methods, special attention has been paid by researchers and industry to the liveness detection techniques, which use different physiolog-ical properties to distinguish between real and fake traits. Liveness assessment methods represent a challenging engineering problem as they have to satisfy certain demanding requirements [21]: (i ) non-invasive, the technique should in no case be harmful for the individual or require an excessive contact with the user; (i i) user friendly, people should not be reluctant to use it; (i i i)
fast, results have to be produced in a very reduced interval as the user cannot be asked to interact with the sensor for a long period of time; (iv) low cost, a wide use cannot be expected if the cost is excessively high; (v ) performance, having a good fake detection.
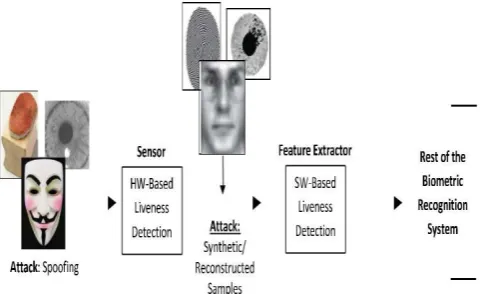
Liveness detection methods are usually classified into one of two groups (see Fig. 1): (i)Hardware-based
techniques, which add some specific device to the sensor in order to detect particular properties of a living trait (e.g., fingerprint sweat, blood pressure, or specific reflection properties of the eye); (i i )
Software-based techniques, in this case the fake trait isdetected
once the sample has been acquired with a standard sensor.
The two types of methods present certain advantages and drawbacks over the other and, in general, a combination of both would be the most desirable protection approach to
II. IMAGE QUALITY ASSESSMENT FOR
LIVENESS DETECTION
The use of image quality assessment for liveness detection is motivated by the assumption that: “It is
expected that a fake image captured in an attack
attempt will have different quality than a real sample acquired in the normal operation scenario for which the
sensor was designed.”
Expected quality differences between real and fake samples may include: degree of sharpness, color and luminance levels, local artifacts, iris images captured from a printed paper are more likely to be blurred or out of focus due to trembling; face images captured from a mobile device will probably be over- or under-exposed; and it is not rare that fingerprint images captured from a gummy finger present local acquisition artifacts such as spots and patches.
Following this “quality-difference” hypothesis, in the present research work we explore the potential of
general image quality assessment as a protection
method against different biometric attacks . This gives the proposed method a new multi-biometric dimension which is not found in previously described protection schemes.
Moreover, as will be explained in Section III, different quality measures present different sensitivity to image arti-facts and distortions. And the measures like the mean squared error respond more to additive noise, the spectral phase error are more sensitive to blur;the gradient-related features react to distortions concentrated around edges and textures. Therefore, using a wide range of IQMs exploiting complementary image quality properties, permit to detect the quality differences between real and fake samples in many attack attempts (i.e., providing with multi-attack protection capabilities).
All these observations lead us to believe that image quality measures have the potential to achieve success in biometric protection tasks.
III. THE SECURITY PROTECTION METHOD
The problem of fake biometric detection is whether an input biometric sample is real or fake, for that the process is to find a set of discriminant features which permits to build an appropriate classifier. In the present work we increase the security of biometric systems. As a coarse comparison, hardware-based schemes usually present a higher fake detection rate, while software-based techniques are in general less expensive (as no extra device is needed), and less intrusive,and they may be embedded in the feature extractor module which makes them capable of detecting other types of illegal break-in attempts not necessarily classified as spoofing attacks.
One of the usual shortcomings of most anti-spoofing meth-
od
s Is their lack of generality. It is not rare to find that
© 2016, IRJET | Impact Factor value: 4.45 | ISO 9001:2008 Certified Journal | Page 231 synthetic trait (i.e., gummy fingers made out of
gelatin).
In the present work we propose a novel software-based multi-biometric and multi-attack protection method which targets to overcome part of these limitations through the use of image quality assessment (IQA). It is not only capable of operating with a very good performance under different biometric systems (multi-biometric) and for diverse spoofing scenarios, but also provides a very good level of protection against certain non-spoofing attacks (multi-attack). Moreover, being software-based, it presents the usual advantages of this type of approaches: fast, as it only needs one image to detect whether it is real or fake; non-intrusive; user-friendly; cheap and easy to embed in already functional systems (as no new piece of hardware is required).
An added advantage of the proposed technique is its speed and very low complexity.This liveness detection method found in the state-of-the-art has been tested on publicly available attack databases of iris, fingerprint and 2D face, where, it has reached results fully comparable to those obtained on the same databases and following the same experimental protocols by more complex trait-specific top-ranked approaches.
Therefore, in all cases, results are reported in terms of: the False Genuine Rate (FGR), which accounts for the number of false samples that were classified as real; and the False Fake Rate (FFR), which gives the probability of an image coming from a genuine sample being considered as fake. The Half Total Error Rate (HTER) is computed as HTER = (FGR + FFR)/2.
The rest of the paper is structured as follows. Some key concepts about image quality assessment and its use for biometric protection is given in Section II. The proposed method is described in Section III. The results for iris, fingerprint and 2D face evaluation experiments appear in Sections IV-A, IV-B, and IV-C. Conclusions are finally drawn in Section V.propose a novel parameterization using 25 general image quality measures
A general diagram of the protection approach proposed in this work is shown in Fig. 2. In order to keep its generality and simplicity, the system needs only one input: the biometric sample to be classified as real or fake. Once the feature vector has been
generated the sample is classified as real (generated by a genuine trait) or fake (synthetically produced), using some simple classifiers. In particular, for our experiments we have considered standard implementations in Matlab of the Linear Discriminant Analysis (LDA) and Quadratic Discriminant Analysis (QDA) classifiers [44].
• The parameterization proposed in the present work comprises 25 image quality measures both reference and blind, has been carried out according to four general criteria, they are:
• Performance. Only widely used image quality
[image:3.595.308.551.338.485.2]approacheswhich have been consistently tested showing good per-formance for different applications have been considered.
Fig-1: Liveness detection techniques hardware &
software spoofing reconstructed synthetic samples
The final 25 selected image quality measures are summa-rized in Table I. Details about each of these 25 IQMs are given in Sections III-A and III-B. For clarity, in Fig. 3 we show a diagram with the general IQM classification followed in these sections. Acronyms of the different features are highlighted in bold in the text and in Fig. 3.
A. Full-Reference IQ Measures
Full-reference (FR) IQA methods rely on the availability of a clean undistorted reference image to estimate the quality of the test sample.
As shown in Fig. 2, the input grey-scale image I (of size
N × M) is filtered with a low-pass Gaussian kernel (σ
© 2016, IRJET | Impact Factor value: 4.45 | ISO 9001:2008 Certified Journal | Page 232 both images (I and I) is computed according to the
corresponding full-reference IQA metric.
This approach assumes that the loss of quality produced by Gaussian filtering differs between real and fake biometric samples.
1) FR-IQMs: Error Sensitivity Measures: Traditional
per-ceptual image quality assessment approaches are based on measuring the errors (i.e., signal differences) between the distorted and the reference images, they are easy to calculate and usually have very low computational complexity,for clarity, these features have been classified here into five different categories (see Fig. 3) according to the image property measured :
• Pixel Difference measures: These features
compute the distortion between two images on the basis of their pixelwise differences. Here we include: Mean Squared Error (MSE), Peak Signal to Noise Ratio (PSNR), Signal to Noise Ratio (SNR), Structural Content (SC), Maximum Difference (MD), Average Difference (AD), Normalized Absolute Error (NAE), R-Averaged Maximum Difference (RAMD) and Laplacian Mean Squared Error (LMSE).
• Correlation-based measures: The similarity
between two digital images can also be quantified in terms of the correlation function. A variant of correlation-based measures can be obtained by considering the statistics of the angles between the pixel vectors of the original and distorted images. These features include Normalized Cross-Correlation (NXC), Mean Angle Similarity (MAS) and Mean ngle-Magnitude imilarity (MAMS). As we are dealing with positive matrices I
and I, we are
constrained to the first quadrant of the Cartesian space so,maximum difference attained will be π/2, therefore the coefficient 2/π is included for normalization.
• Edge-based measures. Edges and other
two-dimensionalfeatures such as corners, are some of the most informative parts of an image.
Since the structural distortion of an image is tightly linked with its edge degradation, here we have considered two edge-related quality measures: Total Edge Difference (TED) and Total Corner Difference (TCD).
• Spectral distance measures.Hear the fourier
transform is applied to the image quality assessment [29]. In this work the IQ spectral-related features: the Spectral Magnitude Error (SME and the pectral h ase rror SPE).
• Gradient-based measures. Gradients convey importantvisual information which can be of great use for quality assessment. Many of the distortions that can affect an image are reflected by a change in its gradient. Therefore, using such information, structural and contrast changes can be effectively captured [49].
Two simple gradient-based features are included in the
biometric protection system proposed in the present article: Gradient Magnitude Error (GME) and radi ent Phase Error (GPE).
2) FR-IQMs: Structural Similarity Measures: quality
assessment based on structural similarity was proposed following the hypothesis that the human visual system is highly adapted for extracting structural information from the viewing field.
Among these recent objective perceptual measures, the Structural Similarity Index Measure (SSIM), has the simplest formulation and gained widespread popularity in a broad range of practical applications.
3) FR-IQMs: Information Theoretic Measures: The core
idea behind these approaches is that an image source communicates to a receiver through a channel that limits the amount of information that could flow through it, thereby introducing distortions. The goal is to relate the visual quality of the test image to the amount of
© 2016, IRJET | Impact Factor value: 4.45 | ISO 9001:2008 Certified Journal | Page 233
Fig-2: General diagram of the biometric protection
method based on Image Quality Assessment (IQA) proposed in the present work. IQM stands for Image Quality Measure, FR for Full-Reference, and NR for No-Reference. See Fig. 3 for a general classification of the 25 IQMs implemented. See Table I for the complete list and formal definitions of the 25 IQMs. See Section III for a more detailed description of each IQM.
Fig-3: Classification of the 25 image quality measures
implemented in the work acronyms(in bold) of the different measures are explained in in Table I and Section III.
signal has passed through another “distortion channel” before entering the HVS. The VIF measure is derived from the ratio of two mutual information quantities: the mutual information between the input and the output of the HVS channel when no distortion channel is present and the mutual information between the input of the distortion channel and the output of the HVS channel for the test image. On the other hand, the RRED metric approaches the problem of QA from the perspective of measuring the amount of local information difference between the reference image and the projection of the distorted image
the information theoretic perspective of IQA but each of them take either a global or a local approximation to the problem, onto the space of natural images, for a given subband of the wavelet domain. This way, contrary to the VIF feature, for the RRED it is not necessary to have access the entire reference image but only to a reduced part of its information (i.e., quality is computed locally).
B. No-Reference IQ Measures
(NR-IQA) algorithms try to handle the very complex problem of assessing the visual quality of images, in the absence of a reference,the methods are coarsely divided into one of three trends [51]:
• Distortion-specific approaches. These
techniques relyon previously acquired knowledge about the type of visual quality loss caused by a specific distortion. The final quality measure is computed according to a model trained on clean images and on images affected by this particular distortion. Two of these measures have been included in the biometric protection method proposed in the present work.
The JPEG Quality Index (JQI), which evaluates the quality in images affected by the usual block artifacts found in many compression algorithms running at low
bit rates such as the JPEG [40].
The High-Low Frequency Index (HLFI), which considered local gradients as a blind metric to detect blur and noise [41]. Similarly, the HLFI feature is sensitive to the sharpness of the image by computing the difference between the power in the lower and upper frequencies of the Fourier Spectrum.
• Training-based approaches:In this type of
techniques a model is trained using clean and distorted images. Then, the quality score is computed based on a number of features extracted from the test image and related to the general model [42].
two-© 2016, IRJET | Impact Factor value: 4.45 | ISO 9001:2008 Certified Journal | Page 234 stage framework in which the individual measures
of different distortion-specific experts are combined to generate one global quality score.
IV. EXPERIMENTS AND RESULTS
The evaluation experimental protocol has been designed with a two-fold objective:
• First, evaluate the “multi-biometric” dimension of the protection method. That is, its ability to achieve a good performance, compared to other trait-specific approaches, under different biometric modalities. For this purpose three of the most extended image-based biometric modalities have been considered in the experiments: iris, finger-prints and 2D face.
• Second, evaluate the “multi-attack” dimension of the protection method. That is, its ability to detect not only spoofing attacks, but also fraudulent access attempts carried out with synthetic or reconstructed samples (see Fig. 1).
The task in all the scenarios is to distinguish between real and fake samples. As explained in Section III, for this purpose we build a 25-dimensional simple classifier based on general IQMs (see Fig. 2). This has allowed us to compare the performance of the proposed system with other existing state-of-the-art liveness detection as is explained below.
Fig-4: Typical real iris images (top row) and their
corresponding fake samples (bottom row) that may be found in the ATVS-FIr DB used in the iris-spoofing experiments. The database is available at http://atvs.ii.uam.es/.
A. Results: Iris
For the iris modality the protection method is tested under two different attack scenarios, namely: i ) spoofing attack and i i ) attack with synthetic samples.
For each of the scenarios a specific pair of real-fake data-bases is used. Databases are divided in to: train set, used to train the classifier; and test set, used to evaluate the performance of the proposed protection method.
The classifier used for the two scenarios is based on Quadratic Discriminant Analysis (QDA).
1) Results: Iris-Spoofing: The database used in this
spoof-ing scenario is the ATVS-FIr DB which may be obtained from the Biometric Recognition Group-ATVS.1
In Fig. 4 we show some typical real and fake iris images that may be found in the dataset.
Hear the database is divided into a: train set, comprising 400 real images and their corresponding fake samples of 50 eyes; and a test set with the remaining 400 real and fake samples coming from the other 50 eyes available in the dataset.
2) Results: Iris-Synthetic: In this scenario attacks are
per-formed with synthetically generated iris samples which are injected in the communication channel between the sensor and the feature extraction module (see Fig. 1). The real and fake databases used in this case are:
• Real database: CASIA-IrisV1. This dataset is publicly available through the Biometric Ideal Test (BIT) platform
of the Chinese Academy of Sciences Institute of Automation (CASIA).2
© 2016, IRJET | Impact Factor value: 4.45 | ISO 9001:2008 Certified Journal | Page 235 In Fig. 5 we show some typical images that may be
found in the CASIA-IrisV1 DB and in the WVU-Synthetic Iris DB.
The results achieved by the proposed protection method based on IQA on this attacking scenario are shown in the bottom row of Table II.the results presented in it confirm the “multi-attack” dimension of the proposed method.
Table-1: results (in percentage) obtained by the
proposed biometricprotection method based on iqa for the two attacking scenarios considered in the iris modality: spoofing (top row) and synthetic (bottom row). for comparison, the middle row reports theresults obtained by a self-implementation of the anti-spoofing method presented in [28]. the last column indicates, in seconds, the average execution time to process each sample
RESULTS IRIS
Fake (With
User Coop)
FFR FGR HTER Av.Exec(S)
IRIS Spoof 4.2 0.05 2.2 0.238
IRIS Spoof 1.3 4.9 3.1 2.563
B. Results: Fingerprints
For the fingerprint modality, the performance of the proposed protection method is evaluated using the LivDet 2009 DB [10] comprising over 18,000 real and fake samples.
As in the iris experiments, the database is divided into a: train set, used to train the classifier; and test set, used to evaluate the performance of the protection method.
The same QDA classifier already considered in the iris-related experiments is used here.
1) Results: Fingerprints-Spoofing LivDet: The LivDet
2009 DB [10] was captured in the framework of the 2009 Fingerprint Liveness Detection Competition and it is distributed through the site of the competition.4 It comprises three datasets of real and fake fingerprints captured each of them with a different flat optical sensor: i ) Biometrika FX2000 (569 dpi), i i
) CrossMatch Verifier 300CL (500 dpi), and i i i ) Identix DFR2100 (686dpi). The
Table-2: results (in percentage) obtained in the livdet
2009 db by: the proposed biometric protection method (iqa-based, top row);each of the best approaches participating in livdet 2009 [10] (second row); the method proposed in [53] which combines perspiration and morphological features (third row); the method proposed in [54] based on the wavelet analysis of the finger tip texture, according to an implementation from [53] (fourth row); the method proposed in [55] based on the curvelet analysis of the finger tip texture, according to an implementation from [53] (fourth row); the method proposed in [56]
Table-3: results (in percentage) obtained on the
replay-attack db by the proposed biometric protection method for the different scenarios considered in the dataset and following the associated evaluation protocol. the bottom row shows, in seconds, the average execution time of the proposed method to process each sample of the three datasets (the grandtest dataset is a combination of the three previous ones as explained in sect. iv-c)
Fig-5: Typical examples of real and fake fingerprint
© 2016, IRJET | Impact Factor value: 4.45 | ISO 9001:2008 Certified Journal | Page 236 http://prag.diee.unica.it/LivDet09/.C. Results: 2D Face
as shown bwlow.
The performance of the IQA-based protection method has also been assessed on a face spoofing database: the REPLAY-ATTACK DB [57] which is publicly available from the IDIAP Research Institute.5
Three different types of attacks were considered: i )
print, illegal access attempts are carried out with hard
copies of high-resolution digital photographs of the genuine users; i i ) mobile, the attacks done by using photos and videos taken with the iPhone using the iPhone screen; i i i ) highdef, similar to the mobile subset but in this case the photos and videos are displayed using an iPad screen with resolution 1024 × 768.
In addition, access attempts in the three attack subsets (print, mobile and highdef) were recorded in two different modes: i ) hand-based and i i ) fixed -support.
Some typical images (frames from the videos) from real and fake (print, mobile and highdef) access attempts that may be found in the REPLAY-ATTACK DB are shown in Fig. 6.
The database considers three independent datasets: train, used to tune the parameters ; development, to fix the decision threshold; and test, where final results are computed.
As the proposed IQA-based method is a single-image tech-nique,each frame of the videos in the REPLAY-ATTACK DB has been considered as an independent sample. Therefore, classification is done on a frame-by-frame basis.
In Table 3 we show the results obtained on the test set by the proposed method by using a standard classifier based on Linear Discriminant Analysis (LDA).
table-4 : best performing feature subsets of
dimensions 5, 10, 15 and best-overall, found using the sffs algorithm according to the hter on the test set of the atvs-fir db
table-5 : best performing feature subsets of
dimensions 5, 10, 15 and best-overall, found using the sffs algorithm according to the hter on the test set of the livdet09 db acquired with the biometrika sensor
table-6 : best performing feature subsets of
dimensions 5, 10, 15 and best-overall, found using the sffs algorithm according to the hter on the test set of the replay-attack db for the grandtest protocol
Fig-6 : Typical examples of real and fake (print, mobile
and highdef) face images that can be found in the public
REPLAY-ATTACK DB used in the face anti-spoofing experiments. Images were extracted from videos acquired in the two considered scenarios: controlled and
adverse. The data base is available at
© 2016, IRJET | Impact Factor value: 4.45 | ISO 9001:2008 Certified Journal | Page 237
FAKE
(print)
FAKE (mobile)
FAKE (highdef)
V. CONCLUSION
The study of the vulnerabilities of biometric systems against different types of attacks has been a very active field of research in recent years [1]. This interest has lead to big advances in the field of security-enhancing technologies for biometric-based applications.
In this context, we assume that the image quality properties of real accesses and fraudulent attacks will be different. Following this “quality-difference” hypothesis, in the present research work we have explored the potential of general image quality assessment as a protection tool against different biometric attacks (with special attention to spoofing), by considering a feature space of 25 complementary image quality measures which we have combined with simple classifiers to detect real and fake access attempts. The novel protection method has been evaluated on three largely deployed biometric modalities such as the iris, the fingerprint and 2D face, using publicly available databases with well defined associated protocols. This way, the results are reproducible.
Several conclusions may be extracted from the evaluation results presented in the experimental sections of the article: i ) The proposed method is able to perform ata high level for different biometric traits “multi-biometric” ; i i ) It is able to adapt to different typesof attacks providing for all of them a high level of protection “multi-attack” ; i i i ) It is able to generalize well to different databases, acquisition conditions and attack scenarios; iv ) The error rates achieved by the proposed protection scheme are in many cases lower than those reported by other trait-specific state-of-the-art anti-spoofing systems; and v ) in addition to its very competitive performance, and to its “multi-biometric” and “multi-attack” characteristics, the proposed method presents some other very
attractive features such as: it is simple, fast, non-intrusive, user-friendly and cheap, all of them very desirable properties in a practical protection system.
© 2016, IRJET | Impact Factor value: 4.45 | ISO 9001:2008 Certified Journal | Page 238
REFERENCES
[1] . rabhakar, . ankanti, and . K. Jain, “Biometric recognition: ecurity and privacy concerns,” IEEE
Security Privacy, vol. 1, no. 2,
pp.33–42, Mar./Apr. 2003.
[2]T. Matsumoto, “ rtificial irises: Importance of vulnerability analysis,” in Proc. AWB, 2004. [3]J. Galbally, F. Alonso-Fernandez, J. Fierrez, and J.
Ortega- arcia, “ high performance fingerprint liveness detection method based on quality related features,” Future Generat. Comput. Syst., vol. 28, no.1,
pp.311–321, 2012.
[4] . njos and . Marcel, “Counter-measures to photo attacks in face recognition: A public database and a baseline,” in Proc. IEEE IJCB, Oct. 2011, pp. 1–7. [5][17] J. Galbally, R. Cappelli, A. Lumini, G. G.
de Rivera, D. Maltoni, J. Fierrez, et al., “ n evaluation of direct and indirect attacks using fake fingers generated from I O templates,” Pattern
Recognit. Lett., vol. 31, no. 8, pp. 725–732, 2010.
[6] J. Hennebert, R. Loeffel, . Humm, and R. Ingold, “ new forgery scenario based on regaining dynamics of signature,” in Proc. IAPR ICB, vol. Springer LNCS-4642. 2007, pp. 366–375.
[7] D. Maltoni, D. Maio, A. Jain, and S. Prabhakar,
Handbook of Fingerprint Recognition. New York,
NY, USA: Springer-Verlag, 2009.
[8] I. vcibas, B. ankur, and K. ayood, “ tatistical evaluation of image quality measures,” J. Electron.
Imag., vol. 11, no. 2, pp. 206–223, 2002.
[9] T. Hastie, R. Tibshirani, and J. Friedman., The
Elements of Statistical Learning. New York, NY,