An Enhanced Approach for Treating Missing Value
using Boosted K-NN
K. Sathesh Kumar
Dept. of Computer Science Karpagam University
M.Hemalatha
Dept.of Computer Science Karpagam University
ABSTRACT
Knowledge Discovery in Dataset (KDD) plays a vital role in information analysis and retrieval based applications. Quality of data is the most indispensable component of KDD. The factor which affects the quality of datasets is presence of missing values. The data collected from the real world often contains serious data quality troubles such as incomplete, redundant, inconsistent, and/or noisy data. Handling missing values should be cautiously considered, or else prejudice might be introduced into the knowledge induced. The current work investigates three different treatments for dealing with missing values in United States Congressional Voting Records Database. All the machine learning methods were employed in one of the leading open-source data mining applications. This proposed study centers on the performance Evaluation of several classification models induced from data after applying three different methods to treat missing values. Results show that by boosting the k-nearest neighbor for imputation bids significant enhancement over traditional techniques (case/pairwise deletion and Replace missing value using mean ).
Keywords
Data Mining, Information Retrieval, Data Preprocessing, Data Cleaning, Data Warehouse.
1.
INTRODUCTION
Information retrieval (IR) is the study that deals with documents searching, document's metadata, as well as that of examining storage structure such as warehouse, relational Database, World Wide Web and etc. in order to we can get the information via data retrieval, information retrieval, document retrieval and text retrieval.These are all overlapped, but each has literature, theory, technologies and Praxis as its own body. IR is interdisciplinary, based on computer science, mathematics, library science, information science, information architecture, cognitive psychology, linguistics, statistics and law.[19]
Data preparation is an essential stage of information analysis. While plenty of low-quality information is available in various information sources. Information From Web, plenty of organizations or companies have an interest in how to transform the information into clean forms which can be used for high-profit purposes. This objective generates an urgent need for information analysis aimed at cleaning the raw data. Data pre-processing is a frequently abandoned but important step in the data mining process. Data mining and machine learning projects are particularly related to the phrase "garbage in-out". Data-gathering methods are often self-consciously controlled, resulting in out-of-range values. The main focus of the data warehouse is to store up the relevant data from the files .The objective of data preprocessing is to take out useful data from unwanted information and the purpose of pattern discovery transforms data into the form. Due to the huge amount of unwanted information from the web, the mining procedure
cannot use the original data. In the data preprocessing phase, the unwanted data should be cleaned, analyzed and transformed to the next step.
1.1 Data Cleaning
Data cleaning is the process of detecting and cleaning the inaccurate records from a set of records, table, or database. Data cleaning which deletes, modifies, or replaces the irrelevant data from the original files. Data cleaning having some major problems these are all Fill in missing values, Identify outliers and smooth out noisy data, correct inconsistent data, and Resolve redundancy caused by data typically, this process removes requests relating to non-analyzed resources such as images, multimedia files, and page style files. we can reduce file size to use less storage space and to make easy upcoming tasks. For example, by filtering out image requests, the size of files reduced to less than 50% of their original size. Data cleaning includes the elimination of irrelevant entries [1]
1.2
Handiling Missing Values
Ignore the data row: This is usually done when the class label is missing (assuming your data mining goal is classification), or many attributes are missing from the row (Not just one). However you’ll obviously get poor performance if the percentage of such rows are high. For example, let’s say we have a database of student enrollment data (age, SAT score, state of residence, etc.) and a column classifying their success in college to “Low”, “Medium” and “High”. Let’s say our goal is to build a model predicting a student’s success in college. Data rows who are missing the success column are not useful in predicting success so they could very well be ignored and removed before running the algorithm.
Use a global constant to fill in for missing values: Decide on a new global constant value, like "unknown", "N/A" or minus infinity, that will be used to fill all the missing values. This technique is used because sometimes it just doesn’t make sense to try and predict the missing value. For example, let's look at the student enrollment database again. Assuming the state of residence attribute data is missing for some students. Filling it up with some state doesn’t really make sense as opposed to using something like “N/A”.
Use attribute mean: Replace missing values of an attribute with the mean (or median if its discrete) value for that attribute in the database. For example, in a database of US family incomes, if the average income of a US family is X you can use that value to replace missing income values.
with the average cost of all luxury cars is probably more accurate than the value you’d get if you factor in the low budget cars. Use a data mining algorithm to predict the most probable value: The value can be determined using regression, inference based tools using the Bayesian formalism, decision trees, clustering algorithms (K-Mean\Median etc.). For example, we could use a clustering algorithm to create clusters of rows which will then be used for calculating an attribute mean or median as specified in technique [2]
In this paper as a data preprocessing stage the irrelevant and redundant information present or noisy and unreliable data are detected and they are filtered. To handle the problem of missing values we have introduced a new approach for predicting the missed values using the imputation method. The imputation is performed by adapting boosting technique on K-Nearest Neighbors.
2.
RELATED
WORK
The problem faced by the two components data mining and information retrieval is the same. The extraction of the knowledge and explore of information from the huge amount of data, from large database or warehouses. Data mining automatically and profoundly explores very large data sets, as a result uncovering otherwise unknown relationships in the middle of the data. In information retrieval, the user knows almost exactly what he looks for illustration an answer to a question, or documents corresponding to a given constraint in a database [3]. The search is performed in text, multimedia documents (images, videos, sound) or in web pages. This technology has been successfully applied in science, health, sales, marketing, customer support operation and finance to assist new discoveries and reinforce markets. Adding up, data mining techniques are being applied to find out and organize information from the mesh. Unfortunately these advancements in data storage and distribution technology have not been accompanied by respective research [4] in information retrieval technology for a long time. To put it in short: we are now being swamped with data, yet we are ravenous for knowledge. This need has created a completely new approach to data processing - the data mining, which concentrates on finding important trends and Meta information in large amounts of raw data.
The Laboratory Model of information retrieval (IR) evaluation has been challenged by progress in research related to significance and information searching as well as by the growing need for accounting for interaction in evaluation. Real human users introduce non-binary, subjective and dynamic relevance judgments into IR processes and affect these processes. [5]This information retrieval usage is increasingly becoming available in digital form due to the increase in legal information repositories on the Internet. In spite of this, users of European legal information encounter multitude of problems in information retrieval. The information is scattered in numerous databases in which documents are organized and classified in different ways, their contents are written in different languages, and the functionality and user interfaces of the databases differ. Moreover the differences in legal systems greatly hinder the use of European legal information. The problems related to the retrieval of legal information in Europe have been studied in a project called EULEGIS[18]. There is a growing interest in creating tools that can assist engineers in all phases of the software life cycle. This assistance requires techniques that go beyond traditional static and dynamic analysis. An example of such a technique is the application of information retrieval (IR), which exploits information found in project’s natural language. Such information can be extracted from the source code’s identifiers and comments and in artifacts associated with the project, such as the requirements.
On the other hand, the Geospatial Semantic Web provides better support for geographic information that the basic Semantic Web research has not addressed. In particular, there are three basic dimensions of geographic information on the semantic web: (a) Professional: which is structured geographic information stored in geographic databases which are indexed in web pages [20], (b) Naïve: which includes the retrieval of unstructured informal geographic information in web pages, and (c) Scientific: which is the geographic information science papers, models, and theories. Thus, establishing geographic information on the semantic web is a challenge worth research in IR[21]The information retrieval applications for broadcast news videos. The system is directly useful to an end user for easy access to the news stories of interest. It also acts as a platform for convenient deployment and experimentation of various video analysis and indexing techniques on real data, and on a large scale [6]. Information retrieval is a field concerned with the structure, analysis, organization, storage, searching, and retrieval of information such as a User and context sensitive retrieval, multilingual and multi-media issues, Better target tasks, Improved objective evaluations, Substantially more labeled data, Greater variety of data sources, Improved formal models Contextual retrieval and global information access were identified as particularly important long-term challenges. [7].
[image:2.595.68.562.331.704.2]3.
PROPOSED
FRAMEWOK
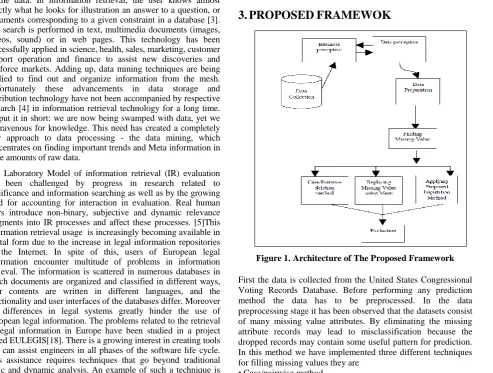
Figure 1. Architecture of The Proposed Framework
First the data is collected from the United States Congressional Voting Records Database. Before performing any prediction method the data has to be preprocessed. In the data preprocessing stage it has been observed that the datasets consist of many missing value attributes. By eliminating the missing attribute records may lead to misclassification because the dropped records may contain some useful pattern for prediction. In this method we have implemented three different techniques for filling missing values they are
• Case/pairwise method
• Replacing missing value using mean
• Predicting the missing value using boosted K-NN
method produced a noticeable improvement in filling missing values than the other two methods.
4.
DATASET
COLLECTION
The data set used in this work includes votes for each of the U.S. House of Representatives Congressmen on the 16 key votes identified by the CQA[8]. The CQA lists nine different types of votes: voted for, paired for, and announced for (these three simplified to yea), voted against, paired against, and announced against (these three simplified to nay), voted present, voted present to avoid conflict of interest, and did not vote or otherwise make a position known (these three simplified to an unknown disposition). In this database does not mean that the value of the attribute is unknown. It means simply, that the value is not "yes" or "no".
Number of Instances: 435 (267 democrats, 168 republicans) Number of Attributes: 16 + class name = 17 (all Boolean valued)
[image:3.595.379.471.71.202.2]Attribute Information:
Table 1. Attribute Information
Attribute Name Type
handicapped-infants Y/N water-project-cost-sharing Y/N adoption-of-the-budget-resolution Y/N physician-fee-freeze Y/N el-salvador-aid Y/N religious-groups-in-schools Y/N anti-satellite-test-ban Y/N aid-to-nicaraguan-contras Y/N mx-missile Y/N Immigration Y/N synfuels-corporation-cutback Y/N education-spending Y/N superfund-right-to-sue Y/N
Crime Y/N
duty-free-exports Y/N export-administration-act-south-africa Y/N
[image:3.595.55.288.292.627.2]Missing Attribute Values: Denoted by "?". It is important to recognize that "?"
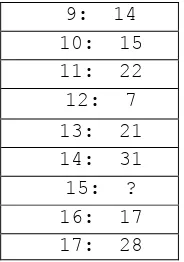
Table 2. Attribute Missing Values
1: 0 2: 0 3: 12 4: 48 5: ? 6: 11 7: 15 8: ?
9: 14 10: 15 11: 22 12: 7 13: 21 14: 31 15: ? 16: 17 17: 28
5.
PREDICTIVE
MODEL
DESCRIPTION
Predictive modeling is a process used in predictive analytics to create a statistical model of future behavior. Predictive analytics is the area of data mining concerned with forecasting probabilities and trends. A predictive model is made up of a number of predictors, which are variable factors that are likely to influence future behavior or results. In marketing, for example, a customer's gender, age, and purchase history might predict the likelihood of a future sale. [13].
5.1 Naive Bayesian (NB) Classifier
Naive Bayes classification is the classification algorithm gets the benefits from Oracle Data Mining. Bayes theorem which is the basis for Naive Bayes Classification, frequency of values counting and values of the historical data which is combined. Bayes' Theorem finds the probability of an event occurring given the probability of another event that has already occurred. If B represents the dependent event and A represents the prior event, Bayes' theorem can be stated as follows.
Bayes' Theorem: Prob(B given A) = Prob(A and B)/Prob(A) To calculate the probability of B given A, the algorithm counts the number of cases where A and B occur together and divides it by the number of cases where A occurs alone[9].
5.2
Support
Vector
Machines
(SVM)
Classifier
Support Vector Machines (SVM) are a powerful, advanced algorithm with able abstract foundations based on the Vapnik-Chervonenkis theory. SVM has able regularization properties. Regularization refers to the generalization of the archetypal to new data.SVM models accept a agnate anatomic anatomy to neural networks and adorable base functions, both accepted data mining techniques. However, neither of these algorithms has the well-founded knowledge access to regularization that forms the base of SVM. The superior of generalization and affluence of training of SVM is far above the capacities of these added acceptable methods.SVM can archetypal complex, real-world problems such as argument and angel classification, autography recognition, and Bioinformatics and biosequence analysis[22]
5.3 Best First Search Tree (BFST)
5.4 Logistic Regression (LR)
Logistic regression is an approach to prediction, like Ordinary Least Squares (OLS) regression. However, with logistic regression, the researcher is predicting a dichotomous outcome. This situation poses problems for the assumptions of OLS that the error variances (residuals) are normally distributed. Instead, they are more likely to follow a logistic distribution. When using the logistic distribution, we need to make an algebraic conversion to arrive at our usual linear regression equation (which we have written as Y=B0+B1X+e)[10].
5.5 Rule Induction (RI)
The decision tree algorithm is based on divide-and-conquer approach to the classification problem. They work in a top-down manner, seeking at each stage an attribute to split on, that separates the classes best, and then recursively processing the partitions resulted from the split. An alternative approach is to take each class separately, and try to cover all examples in that class, at the same time excluding examples not in the class. This is so called, covering approach [11].
6.
METHODOLODGY
6.1. Missing Value Treatment Methods
6.1.1 Case/Pairwise Deletion Method
The first method is the Case/Pairwise Deletion (CD) method which is also known as Complete Case Analysis method [14]. The CD method in this work adopts the pre-processing strategy where all instances with missing data in at least one of the attributes are deleted during the preprocessing phase. This converts the incomplete data set to a complete one. The complete data set contains only the instances with no missing values in any of the attributes and is input into the mining algorithm. shows the algorithm for the CD method that converts the incomplete data set to a complete one.
Algorithm steps
Generate a complete data set from the given experimental data set, D by deleting the records whose attribute contains missing value..
Input: Data set, D.
Output: Data set, D, contains instances with no missing values. Method:
for each case C in D
for each attribute A of C if value of A is null
delete C {endif}
{endfor} {endfor}
6.1.2
Replacing Missing Value Method
The Replace Missing Values enables the substitution of the missing values by the minimum, maximum or average statistics calculated on the basis of existing values for all or selected attributes. Moreover, we can also replace the missing values by some pre-defined values (e.g. zero or values that we consider that provide better fit to data). In this paper the replaced of
missing value is performed by finding mean value of each attribute and filling the missed ones.
Algorithm steps
Generate a complete data set from the given experimental data set, D by filling the attributes with missing values using mean value.
Input: Data set, D.
Output: Data set, D, contains instances with no missing values. Method:
for each selected Attribute A in D
Calculate the mean value MV of A {end for}
for each selected Attribute A in D for each case C of A
if the value of A is null fill the value of A as {endif }
{endfor} {endfor}
6.1.3 Replacing Missing Value Using K-NN
Imputation Method
The proposed substitution method considers that missing values can be substituted by the corresponding attribute value of the most similar complete instance (object) in the dataset.
Algorithm steps Step 1: Determine k
Step 2: Calculate the distances based on Euclidean between the missing input record and all the training dataset with complete attribute value.
Step 3: Sort the distance and determine k nearest neighbors based on the kth minimum distance.
Step 4: Gather the categories of those neighbors.
Step 5: Substitute the missing value by the corresponding attribute value of the most similar complete record. This method allows the assessment of missing data for all or selected attributes. In order to achieve this, a predictive model is erudite from a absolute dataset composed by the entire attributes values except the attribute for which we want to impute the missing values which was taken as the target. The induced predictive model is then applied to fill in the missing values of the target. More specifically, this operator divides the dataset into a training set with those examples that have no missing values and then applies testing set of the model which is the rest of the data where the attribute values are missing in order to estimate them. Depending on the type of the target, as well as, the attribute types, we can use a great variety of predictive models.
6.1.3
Replacing missing value by boosting the K-NN
as Imputation method
Algorithm steps Given (: (X1,y1),…,(xn,yn) Initialize D1(i) = 1/n For t = 1,…d:
Train weak learner using distribution
D
tGet weak hypothesis
D
t
1
(
i
)
D
t(
i
)
exp(
ty
ih
t(
x
i))
Choose
t RUpdate
t
i t i t t
t
Z
x
h
y
i
D
i
D
1(
)
(
)
exp(
(
))
Output Final Hypothesis
)
(
)
(
1
x
h
sign
x
H
tT
t t
7.
ESTIMATION
OF
MODEL
PERFORMANCE
In pattern recognition and information retrieval, precision is the fraction of retrieved instances that are relevant, while recall is the fraction of relevant instances that are retrieved. Both precision and recall are therefore based on an understanding and measure of relevance [15].
Precision: Precision is a measure of the accuracy provided that a specific class has been predicted. It is defined by:
Precision = tp/(tp + fp)
Where tp and fp are the numbers of true positive and false positive predictions for the considered class.
Recall :Recall is a measure of the ability of a predictive model to select instances of a certain class from a data set. It is commonly also called sensitivity, and corresponds to the true positive rate. It is defined by the formula:
Recall = Sensitivity = tp/(tp+fn)
Where tp and fn are the numbers of true positive and false negative predictions for the considered class. tp + fn is the total number of test examples of the considered class[16][17].
Accuracy: The accuracy of a measurement describes how close it is to the 'real' value. This real value need not be very precise; it just needs to be the 'accepted correct value'. The accuracy is the proportion of true results (both true positives and true negatives) in the population. It is a parameter of the test. [17].
Accuracy = (tp+tn)/(tp+fp+fn+tn)
8.
EXPERIMENTAL
RESULTS
In this section the performance of case/pairwise deletion, Replacing with missing values, replacing missing values with K-NN and replacing missing values with boosted K-K-NN is observed by applying them with the five different prediction models Rule Induction, Naïve Bayes, Logistic Regression, Support Vector Machine and Best First Decision Tree. The resulting tables show the performance of each method.
Algorithm:Experimental-methodology Input: The given experimental data set, D.
Output: The results inferred from the induced models. Method:
If pre-replacing or pre-processing method
Apply method to D
Transform D into regular format of the mining algorithm
Induce model from D using X-validation technique
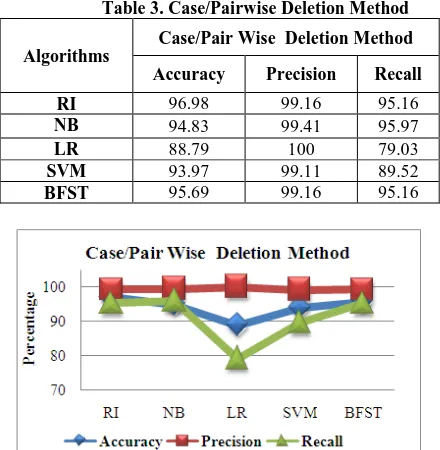
[image:5.595.314.534.156.381.2] Tabulate the accuracy, precision and recall for each target/class Attribute value from confusion matrix. From the tables I, II , III and IV it is observed that Rule Induction Method gives better results than the other algorithms. But Logistic Regression gives low accuracy and high precision value.
Table 3. Case/Pairwise Deletion Method
Algorithms
Case/Pair Wise Deletion Method
Accuracy Precision Recall
RI 96.98 99.16 95.16
NB 94.83 99.41 95.97
LR 88.79 100 79.03
SVM 93.97 99.11 89.52
BFST 95.69 99.16 95.16
[image:5.595.312.535.414.628.2]Fig 2. Performance Chart for Case/ Pair-wise Deletion
Table 4. Replacing Missing Values Method
Algorithms
Replacing Missing Value by Appling Mean
Accuracy Precision Recall
RI 95.63 98.06 94.06
NB 90.11 94.44 89.4
LR 81.84 79.47 70.79
SVM 92.64 99.16 88.76
BFST 94.71 96.21 95.13
Figure 3. Performance chart for Replacing Missing Values
Table 5. Replacing Missing Value using k-NN based Iimputation Method
Algorithms
Impute Based Method using K-NN
Accuracy Precision Recall
RI 96.98 99.16 95.16
NB 91.81 94.87 89.52
LR 88.79 100 79.03
SVM 93.97 99.11 89.52
Fig 4. Performance chart for Impute Based Method k-NN
Table 6. Replacing Missing Value using Proposed AdaBoosting KNN based Imputation Method
Algorithms
Proposed AdaBoosting KNN method
Accuracy Precision Recall
RI 97.83 99.6 96.86
NB 94.96 97.55 92.74
LR 99.52 100 99.22
SVM 98.31 99.6 97.65
BFST 98.55 99.6 98.04
Fig 5. Performance chart for Proposed AdaBoosting KNN method
The evaluation results for the above four methods reveals that the performance using our proposed approach drastically improves the overall performance of all the five classification methods. And the noticeable improvement is that logistic regression produces a very significant change in its performance which outperforms the other classification methods.
9.
CONCLUSION
In the real world applications the information to be processed are raw data. The data used for information retrieval are not complete sets. Handling the missing value of the dataset is a serious problem for predicting process. This paper focuses on treating missing values in the United States Congressional Voting Records Database. The result reveals that the case/pairwise deletion method produces better results than the replacing missing value using mean but removing the missing attribute value may lead to the misclassification and wrong prediction. Because those dropped records may produce interesting patterns for classification. In the case/pairwise deletion method it uses only 232 instances out of 435. The remaining instances consist of missing values so they are eliminated in the prediction process. So the case /pairwise deletion is not a recommended method. Next the replaced with missing values using k-nn method produces their outcome similar to case/pairwise deletion. But out proposed method after
boosting the performance of K-NN it produces a significant impact on the classification method. We conclude that our proposed method for filling missing value best performs then remaining three of them.
10.
ACKNOWLEDGEMENT
I thank the Karpagam University for the motivation and encouragement for giving the opportunity to do this research work as successful one.
11.
REFERENCES
[1] Suneetha, K.R, and R. Krishnamoorthi, 2009. Data Preprocessing and Easy Access Retrieval of Data through Data Warehouse. Proc. World Congress on Engineering and Computer Science (IWCECS‘09).
[2] Data mining handling missing value http://www.developerzenom/2009/08/14/data-mining-handling-missing-values-the-database/
[3] Bernadette Bouchon-Meunier,Marcin Detyniecki, Marie-Jeanne Lesott,Christophe Marsala. and Maria Rifqi.: Real-World Fuzzy Logic Applications in Data Mining and Information Retrieval:Page(s)219-247
[4] Bikash Mukhopadhyay, Sripati Mukhopadhyay,. Data Mining Techniques for Information Retrieval 2nd International CALIBER-2004, New Delhi, 11-13 February, 2004
[5] Jaana Kekäläinen & Kalervo Järvelin,” evaluating information retrieval system under the challenges of interaction of multidimensional dynamicrelevance”, Published in: Harry Bruce, Raya Fidel, Peter Ingwersen, andPertti Vakkari (Eds.) Proceed-ings of the 4th CoLIS Conference.Greenwood Village, CO: Libraries Unlimited, Page(s). 253-270.
[6] Tarun Jain Sai Ram Kunala Ravi Kishore Kandala C.V. Jawahar.:ASystem for Information Retrieval Applications on Broadcast NewsVideos.: International Institute of Information Technology. Hyderabad, India
[7] James Allan (editor), Jay Aslam, Nicholas Belkin, Chris Buckley, Jamie Callan, Bruce Croft (editor), Sue Dumais,Norbert Fuhr.:Challenges in Information Retrieval and Language Modeling.: Report of a Workshop held at the Center for Intelligent Information Retrieval,University of Massachusetts Amherst, September 2002 Page(s)1-17 [8] Congressional Quarterly Almanac, 98th Congress, 2nd
session 1984,Volume XL: Congressional Quarterly Inc. Washington, D.C., 1985.
[9] BayesTheorem,”http://www.cuttheknot.org/Probability/Bay esTheorem.shtml”
[10] chao-ying joanne peng, kuk lida lee, gary m. Ingersoll.: An Introduction to Logistic Regression Analysis and Reporting: The Journal of Educational Research:Page(s)3-14
[11] Tejaswini Abhijit Hilage, R. V. Kulkarni.: Review of literature on data mining. IJRRAS 10 (1) January 2012 Page{s}107-114
[13] David A. Dickey, N. Carolina State U., Raleigh, NC.: Introduction to Predictive Modeling with Examples. Statistics and Data Analysis Global Forum 2012.Page{s}1-14
[14] Acuna, E. & Rodriguez, C. (2009). The treatment of missing valuesand its effect in theclassifier accuracy.
Retrieved 30/01/2009
fromhttp://academic.uprm.edu/~eacuna/IFCS04r.pdf [15] “precision and recall”,
http://www.bainsight.com/blog-archive/Pages/3-7-2011-1.aspx
[16] Evaluatingaclassificationmodel,”http://www.compumine.co m/web/public/newsletter/20071/precision-recall”
[17] Precision and
accuracy,”http://www.worsleyschool.net/science/files/preci sion/andaccuracy.html”
[18] Virpi Lyytikäinen, Pasi Tiitinen, Airi Salminen.: Challenges for European legal information retrieval Published in F. Galindo & G. Quirchmayer (Eds.), Proceedings of the IFIP 8.5 Working.Page(s)1-16
[19] Vandana Dhingra, Komal Kumar Bhatia.: Towards Intelligent Information Retrieval on Web. International Journal on Computer Science and Engineering Vol. 3 No. 4 Apr 2011.Page{s}1721-1726
[20] Max J. Egenhofer.: Toward the Semantic Geospatial Web: In Proc. 10th ACM Int. Symp. on Advances in Geographic Information Systems, 2002.
[21] Raghda Fouad, Mohamed Hashem, Nagwa Badr and Max J. Egenhofer Hanaa Talha,: Exploring a Hybrid of Geospatial Semantic Information in Ubiquitous Computing Environments : International Journal of Computer Science Issues, Vol. 8, Issue 6, No 2 on December 2011,Page(s) 117-121
[22] Chih-Wei Hsu, Chih-Chung Chang, and Chih-Jen Lin.: A Practical Guide to Support Vector Classication.Page{s}1-16