An Improved Retinal Blood Vessel Segmentation
Algorithm based on Multistructure Elements Morphology
Sifna N Shajahan
Department of Electronics and Communication Federal Institute of Science and Technology
Ernakulum, India
Rajesh Cherian Roy
Associate Professor
Department of Electronics and Communication Federal Institute of Science and Technology
Ernakulum, India
ABSTRACT
Retina is the portion where many important eye diseases and systemic diseases manifest. By evaluating the retinal blood vessels, doctors can diagnose the primary stages of diabetic retinopathy, age related macular degeneration, glaucoma etc which may eventually lead to blindness. The objective is to develop an algorithm that segments the retinal blood vessels in a short time and with high accuracy. But the low gray level contrast and dynamic range of the image make the blood vessel segmentation process very difficult. A new multiscale transform, Curvelet transform, is used for retinal image contrast enhancement. Since the blood vessels are distributed in various directions multistructure elements morphology is used to find the blood vessel edges. The false edges are removed by morphological reconstruction. A locally applied level dependent thresholding algorithm with connected component analysis and length filtering removes the remaining false edges after reconstruction step. The proposed algorithm, when experimentally applied on images from the DRIVE database, gave an accuracy of more than 97% in less than 15 s, thus showing its effectiveness in retinal blood vessel segmentation.
General Terms
Image processing, Medical application, Retinal image analysis, Algorithms.
Keywords
Curvelet transform, fundus region, segmentation, multistructure elements morphology, connected component analysis, length filtering, level dependent threshold.
1.
INTRODUCTION
The sense organ associated with vision is eye, in that a layered tissue lining the interior of the eye called retina converts the incoming light into a neural signal which is further processed in the visual cortex of the brain. Eye diseases as well as diseases affecting circulation and brain can manifest themselves in the retina. These include ocular diseases such as macular degeneration, glaucoma, the first and third most important cause of blindness in developed world, a number of systemic diseases such as diabetic retinopathy from diabetes, the second most common cause of blindness, hypertensive retinopathy from cardiovascular disease and multiple sclerosis, central retinal artery occlusion etc. All these can be detected and diagnosed in the early stage by retinal image analysis.
Various methods have been used to segment retinal images. Chaudhuri, Chatterjee [1] proposed a method for blood vessel detection using two-dimensional matched filters. Soares, Joao, Jorge [2] proposed a segmentation scheme based on 2-D morlet wavelet and supervised classification. Thin blood
vessels are not captured in this method. Staal, Abramoof [3] proposed segmentation based on image ridges. Miri, Ali Mahloojifar [4] proposed an efficient retinal analysis based on curvelet transform and multistructure elements morphology. The objective is to develop an algorithm that segments the retinal blood vessels in a short time and with high accuracy. Several techniques have been used to enhance the retinal image quality such as histogram equalization, unsharp masking, local normalization, matched filters, wavelet, contourlet [5] etc. A new multiscale transform, Curvelet transform, introduced by Candes and Donoho [6] is used here. The curvelet transform enhances the retinal image and prepares it for better vessel detection. A tuning parameter, applied on curvelet coefficients enhances the weak edges along with noise elimination. The blood vessel edges are detected by applying bottom-hat function in multistructure elements morphology. The bottom-hat morphology function produces an image with uniform background and highlighted blood vessels. The multistructure elements morphology is more efficient than conventional morphology due to high sensitivity along each direction. Then reconstruction using multistructure elements helps to remove detected ridges not belonging to vessel tree with thin vessel preservation. To obtain a clear final result, image is decomposed into several tiles and connected component analysis (CCA) is applied locally on each tile based on level dependent thresholding algorithm. The level dependent thresholding algorithm helps to detect thin vessels and severe lesions in retinal image. Length filtering after CCA removes the isolated pixels remains after CCA.
The paper is organized as follows. Section 2 introduces curvelet transform via wrapping method. Section 3 contains an overview of mathematical morphology, multistructure elements morphology and morphological operators by reconstruction. The proposed method is elaborated in section 4. The experimental results are shown in section 5 and the last section gives the conclusion of the work.
2.
CURVELET TRANSFORM
curvelet coefficients indexed by a scale parameter, an orientation parameter and a spatial location parameter. All curvelets at a given scale are obtained by translating and rotating a single ‘mother curvelet’.
Curvelet decomposes the image into a series of low pass and high pass band which is the same as wavelet, but instead of extracting directional details as in wavelet it extracts structural details along the radial wedges in frequency domain. Curvelet coefficients are obtained by taking the inner
product between the element and a mother curvelet.
Since wrapping method is faster and easier to implement than USFFT method, the wrapping method is used in the proposed algorithm. In this method, the image is divided into a number of frequency bands and each band is analyzed using curvelet transform [7]. The steps in FDCT via wrapping are as follows:
1. The fourier samples are calculated using 2D FFT
2. The obtained samples are multiplied with discrete localizing window , for each scale j and angle l
3. Wrap this product using a rectangular grid having
sides of length L1,j × L2,j around the origin and obtain
where the range for n1 is now 0 n1 ˂ L1,jand 0
n2 ˂ L2,j
4. The discrete curvelet coefficients are calculated by applying inverse 2D FFT to each .
3.
MORPHOLOGY
3.1
Mathematical morphology
Mathematical morphology uses concepts from set theory, topology and geometry to analyze geometrical structures in image. It examines the geometric structure of an image by probing it with small patterns called structuring elements (SE) of varying size and shape. Morphological operations apply an SE to the input image, creating an output image of the same size. The value of each pixel in the output image is based on the comparison of the corresponding pixel in the input image with its neighbors based on SE. Mathematical morphology is composed of a series of morphological algebraic arithmetic operators. The basic operations in morphology such as dilation, erosion, opening and closing are used for detecting the boundaries, modifying, manipulating the features in images based on their shapes. The shape and size of SE play an important role in such processing and thus SE’s are selected according to the need and purpose of the allied application.
The edges of an image can be found by applying a morphological edge detector named the bottom-hat transformation described as follows:
where
(
)
denotes the closing operator, I the image and S represents SE.3.2
Multistructure elements morphology
The main factor in morphological image processing is the proper selection of SE. The final result of morphology depends on the size and shape of SE. In order to detect simple, straight edges, single and symmetrical SE’s such as disk, diamond etc are commonly used but they fail to detect complex edges because those symmetrical SE’s are only sensitive to image edges which is in the same direction as of SE and are not so effective to the edges which has direction different to SE. In order to deal with those complex edges, multistructure elements morphology is used. The basis of multistructure elements morphology is to gather several SEs in one square window.
The SE’s in a (2N+1)
(2N+1)square window of a digital image F(m,n) with centre (m,n) can be denoted by,(6) where i=0,1,..4N- α 80° N and θi is the direction angle of SE [8].
3.3
Morphological reconstruction
Morphological reconstruction is defined as repeated dilations of an image, called the marker image, until the contour of the marker image fits under a second image, called the mask image. In reconstruction, the peaks in the marker image “spread out” or dilate [9]. The reconstruction by dilation is denoted by,
where ρ is the mask image and g is the marker image. Based on this operation, opening by reconstruction is denoted as:
8
4.
PROPOSED METHOD
The proposed method is illustrated and explained in detail.
4.1
Channel selection
The proposed algorithm is applied on the green channel of colored retinal image, because compared to other channels it has the highest contrast. The fundus region possesses high contrast with the black background. Thus a simple thresholding method proposed by Otsu [10], is used to detect the fundus region. The enhanced image is multiplied with this disc fundus region to eliminate the undesired objects outside the fundus disk that result from enhancement step.
4.2
Tuning of curvelet coefficients
directional bands Di containing curvelet coefficients are obtained. Here 5 scales and 16 directions are used for wrapping that causes 16 bands in scale 2, 32 in scale 3 and 4, 64 bands in scale 5. By tuning the curvelet coefficients in each scale and each band with a non linear function, edges of the image as well as contrast gets improved [11]. The non linear function used for tuning is given below [4]:
where x is the curvelet coefficient, p determines the degree of non-linearity. w1, w2 and w3, are the weights assigned by which how much the coefficients are magnified or reduced or unchanged can be identified, the adjustment parameter ɑ regulates the modification interval. The parameter c σij, is the noise standard deviation in the same direction and same scale and the maximum value of curvelet coefficient m, can be derived from maximum coefficients of the relative band
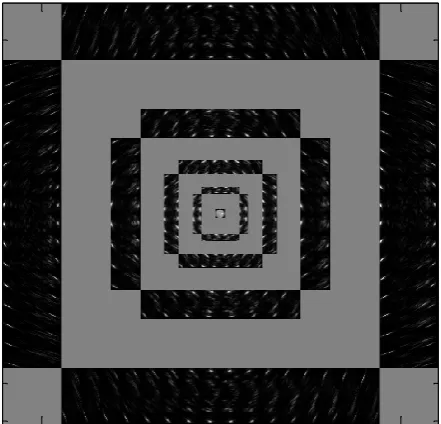
(m = kMC)or from noise standard deviation m kσij). The parameter kis an independent parameter that can be selected by the user. Table 1 shows the range of values used for modification. The enhanced image containing modified coefficients are then reconstructed by IFDCT. The curvelet coefficients for scale 5 and direction 16 are shown in Fig. 1.
4.3
Blood vessel detection using bottom-hat
morphology
The blood vessel edges are detected by means of bottom-hat via multistructure elements morphology. For N=2, the square window of 5×5 SE contains eight directional angles with an angle difference of 22.5º. The SE’s at various angles are created using (6) for edge detection. The Si created with required directional resolution is applied on the bottom-hat edge detector function (5) and sub edges F(I)i are measured. The bottom hat function produces an image with highlighted blood vessels in uniform background. The whole of detected edges are then calculated using the equation:
0
where F(I) is the whole edge image, M 80 α gives the number of Si where α is the angle difference between Si and
ωi is the weight assigned to each of the sub edge image. The
ωi can be derived as ωi = 1/M or it can be calculated by other methods [12].
4.4
Opening by reconstruction in false
edges removal
During edge detection using bottom-hat edges other than the blood vessels are also detected. In the reconstruction step those edges are removed by means of opening by reconstruction using (7) and (8). It includes conventional
[image:3.595.316.537.71.283.2]Fig 1: Curvelet coefficients for scale 5 and direction 16. The second scale contains 16 bands, third and fourth 32 bands, and 64 bands in fifth scale.
Table 1. Modifying function parameter
Parameters Range Used value
w1 w1 ≥ 1 1
w2 w2 ≥ 1 2.5
w3 w3 ˃ 0 1
ɑ 0 ˂ ɑ ˂ m/c 1.25
k k ˃ 0 0.5
p 0 ˂ p ˂ 1 0.5
morphological opening via multistructure and reconstruction by geodesic dilation. A 5×5 SE is used for opening. The steps in morphological opening are same as that in edge detection, except the weight assignment. Here F(I) is constructed by taking maximum pixel value from various F(I)i and the
whole edges are calculated using the equation:
m
The reconstruction by dilation is done using a 3
3 square SE using (7) with the help of a marker and mask image [13]. The opened image is used as mask and dilated image is used as marker.4.5
Connected component analysis based
on adaptive level dependent threshold and
length filtering
The final segmentation result is obtained by applying CCA and length filtering. The image is divided into blocks of size 50×50, obtained experimentally. The threshold value of each block is evaluated using a level dependent thresholding algorithm as below [14]:
50 100 150 200 250 300 350 400 450 500
50
100
150
200
250
300
350
400
450
500
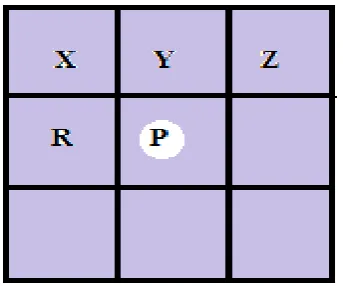
[image:3.595.311.536.340.484.2]Fig 2: Eight connected neighborhood for labelling operation.
where dj is the pixel values in each block and j=1,2,..etc. A proper threshold separates false edges from vessel edges efficiently. Later, connected components above the specific threshold are labeled for each block. The connected components labeled using 8-connected neighborhoods are considered to be a single object. The eight connected neighborhood is shown in Fig. 2 and the labeling operations in CCA according to eight connected neighborhood is as follows [15]:
The labeling operation scans the image along the row until it comes to the pixel P as in Fig 2, whose value is greater than threshold. When this is true, it checks the four neighbors X, Y, Z and R of which have been already scanned. Based on the neighbors value, labeling of P occurs as follows:
1. If all the four neighbors are less than threshold, a new label is assigned to P and the label value is incremented.
2. Else, if only one neighbor has pixel value greater than threshold, assign its value to P.
3. Else, if more than one of the neighbors has pixel value greater than threshold, assign one of the labels to P.
Here the pixel counts greater than 7 are considered as blood vessel. Thus in length filtering after CCA, the count of labels less than 7 are considered as isolated pixels and removed [16]. Then the connected components of each block are combined together to form the final result.
5.
EXPERIMENTAL RESULTS
The proposed method implemented using MATLAB version 7 or above, on publicly available DRIVE database takes less than 15 s for blood vessel segmentation. The results of each step in the proposed method are shown in Fig. 3.
5.1
Enhancement Assessment
The PSNR and Contrast Improvement Index (CII) are used for enhancement assessment. PSNR can be computed as:
0
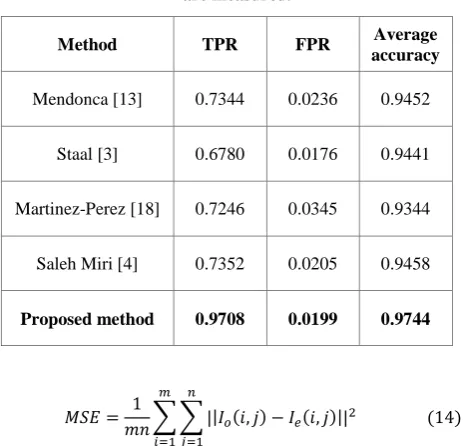
where MAXI is the maximum pixel value of the image, MSE is the mean squared error computed via :
[image:4.595.315.538.65.510.2]
(a) (b) (c)
Fig 3: Results of proposed method related to images 02, 11 and 22 of DRIVE database respectively. From top to bottom they are the green channel, results of contrast enhancement by tuning of curvelet, results of edge detection, result of geodesic dilation and final result using CCA and filtering.
Table 2. Contrast enhancement assessment
Measure Average Standard deviation
PSNR 33.1481 0.8534
[image:4.595.92.264.73.216.2]Table 3. Performance comparison between recent studies. The average accuracy of images 02, 11 and 22 of database
are measured.
Method TPR FPR Average accuracy
Mendonca [13] 0.7344 0.0236 0.9452
Staal [3] 0.6780 0.0176 0.9441
Martinez-Perez [18] 0.7246 0.0345 0.9344
Saleh Miri [4] 0.7352 0.0205 0.9458
Proposed method 0.9708 0.0199 0.9744
where Io and Ie are the original and enhanced images, respectively. Another important measurement is the contrast improvement index (CII), which is defined as:
where Cenhanced, Coriginal are the contrast for proposed and original images, respectively. The contrast C of an image is defined as:
where rand b are the mean gray-level value of the foreground and background, respectively. The mean gray-level is obtained by summing up all the pixel values in the image. The results of PSNR and CII are presented in Table 2.
5.2
Segmentation Assessment
The performance of blood vessel segmentation algorithm is normally measured using true positive rate (TPR), false positive rate (FPR) and accuracy (ACC) [17]. The calculation of TPR, FPR and accuracy is done with the help of manually segmented image in DRIVE database. The number of pixels identified as blood vessel in both ground truth and segmented image is called true positive (TP). The number of pixels identified as a non-vessel in the ground truth and segmented image is termed as true negative (TN). False negative (FN) is the number of those pixels that are identified as non-vessel in segmented image but as a vessel in the ground truth. False positive (FP) is pixels marked as a vessel in the segmented image but not a vessel in the ground truth. The TPR, FPR and Accuracy can be measured as:
8
The results of true positive rate, false positive rate and accuracy are presented in Table 3.
The performance of algorithm also depends on its run time. The run time of the algorithm is below 15 s. The proposed method is implemented using a computer with Intel core i3 2.4 GHz CPU and 4 GB RAM. The enhancement part takes about 7 – 9 s and the segmentation part takes about 4 – 5 s to analyze each image of DRIVE database. Thus the algorithm is suitable for applications that need quick blood vessel detection.
6.
CONCLUSION
In this work, an algorithm that segments the retinal blood vessels in very short time with very high accuracy is presented. The intrinsic characteristics of retinal images make the vessel detection process more complicated. The high ability of Curvelet transform, to represent images containing edges, improved the image contrast of retinal images for segmentation part. The blood vessels distributed in different directions are detected by means of multistructure elements morphology. The false edges are removed by morphological reconstruction, while preserving thin vessels. The application of CCA and length filtering helped to remove the remaining false edges more accurately. Most of the thin and small vessels are detected by the usage of level dependent threshold in CCA. The various assessments prove that the proposed method segments the retinal blood vessels with an accuracy of more than 97% within 15 s. In order to deal with severe lesions in retinal images and also to increase the accuracy further, a possible line of further research is to replace the level dependent thresholding algorithm.
7.
REFERENCES
[1] S. Chaudhuri, S. Chatterjee, N Katz, M Nelson and M Goldbaum “Detection of blood vessel in retinal images using two-dimensional matched filters,” IEEE Trans.Med.Imag.,vol 8, no.3, pp 263-269,Sep.1989 [2] Soares, Joao VB, Jorge JG Leandro, Roberto M. Cesar,
Herbert F. Jelinek, and Michael J. Cree, "Retinal vessel segmentation using the 2-D Gabor wavelet and supervised classification," IEEE Trans Medical Imag., vol. 25, no. 9 , May 2006.
[3] J. J. Staal, M. D. Abramoff, M. Niemeijer, M. A. Viergever, and B. van Ginneken, “Ridge based vessel segmentation in color images of the retina,” IEEE Trans. Med. Imag., vol. 23, no. 4, pp. 501–509, Apr. 2004. [4] Mohammad Saleh Miri and Ali Mahloojifar, “Retinal
image analysis using curvelet transform and multistructure elements morphology by reconstruction,”
IEEE Trans.Biomed.Imag., vol58,no.5,
pp1183-1191,may 2011
[5] Peng Feng, Yingjun Pan , Biao Wei, Wei Jin, Deling Mi, “Enhancing retinal image by the Contourlet transform,” Pattern Recognition Letters, vol. 28, 516–522, 2007 [6] E. J. Candes and D. L.Donoho, “Curvelets—A
surprisingly effective nonadaptive representation for objects with edges,” in Curves and Surfaces, Nashville, TN: Vanderbilt Univ. Press, 1999, pp. 123–143.
[7] E. Candes, L. Demanet, D. Donoho, and L. Ying, “Fast discrete curvelet transforms,” Multiscale Model. Simul., vol. 5, no. 3, pp. 861–899, 2006
World Congr. Intell. Control Autom., pp. 9795–9798, 2006.
[9] S. Mukhoopadhyay and B. Chanda, “Multiscale morphological segmentation of gray-scale images,” IEEE Trans. Image Process., vol. 12, no. 5, pp. 533–549, May 2003.
[10] N. Otsu, “A threshold selection method from gray level
histograms,” IEEE Trans. Syst., Man, Cybern., vol. SMCA-9, no.1, pp. 62–66, Jan. 1979.
[11] J. Starck, F. Murtagh, E. J. Candes, and D. L. Donoho,
“Gray and color image contrast enhancement by the curvelet transform,” IEEE Trans. Image Process., vol. 12, no. 6, pp. 706–717, Jun. 2003.
[12] Y. Ma,M. Yang, and L. Li, “A kind of omni-directional
multi-angle structuring elements adaptive morphological filters,” J. Chin. Inst. Commun., vol. 25, no. 9, pp. 86– 92, 2004.
[13] A.M.Mendonca and A. Campilho, “Segmentation of
retinal blood vessels by combining the detection of centerlines and morphological reconstruction,” IEEE Trans. Med. Imag., vol. 25, no. 9, pp. 1200–1213, Sep. 2006.
[14] Rajkumar K. K. and G. Raju “Enhancement of
Mammograms Using Tophat Filtering and Wavelet Decomposition,” Journal of Computer & Mathematical Sciences, Vol. 2 , no. 6, pp. 812-818 , December 2011
[15] Waltz, Frederick M., and John WV Miller. "Comparison
of connected-component algorithms." Proceedings of SPIE- The International Society for Optical Engineering. Vol. 3836. 1999.
[16] S. Supot, Ch. Thanapong, P. Chuchart, and S. Manas,
“Automatic segmentation of blood vessels in retinal image based on fuzzy k-median clustering,” in Proc. IEEE Int. Conf. Integr. Technol.,Mar. 2007, pp. 584– 588.
[17] E. Ardizzone, R. Pirrone, O. Gambino, and S. Radosta,
“Blood vessels and feature points detection on retinal images,” in Proc. 30th Annu. Int. IEEE EMBS Conf., Aug. 2008, pp. 2246–2249
[18] M. E. Martinez-Perez, A. D. Hughes, S. A. Thom, A. A.