N A N O E X P R E S S
Open Access
Reduction of breakdown threshold by metal
nanoparticle seeding in a DC microdischarge
Jordan Sawyer
1, Jacques Abboud
1, Zhili Zhang
1*and Steven F Adams
2*Abstract
Significant reduction of the breakdown threshold in a DC microdischarge via seeding metal nanoparticles has been demonstrated. Compared to standard Paschen curves in dry air, reductions in the breakdown voltage of 5% to 25% were obtained forPDvalues (the product of pressure and electrode gap distance) ranging from 20 to 40 Torr-cm by seeding aluminum and iron nanoparticles with mean sizes of 75 nm and 80 nm, respectively. No secondary energy source was required to achieve this breakdown threshold reduction. From high-speed chemiluminescence imaging of the discharge evolution, breakdown was shown to be initiated at reduced voltages. Following
breakdown, the increase in temperature ignited some of the nanoparticles near the cathode. Results suggest that possible charging of the nanoparticles within the gap may reduce the effective transient distance, leading to the threshold reduction.
Keywords:Microdischarge; Metal nanoparticles; Threshold
Background
The mechanisms for breakdown in gas discharges have been studied extensively for over a century [1]. It is well known that the voltage required to initiate breakdown of a gaseous DC discharge depends strongly on the pressure P multiplied by the distance D of the gap between the electrodes, PD, as described by Paschen's Law [2]. For a gas at atmospheric pressure, by limiting the inter-electrode separation to a distance of less than a millimeter, it is possible to produce a stable ‘normal-glow’ micro-discharge [3]. Although such a micromicro-discharge is spatially confined compared to a traditional low-pressure discharge, the normal glow properties of a nonthermal discharge still apply, such as an electron temperature,Te, which is several orders of magnitude larger than the gas temperature,Tg [3-5]. Many applications have been explored to exploit this excess electron energy and drive optical or chemical pro-cesses such as vacuum-ultraviolet light sources [6], bio-medical systems [7,8], nanoparticle synthesis [9,10], and plasma ignition [11]. However in atmospheric air, even with a small inter-electrode separation of less than 1 mm, a
sizeable voltage (upwards of 4 to 5 kV) may still be required to initiate breakdown.
A significant reduction of the breakdown threshold within a microdischarge could be a breakthrough that en-ables numerous applications. Such a breakdown voltage re-duction could allow for the use of smaller, cheaper, and safer power supplies. One method of reducing the voltage required to initiate breakdown is to generate seed electrons into the discharge region. Breakdown under these condi-tions is termed‘under-voltage breakdown’. Previously stud-ied techniques for achieving under-voltage breakdown have included electron seeding by illumination of the cath-ode by ultraviolet (UV) light [12-14], resonance enhanced multi-photon ionization (REMPI) by UV pulsed lasers [15,16], and the use of secondary electrodes or spark plugs [17]. The major limitation of these methods is that they all require a secondary energy source in order to produce the seed electrons which can increase the overall cost, com-plexity, and weight of the microdischarge system.
On the other hand, the effect of solid particle contam-ination, whether intentionally introduced or not, on the breakdown process in air gaps has been explored previ-ously. Unwanted solid particle contaminants in commer-cial electrical systems can lead to arcing and failure of transmission lines and gas insulation systems. Sand and dust with particle sizes above several tens of microns
* Correspondence:[email protected];[email protected] 1Department of Mechanical, Aerospace and Biomedical Engineering,
University of Tennessee, Knoxville, TN 37996, USA
2Air Force Research Laboratory (AFRL/RQQE), Wright-Patterson AFB, Dayton,
OH 45433-7919, USA
were shown to initiate breakdown across gap lengths of several centimeters [18,19]. The previous works con-cluded that the sand and dust particles in the inter-electrode gap played a negligible role in the volume processes during breakdown; however, the formation of a thin contaminant layer on the cathode enhanced sec-ondary electron emission and significantly reduced the breakdown voltage in some circumstances. Other works have shown that larger (100 s of microns to 100 s mms) conductive particles in an inter-electrode air gap can play a significant role in reducing breakdown voltage, time-lag of impulses, and breakdown probability [20-22]. These previous works have concluded that the degree of influence that the solid particles have on the breakdown process depends on both the discharge properties, namely polarity and field uniformity, as well as properties of the particles such as conductivity, shape, size, concentration, and position relative to the electrodes.
In this study, aluminum and iron nanoparticles were seeded into a DC microdischarge at a very low flow speed. Experimental results indicate that breakdown thresholds of dry air with nanoparticle seeding were sig-nificantly reduced compared to standard Paschen law. High-speed chemiluminescence images reveal that the nanoparticles had a major influence in inducing break-down and subsequent heating that eventually ignited the nanoparticles.
Methods
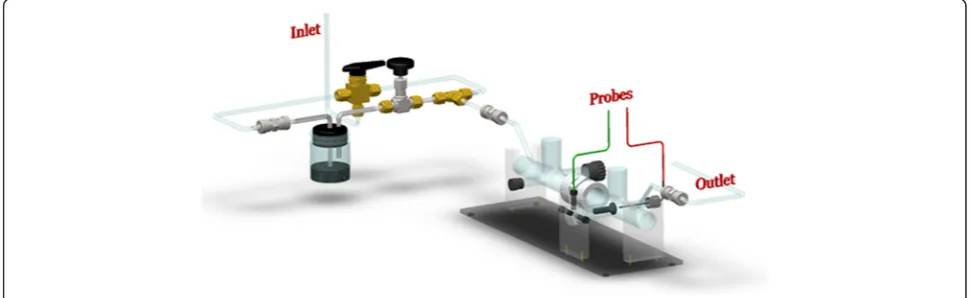
The experimental setup consisted of three major compo-nents: 1) a microdischarge cell with a gas and particle handling system that produces a DC microdischarge either with or without nanoparticle seeding, 2) a high-voltage power supply, high-voltage probes, and data acquisition systems, and 3) a high-speed camera for luminosity mea-surements. In Figure 1, a home-made glass cell (inner diameter = 1 in.) was equipped with two adjustable elec-trodes. The cathode was a circular aluminum plate while the anode was a stainless steel needle oriented orthogonally
to the circular plane of the cathode. The cathode was at-tached to the head of a micrometer so that its position relative to the anode could be accurately controlled. The distance between the two electrodes was set to roughly zero as verified by measuring the resistance across the gap with a multimeter. The gap between the electrodes could be determined accurately down to a 0.03 mm resolution.
A custom-made particle seeder, which included a par-ticle container, inlet and outlet tubes, was used to seed the flow with various nanoenergetic materials. Mass measure-ments, before and after each run, were used to estimate the particle flow rates. Usually about 5 g of aluminum or iron nanoenergetics (nominal diameters of 70 nm, pur-chased from NanoAmor Inc., Houston, USA, without fur-ther treatment) were placed along the flow path inside the particle container. The particle seeder inlet tube was sub-merged below the surface of the piles to generate particle suspensions inside the container. The height of the inlet and outlet were offset to ensure roughly uniform seeding in the flow through the discharge tube. Standard breathing dry air was used as the gas supply. A flow controller (FMA 5400, Omega, Stamford, USA) regulated the flow rate in the system to 1 ± 0.1 standard liters per minute (slpm). A three-way valve allowed the flow to be switched between the nanoparticle seeder and a bypass line. If par-ticle seeding was desired, the three-way valve and needle valve were opened to allow flow through the seeder. Otherwise, the three-way valve and needle valve were closed to isolate the particle seeder. The pressure in the system was monitored downstream of the cell by a piezoelectric pressure sensor (Series 910, Kurt J. Lesker Company, Jefferson Hills, USA), and the desired pres-sure was obtained by adjusting the needle valve up-stream of the vacuum pump.
[image:2.595.55.541.567.716.2]The high-voltage system included a high-voltage power supply, high-voltage probes, and data acquisition systems. The output of the high-voltage power supply was controlled via Labview™ software on a personal computer. The positive terminal was connected to a 1 M
Ω ballast resistor used to limit the current through the discharge circuit. When a sufficient positive voltage was applied to the anode, breakdown occurred within the air between the two electrodes, with the resulting current spike traveling through the circuit to the grounded cath-ode. The supply voltage was linearly increased until breakdown was achieved. Two high-voltage probes were used to monitor the voltage drop across the electrode gap and across the ballast resistor. The voltage drop across the electrode gap,V1, was determined directly by
measuring the potential at junctions before the anode and after the cathode. The current in the system was ob-tained by measuring the potential drop across the ballast resistor and electrode gap sequentially. The total applied potential across the ballast and gap could be expressed as V2=V1+VR. Rearranging and dividing by the
resist-ance of the ballast resistor, R, the current in the circuit was determined by Ohm's Law to beI= (V2−V1)/R.
A high-speed camera (HS1200, Cooke Corporation, Kelheim, Germany) was used to track the chemilumines-cence from the plasma initiation and nanoparticle ignition events. The 2D chemiluminescence images were acquired with a 1 ms exposure time. Because of the nature of the volume-averaged chemiluminescence images, the mea-surements can be regarded as an average over the line of sight across the discharge.
Results and discussions
Figure 2 shows a comparison between theoretical Paschen curves for ‘clean’dry air and experimental measurements in air with and without Al and Fe nanoparticle seeding. Measurements of the breakdown voltage of the‘clean’dry air were taken for a 1-mm gap distance with varying pres-sures of 200 to 400 Torr. For the dry air case, as seen in Figure 2, a maximum error of less than 12% was observed between theoretical and experimental breakdown voltages. Breakdown voltages for the dry air with nanoparticle seed-ing were experimentally determined for the 20 to 40 Torr-cm range. The experiment was performed with aluminum and iron nanoparticles with mean diameters of 80 and 75 nm, respectively. The number density flow rate of the nanoparticles had an upper bound of 1 × 1010 cm−3 s−1 during the course of the experiment. The breakdown threshold values for all three curves appear to coalesce at the lower PD scaling close to 20 Torr-cm; however, the experimental data diverge from the theoretical values with increasing PD up to 40 Torr-cm. This situation is most commonly due to uncertainty in the secondary ionization coefficient of the cathode. It is clearly seen that nanoparti-cle seeding resulted in a reduction in the breakdown volt-age for the entire 20 to 40 Torr-cm range. However, at lower PD values, nanoparticle seeding appeared to cause only a slightly reduced breakdown threshold of a few per-cent compared to the‘clean’dry air case. On the contrary,
at larger PD values, a more significant reduction in the breakdown voltage, approaching 25%, was apparent with nanoparticle seeding. In Figure 2 a general upward trend is seen in the percentage reduction for increasing PDfor the 20 to 40 Torr-cm range. Seeding with Al nanoparticles consistently has a lower breakdown threshold compared to seeding with Fe nanoparticles. This may be due to the difference in electrical conductivity of the particles. Add-itionally, iron nanoparticles have been shown to have lar-ger more porous oxidation layers which may negatively impact charging of the nanoparticles [23]. Mild day to day variations were seen in the experimental breakdown volt-ages most likely due to changes in the electrode surfaces
(a)
(b)
20 25 30 35 40
1.6 1.8 2.0 2.2 2.4 2.6 2.8 3.0
Breakdown Voltage (kV)
PD (Torr-cm) Theoretical air Paschen curve Air
Iron nanoparticles in air Aluminum nanoparticles in air
20 25 30 35 40
0 5 10 15 20 25 30
Iron nanoparticles in air Aluminum nanoparticles in air
% Reduction in Breakdown Voltage
[image:3.595.305.539.88.482.2]PD (Torr-cm)
over time despite rigorous efforts in polishing and clean-ing; however, the abovementioned trends were consist-ently preserved.
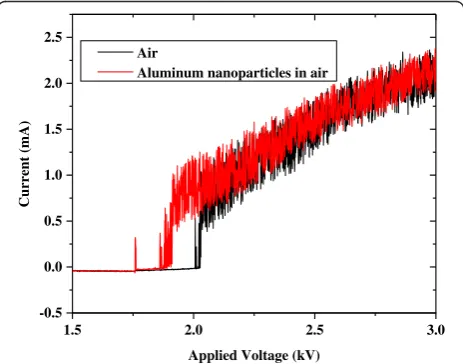
Figure 3 shows a typical plot of the discharge current as the applied voltage was gradually increased, both with and without Al nanoparticle seeding. Initially, in both cases, there is negligible current in the circuit prior to breakdown. Without nanoparticle seeding, there is an al-most immediate sharp increase in current at the break-down voltage. With nanoparticle seeding, short-lived instabilities manifest as peaks in current just prior to breakdown. A slightly elevated current is present as well in the instability region. Once the breakdown threshold was reached in each discharge, there was negligible dif-ference in current at similar applied voltages. Similar properties are shown for the measured gap voltage, with and without aluminum nanoparticle seeding, as shown in Figure 4. Without nanoparticle seeding, there is a sharp decrease in voltage across the gap at the break-down voltage. For the case with nanoparticle seeding, in-stabilities appear as dips in the voltage just prior to breakdown. Once the breakdown threshold is reached, it is apparent from the two plots that the nanoparticle seeding causes negligible change to conductivity of the sustained discharge.
Figure 5 shows high speed images of the discharge gap taken during the breakdown process with a resolution of 2 ms between frames. Analysis of these images revealed that the breakdown occurs within the first 2 ms of apply-ing the voltage. Ignition of the nanoparticles due to ther-mal effects was observed at 4 ms. It was confirmed that breakdown always occurs before the ignition of metal nanoparticles at various conditions. The delay between gas breakdown and the ignition of the nanoparticles varied. In conditions at pressures close to atmosphere and/or larger
electrode separations, the thermal ignition of the nanopar-ticles was both more abundant and less delayed from the breakdown, which was likely due to the higher tempera-tures under those conditions. Overall, the nanoparticles first acted to reduce the voltage threshold required for gas breakdown. Subsequently the discharge ignited some of the particles between electrodes.
Figure 6 shows scanning electron microscope (SEM) images and statistical analyses of particle sizes from sam-ples of the nanoparticles used in this study. Both the aluminum and iron nanoparticle samples appeared to have Gaussian distributions; however, the mean size of the aluminum nanoparticles is a bit smaller due to the thinner oxidized shell and lower degree of agglomer-ation. Such ex situdiagnostic techniques could be used to build empirical correlations between reduction in breakdown voltage and characteristics of the particles such as size, shape, and degree of oxidation.
Based on the experimental observations, the mecha-nisms for reducing the breakdown threshold may be due to possible charging of the nanoparticles within the gap, which may reduce the effective distance. Since the current across the gap does not vary with and without nanoparticle seeding, the increased conductivity due to the presence of metal nanoparticles is small. Additionally nanoparticles do not start to combust before the break-down. The Joule heating due to the presence of metal nanoparticles is slow compared to breakdown generation. However, evidence of charging of the metal nanoparticles within the gap has been observed in these experiments. For example in Figure 5, the attraction of the nanoparti-cles to the cathode and the subsequent ignition near the cathode region indicate that the nanoparticles were posi-tively charged. In addition, the chemiluminescence image at 2 ms shows a brighter glow near the cathode, which
1.5 2.0 2.5 3.0
-0.5 0.0 0.5 1.0 1.5 2.0 2.5
Current (mA)
Applied Voltage (kV) Air
[image:4.595.306.538.89.268.2]Aluminum nanoparticles in air
Figure 3Discharge current versus applied voltage with and without seeding of aluminum nanoparticles at PD = 25 Torr-cm.
0.0 0.5 1.0 1.5 2.0 2.5 3.0 0.0
0.5 1.0 1.5 2.0 2.5
Gap Voltage (kV)
Applied Voltage (kV) Air
Aluminum nanoparticles in air
[image:4.595.58.290.523.705.2]suggests that the evolution of the breakdown started from anode and turned toward the cathode. The nanoparticles charging and shifting toward the cathode might allow the nanoparticles to serve as effective electrodes within the gap, which could mimic a reduction in the gap distance. It
[image:5.595.59.541.89.234.2]is speculated that the Paschen curve may still hold for the particle laden flow with the addition of the conducting nanoparticles near the cathode leading to an effective reduction in distance between the electrodes, i.e., the PDvalues on the x axis are reduced.
Figure 5High-speed chemiluminescence images of breakdown in a 3.5-mm gap in atmospheric air.
0 50 100 150 200 250
0 5 10 15
Particle Size (nm)
Co
u
n
t
0 50 100 150 200 250
0 5 10 15
Particle Size (nm)
Co
u
n
t
a
c
d
b
[image:5.595.60.540.335.705.2]Conclusions
In this work, the seeding of metal nanoparticles was shown to reduce the voltage required to initiate break-down in an air DC microdischarge. Reductions in the breakdown voltage were seen to be as high as 25% for a PD scaling of 40 Torr-cm. High-speed chemilumines-cence imaging of the discharge region revealed that the breakdown process was enhanced by a reduction in the required voltage from nanoparticle seeding, and then heating from the discharge led to ignition of some of the nanoparticles as they flowed through the discharge re-gion. The use of SEM imaging gave detailed information regarding the particle size, shape, and oxidation distribu-tions. Further use ofex situ diagnostic techniques, such as SEM analyses, could allow for the development of empirical correlations between particle characteristics and reduction in the breakdown voltage. Visual evidence of particle charging being the most likely mechanism for breakdown voltage reduction and subsequent reduction of the effective distance between the electrodes has been presented.
Competing interests
The authors declare that they have no competing interests.
Authors’contributions
JS and JA conducted the experiments. ZZ and SA designed the experiments. All authors participate in the preparation of the manuscript. All authors read and approved the final manuscript.
Acknowledgements
We acknowledge support from the AFOSR and NSF CBET - 1346944.
Received: 20 October 2014 Accepted: 23 December 2014
References
1. Townsend J. Electricity in gases. Oxford: Clarendon; 1915. 2. Paschen F. Ueber die zum Funkenübergang in Luft, Wasserstoff und
Kohlensäure bei verschiedenen Drucken erforderliche Potentialdifferenz. Ann Phys. 1889;273:69–96.
3. Foest R, Schmidt M, Becker K. Microplasmas, an emerging field of low-temperature plasma science and technology. Int J Mass Spectrom. 2006;248:87–102.
4. Sawyer J, Wu Y, Zhang Z, Adams SF. O2 rotational temperature measurements in an atmospheric air microdischarge by radar resonance-enhanced multiphoton ionization. J Appl Phys. 2013;113:233304.
5. Laux CO, Spence TG, Kruger CH, Zare RN. Optical diagnostics of atmospheric pressure air plasmas. Plasma Sources Sci Technol. 2003;12:125. 6. Ren'an B, Mingdong S, Zhongrui W, Jing J, Wenbo H, Feng Q, et al.
Development of 146 nm vacuum UV light source. Phys Procedia. 2012;32:477–81.
7. Goree J, Bin L, Drake D, Stoffels E. Killing of S. mutans bacteria using a plasma needle at atmospheric pressure. Plasma Sci IEEE Trans. 2006;34:1317–24.
8. Kim JY, Wei Y, Li J, Kim S-O. 15-μm-sized single-cellular-level and cell-manipulatable microplasma jet in cancer therapies. Biosens Bioelectron. 2010;26:555–9. 9. Chiang W-H, Sankaran RM. Microplasma synthesis of metal nanoparticles for
gas-phase studies of catalyzed carbon nanotube growth. Appl Phys Lett. 2007;91:121503–3.
10. Richmonds C, Sankaran RM. Plasma-liquid electrochemistry: rapid synthesis of colloidal metal nanoparticles by microplasma reduction of aqueous cations. Appl Phys Lett. 2008;93:131501–3.
11. Pancheshnyi SV, Lacoste DA, Bourdon A, Laux CO. Ignition of propane-air mixtures by a repetitively pulsed nanosecond discharge. Plasma Sci IEEE Trans. 2006;34:2478–87.
12. Frechette MF, Bouchelouh N, Larocque RY. Laser-induced undervoltage breakdown in atmospheric N2correlated with time-resolved avalanches. In: Electrical insulation, 1994, Conference Record of the 1994 IEEE International Symposium on; 5–8 Jun 1994. 1994. p. 515–7.
13. Kluckow R. Über den zeitlichen Verlauf des Stromes einer Gasentladung in Wasserstoff. Z Physik. 1961;161:353–69.
14. Varney RN. Liberation of electrons by positive-ion impact on the cathode of a pulsed Townsend discharge tube. Phys Rev. 1954;93:1156–60.
15. Cooley JE, Choueiri EY. Threshold criteria for undervoltage breakdown. J Appl Phys. 2008;103:093305.
16. Cooley JE. Fundamentals of undervoltage breakdown through the Townsend mechanism. 2008
17. Hong T, Scuka V. The breakdown mechanism of a mid-plane triggered spark gap trigatron. Dielectrics Electric Insulation IEEE Trans. 1996;3:843–8. 18. Al-Arainy AA. The influence of dust particles on the DC breakdown voltage
of rod-rod air gaps. In: Electrical Insulating Materials, 1995 International Symposium on; 17–20 Sep 1995. 1995. p. 303–6.
19. Al-Arainy AA, Malik NH, Qureshi MI. Influence of sand/dust contamination on the breakdown of asymmetrical air gaps under lightning impulses. Electric Insulation IEEE Trans. 1992;27:193–206.
20. Kubuki M, Yoshimoto R, Yoshizumi K, Tsuru S, Hara M. Estimation of DC breakdown mechanisms in air gaps containing floating metallic particles. Dielectrics Electric Insulation IEEE Trans. 1997;4:92–101.
21. Hara M, Akazaki M. A method for prediction of gaseous discharge threshold voltage in the presence of a conducting particle. J Electrostat. 1977;2:223–39. 22. Hara M, Negara Y, Setoguchi M, Kurihara T, Suehiro J, Haashi N.
Particle-triggered pre-breakdown phenomena in atmospheric air gap under AC voltage. Dielectrics Electric Insulation IEEE Trans. 2005;12:1071–81. 23. Chong X, Abboud J, Zhang Z. Plasmonics resonance enhanced active
photothermal effects of aluminum and iron nanoparticles. J Nanosci Nanotechnol. 2015;15:2234–40.
Submit your manuscript to a
journal and benefi t from:
7Convenient online submission
7Rigorous peer review
7Immediate publication on acceptance
7Open access: articles freely available online
7High visibility within the fi eld
7Retaining the copyright to your article