TABLE RECOGNITION IN MATHEMATICAL
DOCUMENTS
by
MOHAMED A. ALKALAI
A thesis submitted to
The University of Birmingham
for the degree of
DOCTOR OF PHILOSOPHY
School of Computer Science
College of Engineering and Physical Sciences
The University of Birmingham
University of Birmingham Research Archive
e-theses repositoryThis unpublished thesis/dissertation is copyright of the author and/or third parties. The intellectual property rights of the author or third parties in respect of this work are as defined by The Copyright Designs and Patents Act 1988 or as modified by any successor legislation.
Any use made of information contained in this thesis/dissertation must be in accordance with that legislation and must be properly acknowledged. Further distribution or reproduction in any format is prohibited without the permission of the copyright holder.
Abstract
While a number of techniques have been developed for table recognition in ordinary text documents, when dealing with tables in mathematical documents these techniques are of-ten ineffective as tables containing mathematical structures can differ quite significantly from ordinary text tables. In fact, it is even difficult to clearly distinguish table recog-nition in mathematics from layout analysis of mathematical formulas. Again, it is not straight forward to adapt general layout analysis techniques for mathematical formulas. However, a reliable understanding of formula layout is often a necessary prerequisite to further semantic interpretation of the represented formulae.
In this thesis, we present the necessary preprocessing steps towards a table recognition technique that specialises on tables in mathematical documents. It is based on our novel robust line recognition technique for mathematical expressions, which is fully independent of understanding the content or specialist fonts of expressions.
We also present a graph representation for complex mathematical table structures. A set of rewriting rules applied to the graph allows for reliable re-composition of cells in order to identify several valid table interpretations. We demonstrate the effectiveness of our technique by applying them to a set of mathematical tables from standard text book that has been manually ground-truthed.
ACKNOWLEDGEMENTS
I first would like to express my appreciation to my supervisors, Dr. Mark Lee and Prof. Jonathan Rowe for supporting and encouraging me. Completing this thesis would not have been possible without their guidance.
I also wish to thank my parents for believing in me and encouraging me reach my goals. Indeed, life would be very difficult without their unlimited support.
I would also like to express the honest appreciation to my wife, Ghada, who stands behind me and whose her help allowed me to accomplish this task, already has my heart so I will just give her a heartfelt “thanks.”
Finally, to my sons and daughter, Ali, Omar, Abdalla and Amna who make my life easier by their innocent smiles.
CONTENTS
1 Introduction 1
1.1 Interpretations of Mathematical Table . . . 2
1.2 Research questions . . . 4 1.3 Contributions . . . 5 1.4 Publications . . . 6 1.5 Overview of Thesis . . . 7
I
Background
9
2 Literature Review 10 2.1 Issues in table structure recognition . . . 112.2 Document structural analysis . . . 11
2.3 Table analysis . . . 12
2.4 Methods used in table syntactic recognition . . . 13
2.5 Standard line/cell segmentation techniques . . . 14
2.5.1 Smearing approaches . . . 14
2.5.2 Projection Profile Cuts (PPC) . . . 15
2.5.3 Grouping approaches . . . 18
2.5.4 Hough transform approaches . . . 19
2.6 Mathematical expressions segmentation . . . 20
2.6.1 Mathematical expression segmentation in images . . . 20
2.7 Unsolved issues concerning the detection of lines containing mathematical
expressions . . . 22
2.8 Existing table segmentation methods . . . 22
2.8.1 Projection-profile approaches . . . 22
2.8.2 Heuristic approaches . . . 23
2.8.3 Grouping approaches . . . 24
2.8.4 Advanced approaches . . . 25
2.9 Existing table segmentation techniques for PDF/Postscript . . . 26
2.10 Unsolved issues concerning the segmentation of tables into cells . . . 27
2.11 Table representation techniques . . . 28
2.12 Models to represent tables . . . 29
2.12.1 Tree models . . . 29
2.12.2 Dual hierarchy models . . . 30
2.12.3 The CALS model . . . 31
2.12.4 Graph model: Amano and Asada’s model . . . 32
2.13 Unsolved issues concerning the representation of table structure . . . 35
2.14 Summary . . . 36
II
Preprocessing Steps Toward A Robust Mathematical
Ta-ble Recognition
37
3 A Novel Histogrammatic Approach to Line Segmentation 38 3.1 The approach at a glance . . . 393.2 Experimental Results and Discussion . . . 55
3.2.1 Incorrect Non-principal Lines: . . . 61
3.2.2 Incorrect Principal Lines: . . . 61
3.3 Evaluation of integrating my line segmentation technique with MaxTract . 62 3.4 Summary . . . 64
4 Towards Full Cell Recognition 65
4.1 Table Column Extraction . . . 67
4.1.1 Example . . . 69
4.1.2 Determining V value . . . 69
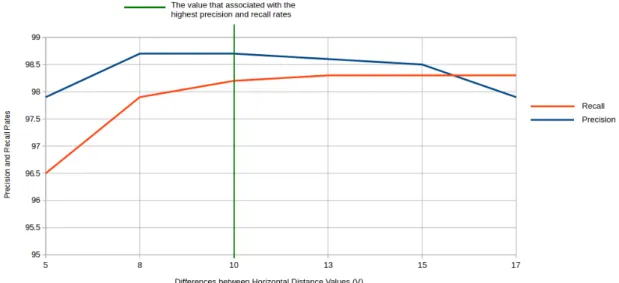
4.2 Evaluation and Experimental Results . . . 72
4.3 Summary . . . 74
III
Table Recognition
76
5 Recognising Tabular Mathematical Expressions using Graph Rewriting 77 5.1 Multi-Interpretations of Table’s Re-composition . . . 785.1.1 Preprocessing Steps . . . 78
5.1.2 Tabular Representation Using Graph Model . . . 82
5.1.3 Construct Initial Graph (Example) . . . 85
6 First Method: Direct rewriting of the initial graph 87 6.1 Graph rewriting system . . . 87
6.1.1 Table Production Rules . . . 89
6.1.2 Number of rules needed to cover any node combinations . . . 90
6.1.3 Recognizing Rows Using Virtual Nodes . . . 92
6.2 A Framework For Choosing Column Combinations . . . 94
6.2.1 Number of possible column combinations . . . 94
6.3 Summary . . . 96
7 Evaluation of the first tabular recognition method 99 7.1 Applying the rewriting system on a table . . . 99
7.2 Experimental Results . . . 104
7.2.1 Analysis of table interpretations that are partially extracted or missed105 7.2.2 Table Re-composition: within documents . . . 107
7.3 Summary . . . 109
8 Second Method: Pre-process rewriting on the initial graph 110 8.1 Introduction . . . 110
8.2 Types of spatial relationships between cells . . . 110
8.2.1 Experiments . . . 116
8.3 Graph Rewriting System . . . 117
8.3.1 Graph representation model . . . 117
8.3.2 Graph rewriting rules . . . 117
8.4 Table structure analysis . . . 125
8.4.1 Apply these rules (example) . . . 126
8.5 Summary . . . 130
9 Evaluation of the second tabular recognition method 132 9.1 More experiments . . . 134
9.1.1 No need of constraints . . . 135
9.1.2 Experimental results . . . 135
9.2 Summary . . . 138
10 Conclusions and future work 139 10.1 Contributions . . . 139
10.1.1 Mathematical line segmentation . . . 139
10.1.2 Cell segmentation . . . 140
10.1.3 First table interpretation method . . . 140
10.1.4 Second table interpretation method . . . 140
10.2 Future Work . . . 141
10.2.1 Improving cells segmentation technique . . . 141
10.2.2 Automatic selecting of rewriting rules for different interpretations of table structure . . . 142
IV
Appendixes
143
.0.3 An example of constraints associate with each rule . . . 155
LIST OF FIGURES
1.1 Cell identification with tables (taken from [Grad 07]) containing multi-line
expressions. . . 3
1.2 Two different interpretations of a single table (taken from [Grad 07]). . . . 4
2.1 An example of Smearing’s drawback. . . 16
2.2 A Statistical table. . . 17
2.3 An example of PPC applied to the table in figure 2.2 . . . 18
2.4 An example of PPC’s drawback. . . 19
2.5 Examples of displayed and embedded mathematical expressions which is taken from [Stro 11] . . . 21
2.6 A table (taken from [Silv 06]) most segmentation algorithms would not process accurately . . . 28
2.7 Table used for describing the work of the x-y cut algorithm . . . 30
2.8 The table cells in Figure 2.7 represented by x-y tree . . . 30
2.9 Example of table used in illustrating CALS representation model . . . 32
2.10 Cells that are totally and vertically overlapped . . . 33
2.11 Cell’s y-axis borders within other cell’s y-axis borders . . . 33
2.12 Cells that are totally and horizontally overlapped . . . 34
2.13 Cell’s x-axis borders within other cell’s x-axis borders . . . 34
2.14 Cells that are partially and horizontally overlapped . . . 35
2.15 Example for table representation model (taken from [Grad 07]) . . . 35
3.1 Examples (taken from [Grad 07]) of glyph’s bounding boxes and vertical and horizontal overlaps. . . 41 3.2 Examples of a line (taken from [Grad 07]) . . . 42 3.3 Examples of different types of lines overlapping (taken from [Grad 07]) . . 43 3.4 Example of horizontal overlap glyphs that both vertically overlap with one
glyph . . . 44 3.5 Example of horizontal overlap glyphs that are conveyed one symbol . . . . 44 3.6 (a) illustrates an example (taken from [Grad 07]) of compound line contains
two horizontal overlap lines and a separator. (b) shows the resulting two lines . . . 46 3.7 Examples (taken from [Deni 11]) of pages and their histogram of the gap
between glyphs . . . 49 3.8 Examples of principal and non-principal lines (taken from [Grad 07]) . . . 49 3.9 An example of lines (taken from [Deni 11]) are wrongly classified as
non-principal . . . 51 3.10 An example of lines (taken from [Deni 11]) are wrongly classified as principal 51 3.11 An example of merging lines process (taken from [Deni 11]) . . . 55 3.12 The results of running our technique over 200 pages with different (T) . . . 58 4.1 Tables (taken from [Grad 07]) with mathematical expressions before
ap-plying the Kieninger’s algorithm. . . 66 4.2 The results of applying Kieninger’s algorithm. . . 67 4.3 The results of running our technique over 200 pages with different (V) . . . 70 4.4 Ideal segmentation output of both table 1 and table 2 in figure (4.1) . . . . 72 4.5 An example of a classified page from [Grad 07]. . . 73 4.6 examples of a case of errors in (a) and a case of correctness in (b) . . . 75 5.1 Cell identification with table containing multiline expressions that is taken
5.2 Sorted cells of the table in figure 5.1 . . . 81
5.3 Examples of virtual cells which their borders appear to be bigger . . . 81
5.4 Initial columns of the table in figure 5.1 . . . 82
5.5 Initial columns of the table in figure 5.1 after adding the virtual cells . . . 82
5.6 A graph represents one of the possible interpretations of the table’s columns shown in the table in Fig 5.1 . . . 86
6.1 Example of production rule . . . 88
6.2 Full production rules . . . 89
6.3 Some examples of how to applying the rewriting rules . . . 91
6.4 production rules with n= 2 . . . 93
6.5 An example of how to applying the rewriting rules with two nodes . . . 93
6.6 A graph represents one of the possible interpretations of the table’s rows shown in the table in Fig 5.1 . . . 94
6.7 Example (taken from [Grad 07]) to show how the framework for choosing column combinations works . . . 95
6.8 Examples of table (taken from [Grad 07]) output-part1 . . . 97
6.9 Examples of table (taken from [Grad 07]) output-part2 . . . 98
7.1 Examples of cells are not horizontally overlapped where they should be . . 100
7.2 Examples of elusive empty cells . . . 100
7.3 The initial graph representation of the table in figure 6.9(c) . . . 102
7.4 The first nodes to be rewritten . . . 102
7.5 The example table after the first rewriting step is accomplished . . . 103
7.6 The example table after the rewriting process is accomplished . . . 103
7.7 Example of table (taken from [Grad 07]) re-composition (a) before manual intervention (b) after manual intervention . . . 106
7.8 (a) Isolated table (taken from [Grad 07]), (b) The same table but main-tained in its page . . . 107
7.9 (a) Isolated table (taken from [Grad 07]), (b) The same table but combined
with other table . . . 108
8.1 Different arrows represent different relationships between cells . . . 111
8.2 Cells that are internally and vertically overlapped . . . 112
8.3 Cells that are totally and vertically overlapped . . . 112
8.4 Cells that are centrally and vertically overlapped . . . 113
8.5 Cells that are partially and vertically overlapped . . . 113
8.6 Cells that are sided and vertically overlapped . . . 114
8.7 Cells that are internally and horizontally overlapped . . . 114
8.8 Cells that are fully and horizontally overlapped . . . 115
8.9 Cells that are centrally and horizontally overlapped . . . 115
8.10 Cells that are partially and horizontally overlapped . . . 116
8.11 Cells that are sided and horizontally overlapped . . . 116
8.12 Example for table representation model . . . 118
8.13 The graph representation of the table in figure 8.12 . . . 119
8.14 Rule One . . . 120
8.15 Rule Two . . . 124
8.16 Rule Three . . . 125
8.17 An example of columns that have not been correctly split . . . 127
8.18 How the rewriting Process starts . . . 128
8.19 The targeted nodes for rewriting . . . 129
8.20 After the first rewriting took place . . . 129
8.21 The targeted nodes for the second rewriting . . . 130
8.22 After the second rewriting took place . . . 130
8.23 After the final rewriting took place . . . 131
9.1 First method: After the final rewriting took place . . . 137
10.1 An example of table which is taken from [Grad 07] shows failure of cells segmentation . . . 141 2 Rule Four . . . 145 3 Rule Five . . . 147 4 Rule Six . . . 149 5 Rule Seven . . . 151 6 Rule Eight . . . 152 7 Rule Nine . . . 154
8 table which is taken from [Grad 07]: example . . . 157
9 A graph represents table which is taken from [Grad 07] . . . 158
10 Possible interpretation of a table which is taken from [Grad 07] . . . 158
11 First rewriting of the graph that represents a table which is taken from [Grad 07]159 12 Final result of rewriting the graph that represents a table which is taken from [Grad 07] . . . 160
LIST OF TABLES
3.1 Results for vertical splitting. . . 57
3.2 Experimental results for line recognition. . . 59
3.3 Experimental results of 1000 pages. . . 60
3.4 Evaluation results of 1000 pages. . . 60
3.5 Comparison of previously generated and new LATEX . . . 63
4.1 Experimental results for cell recognition. . . 74
4.2 Experimental results of running our technique over 994 pages . . . 74
5.1 Type of nodes. . . 85
6.1 The binary representation and their corresponding V∗ and R∗. . . 92
6.2 All possible table column combinations . . . 95
6.3 Final result of all possible table column combinations . . . 96
7.1 Results of applying the proposed table interpretation technique on 150 tables105 7.2 Results of applying the proposed table interpretation technique on 110 tables105 7.3 Table Re-composition: within documents . . . 109
7.4 Table Re-composition: combining tables . . . 109
8.1 Statistics of horizontal overlap relationships . . . 117
8.2 Statistics of vertical overlap relationships . . . 117 9.1 Results of applying the proposed table interpretation technique on 150 tables134 9.2 Results of applying the proposed table interpretation technique on 110 tables134
9.3 Results of applying the proposed table interpretation technique on 150 ICDAR tables . . . 136
CHAPTER 1
INTRODUCTION
Table recognition is a research case within document analysis that has attracted much attention over the years. Our aim is to develop a table recognition algorithm that is particularly good for tables containing mathematical expressions. As the distinction be-tween tables and complex typeset mathematical formulas spanning multiple lines is often difficult, we forgo a narrow definition of table and instead consider a far wider range of expressions as tables than is usually the case in the literature [Grad 07].
There is no a standard convention of composing table. As a consequence, various structures of table are noticed in wide range of documents which include fully-bordered table, partially-bordered table and no-bordered table. Based on this fact, the proposed table recognition technique designed to deals with tables that have all of their ruling lines (if any) removed. So that, it can be applied on vast types of table.
The tabular form in which many mathematical expressions are presented can often lead to ambiguities in the interpretation of what essentially constitutes a table component (i.e., a column, row or cell). While in understanding of ordinary text tables the goal is generally to restrict a result to a single valid interpretation, for mathematical tables these ambiguities can lead to several perfectly acceptable interpretations. Therefore, the aim of our recognition procedure is to produce as a result a number of possible interpretations.
Our approach to the problem is in two steps: First we design an algorithm that enables the separation and detection of lines in mathematical documents. This is a non-trivial task since, contrary to ordinary text, simple line separation by vertical whitespace does not suffice, due to the two-dimensional nature of mathematical formulas. The procedure uses simple yet effective spatial means and serves as a basis of a cell detection algorithm. This algorithm builds on some of the same spatial measures as line detection.
In the second step, these two methods work as a basis of a table representation algo-rithm which ultimately lead to the full-fledged table recognition algoalgo-rithm. In the next section we will discuss some examples to further motivate our problem. It is worth to mention that we do not use any character information or OCR information other than bounding boxes of connected components in any of the proposed techniques.
1.1
Interpretations of Mathematical Table
The boundary of what constitutes a mathematical table and what is a complex formula given in a tabular presentation is quite fluid. While some tables, for example Cayley tables in abstract algebra, are quite straight forward to recognise due to their easy tab-ular composition and sometimes clear separation of rows and columns with bars, this is generally not the case. In fact, the common absence of any vertical or horizontal bars as well as the complexity of formulas often spanning multiple lines make it not only difficult to identify the cell structure but can lead to a number of different interpretations for the same table, which are often equally valid.
Figure 1.1 presents two tables taken from [Grad 07] with a fairly conservative column and row layout. There is indeed a unique ideal interpretation for Table 1, consisting of two columns and three rows, where the cell in the lower right hand corner contains a
Figure 1.1: Cell identification with tables (taken from [Grad 07]) containing multi-line expressions.
mathematical expression spanning two lines. And given the difference in font weights, one could even interpret the first line as a clear header row.
Table 2 in Fig. 1.1 is slightly less straight forward given the overlapping expressions in the second line. However, one can still come up with a unique interpretation of five rows and three columns. But it already becomes obvious that due to the overlap for formulas as well as the condition formulas which are effectively in a column of their own this interpretation is not so easy to obtain automatically.
Figure 1.2 presents a clipping from a more complex table also taken from [Grad 07]. Here we can already see two different interpretations, both with their own merits. While
Figure 1.2: Two different interpretations of a single table (taken from [Grad 07]).
both interpretations regard the basic table as consisting of four columns, the first in-terpretation results in three rows, using the formula names on the right hand side as a header column. The second interpretation on the other hand uses the enumeration in the first column as the header. Obviously there are still more interpretations: for example, one with three columns with the middle column containing complex formulas or even one with only two columns, where the right column contains named multi-line formulas that possibly can even be considered as subtables.
1.2
Research questions
Recognizing tables with mathematical expressions imposes several interesting research questions. For instance, mathematical expressions usually have a 2-dimensional structure which is sometimes spread over more than one line. This can lead current table segmenta-tion methods for regular text to erroneous results by mistaking casual vertical space that appears within one formula as row delimiters. Therefore, observing to what extent the adaptation of existing table extraction techniques could handle tables with
mathemati-cal expressions is an interesting research question. However, due to the lack of sufficient formal definitions of the different components that compose these techniques, it is very difficult if not impossible to implement them [Zani 05]. Therefore, an analysis of these methods and inferring their shortcomings when they are to be applied on tables contain mathematical expressions and then develop techniques to deal with these shortcomings would be also an interesting research question on its own.
Another important research question concerns the fact that tables which can contain cells spanning multiple rows or columns as well might even contain a nested table in one of its cells. In tables containing mathematical expressions these distinctions can easily become blurred, which can lead to having more than one possible, equally legitimate, in-terpretation of the table form. Figure 1.2 shows two different inin-terpretations of one table. This not only gives rise to the problem of finding a method that can yield a number of equally acceptable interpretations, but also the need to find an adequate grid structure to represent such tables holding the different interpretations and to give a means to re-compose the recognised cells. Therefore, developing a framework that is able to tackle this issue as well as the misaligned cells problem which commonly appears in such tables is another interesting question.
1.3
Contributions
A summary of the contributions of this thesis is as follows;
1. We describe a novel technique that reliably identifies lines in mathematical docu-ments. This is challenging as standard line detection techniques for regular text using vertical cuts along consecutive whitespace break down in the light of mathe-matical expressions (e.g., limits of sums, integrals).
2. This forms the basis of a row and column segmentation method to produce the maximum number of identifiable cells.
3. We also describe two alternative novel methods to identify several acceptable table interpretations and a representation that will allow for the recomposition of cells. 4. We show an evaluation of the effectiveness of these techniques by putting together
a ground truth set of representative documents for case studies.
1.4
Publications
This thesis is based partly upon the following conference and workshop publications:
• Mohamed Alkalai and Volker Sorge, “Issues in mathematical table recognition”, International Conferences on Intelligent Computer Mathematics (CICM 2012), MIR Workshop, 2012. [Alka 12] (presented as chapters 1, 3 and 4 in the current thesis).
• Mohamed Alkalai, Josef B. Baker, Volker Sorge and Xiaoyan Lin, “Improving Formula Analysis with Line and Mathematics Identification”, International Confer-ence on Document Analysis and Recognition (ICDAR 2013). [Alka 13b] (presented as chapter 3 in the current thesis).
• Xiaoyan Lin, Liangcai Gao, Zhi Tang, Josef Baker, Mohamed Alkalaiand Volker Sorge, “A Text Line Detection Method for Mathematical Formula Recognition”, In-ternational Conference on Document Analysis and Recognition (ICDAR 2013). [Lin 13]
• Mohamed Alkalaiand Volker Sorge, “A Histogram-based Approach to Mathemat-ical Line Segmentation”, Iberoamerican Congress on Pattern Recognition (CIARP 2013). [Alka 13c] (presented as chapter 3 in the current thesis).
• Mohamed Alkalai, “Recognizing Tabular Mathematical Expressions Using Graph Rewriting”, Iberoamerican Congress on Pattern Recognition (CIARP 2013). [Alka 13a]
• Mohamed Alkalai, “Recognising Tables Using Multiple Spatial Relationships Between Table Cells”, International Conference in Central Europe on Computer Graphics, Visualization and Computer Vision. [Alka 14] (presented as chapters 8 and 9 in the current thesis).
1.5
Overview of Thesis
Chapter 1 gives an introduction to this thesis which contains a list of research questions, brief description of contributions and list of publications.
Part I is an overview of the techniques, algorithms and research related to the work in this thesis. In particular; chapter 2 is a review of the traditional approaches to the detection of plain text line/cell and also a discussion of current syntactic and semantic table recognition techniques and their limitations.
Part II presents a pre-processing approach toward a recognition technique of tables that contain mathematical structure. Chapter 3 details a novel histogrammatic algorithm for the detection of mathematical lines and also describes how this technique integrates with the Maxtract tool to improve its performance. Chapter 4 presents a technique to segment tables into cells. This technique, unlike other methods, has the ability to cor-rectly segment tables containing mathematical expressions.
Part III presents two novel table representation techniques. Chapters 5 and 6 detail the first one which uses a graph, that represents cells and columns of table which are gained by applying heuristic technique, to interpret the table structure. Chapter 7 gives an evaluation of the first method. Chapter 8 presents the second table representation technique that uses the same graph, illustrated in chapter 5, but then extract some cells or columns (if any) that the heuristic technique of the first method fails to do so. In
chapter 9, a discussion about the results of running the technique from chapter 8 over two datasets, one of these is from a book [Grad 07] and the other is available online, is given.
Chapter 10, sums up the contributions of my research and suggests some future work on my findings.
Part I
CHAPTER 2
LITERATURE REVIEW
Tables are very common objects for expressing information within documents in a concise manner. Recognising these tables is not a trivial problem in document structural analysis. As a result, a lot of techniques for understanding tables have been proposed by document analysis researchers. There are various formats of documents, for instance, document images, accessible text documents, PDF documents and web documents. However, we mainly discuss table structure understanding in image and PDF documents.
In order to extract information from tables, one should first come up with an approach for finding the table within a document. Although, it is easy for any human to recognise tables, robust methods for automatic recognition is difficult. Several observed features like symbols and layout might all be utilised in attempting to recognise tables. However, most of existing techniques suffer from the degradation in the accuracy rate of results when they are applied to various table datasets. Indeed, extracting the table’s structure as well as its context, is essential. This would contribute to have better markup and also give extra information which, in turn, pave the way to better document accessibility.
2.1
Issues in table structure recognition
With the rapid spread of electronic documents on the internet and the consequent increas-ing speed in the production of new documents in general, designincreas-ing efficient algorithms for retrieving and storing the content of these documents becomes essential. In the last decades, document analysis experts have proposed many techniques for symbol recog-nition, page segmentation and recognising of documents containing regular texts. The majority of these algorithms were not developed to deal with documents containing com-plex components, for instance, tables and mathematical expressions. Tables can efficiently and concisely present information that have relations and many of today’s documents have different types of tables. As a consequence, recognising tables is an interesting topic for research. The application of this area can be realized in information retrieval and clas-sification of documents, etc. Tables usually have no standard format. The aims of table recognition are to detect tables on pages and then try to extract their structural and content information.
2.2
Document structural analysis
The main function of document structural analysis is to detect the borders of different components and the spatial relationships between these components in documents. The demands in this area specifically encompass the following:
1. Segmentation of text word. 2. Segmentation of text line. 3. Segmentation of text block. 4. Table structure recognising.
Much work on these issues has been conducted. Several schemes and techniques are published in [Jain 98, Lee 00]. An example document analysis survey is reported
in [Nagy 00].
The majority of existing document structural analysis methods presume the existence of some knowledge about document properties. The information needed for these prop-erties can be very precise and specific, for instance, space width between documents components or shallow like how many columns a document is divided into.
2.3
Table analysis
By observing the current research work, it is found that some particular problems regard-ing table recognition, have not been given the deserved attention and even the researchers who work in this area have mainly used only heuristic rules [Silv 06], which are usually inferred from local analysis, to recognise tables. To understand the existing limitations of current table recognition methods, firstly the stages of table analysis are discussed:
1. Table detection: the table is usually located using empirical rules extracted from local analysis. As a consequence, current table detection methods fail in many cases. To avoid premature commitment to errors, some research works just pass by this task and focus on recognising clipped tables [Zani 04].
2. Table syntactic recognition: here tables are segmented into cells or blocks. How-ever, no detailed logical relationships between cells is given (i.e, remains unspecified). 3. Table semantic recognition: unlike the last task, the semantic relationships
between table’s cells are formally determined.
The majority of current table recognition methods focus on the first two tasks (i.e., ta-ble detection and tata-ble syntactic recognition). These techniques often use, for recognising tables, heuristic rules and not statistic rules that would be, by experience [Wang 04], more reliable. The third task does not attract the researchers because, it is almost impossible
to have obvious, sufficient and automatic way of assigning precise semantic information to the relationships between table cells. However, an example where attempting to do this is in [Taus 07], though the approach was for on-line recognition of matrices not for off-line recognition technique.
Tables have a graphical structure which can be expressed by visual languages. Due to the two-dimensional structure of table, two dimensional graph grammars are a valid method for representing table elements. If the content of cells are also targeted, OCR technologies are often engaged in the recognition process.
2.4
Methods used in table syntactic recognition
Since the mechanism used in our vision is still not fully known, no one can claim that his/her method has the ability to perfectly recognise any tables. Tables have many styles and conventions, therefore, it is very difficult, if not impossible, to create a method that can cope with any eventuality, without the aid of human intervention. Therefore, in try-ing to solve this problem, several methods have used syntactic information to decompose table.
Text line and cell segmentation are often considered as a prerequisite step for table structure recognition either for printed character or handwriting recognition. Much work has been conducted for text line and cell segmentation of printed documents (scientific journals, books, reports). In section 2.5, a brief description of standard text line/cell segmentation methods is presented which includes Projection Profile Cutting techniques, Smearing techniques, Grouping techniques and techniques based on Hough transform is given. In section 2.6, some information about segmenting mathematical expressions is presented. Then, in section 2.8, several cell segmentation techniques which use some of the standard line/cell segmentation approaches and other heuristic features are discussed.
2.5
Standard line/cell segmentation techniques
Extracting line/cell from different components (paragraphs, mathematical expressions and tables, ..., etc.) is one of the first steps towards understanding them. Much work has been done on this area in trying to handle this non-trivial task. Next, the standard approaches, that are widely used to segment line/cell, are described.
2.5.1
Smearing approaches
Run-Length Smoothing Algorithm is one example of these techniques which reasonably works on printed documents [Wong 82]. Consecutive black pixels in this technique that are vertically overlapped are smeared. As a consequence, the white space between these black pixels is blotted as well to form one block if this space’s width is less than a particu-lar threshold. Eventually, text lines are extracted by clustering the connected components found in the smeared image.
In [Wong 82], documents are scanned and converted into black and white images. Then, run-length smearing algorithm (RLSA) is used. An example is given to demonstrate how this method works. Let us have the following:
1. Black and white pixels that are denoted by (1’s) and (0’s) respectively. 2. An input of 0001100000110010000.
3. A threshold value of 4.
The RLSA often starts by smearing lines and then columns. The results of these smears are then merged. RLSA process smears all the material that exists in the original image. As a results, an image contains blocks corresponding to components (such as, paragraph, figure, etc.) that compose the original image is created.
Tables have mostly the same layout structure as documents. Therefore, it is possible, by minor modifications to RLSA method, to achieve segmentation of tables. However, as mentioned before, tables have no standard convention of composing, therefore, it is almost impossible to develop a technique that has good performance over all cases. For example, tables which have spaces between their columns that as wide as the spaces between their words, would not be correctly segmented by these kind of methods.
Figure 2.1(a) illustrates the application of this technique which succeeds in separating the columns. In contrast, figure 2.1(b), due to the tiny space between the columns, the technique fails to work .
2.5.2
Projection Profile Cuts (PPC)
These techniques are often used to segment printed documents. This method could also be adjusted to work with handwritten documents that have slight overlap. The vertical projection-profile can be obtained by gathering pixel values across the x-axis for each y value. After calculating the vertical profile, the text lines in the vertical direction can be extracted.
There is more than one way for obtaining a profile trend which include observing the transitions of black/white pixels such as in Marti and Bunke [Mart 01] or by assembling a number of connected components according to the vertical overlapping between them. This profile trend is usually smoothed, for instance, by a Gaussian or median filter to get rid of elusive local maxima [Bous 10]. The profile trend is then analysed to retrieve its
Figure 2.1: An example of Smearing’s drawback.
peaks and valleys.
As it can be observed, printed documents primarily contain blocks. Therefore, a doc-ument can be cut recursively into blocks. These docdoc-ument’s blocks can be represented by several models (such as tree, graph...etc that will be discussed later). The cut application can be based on the observation of pixels or connected components density. A detector is used to point out local peaks in the horizontal and vertical profiles that represent row and column separators. The cuts process are placed on these local peaks.
Similar to the previous technique, PPC could be used to decompose tables and in-deed it is a fast simple way to effectively perform more complex layout analysis of tables.
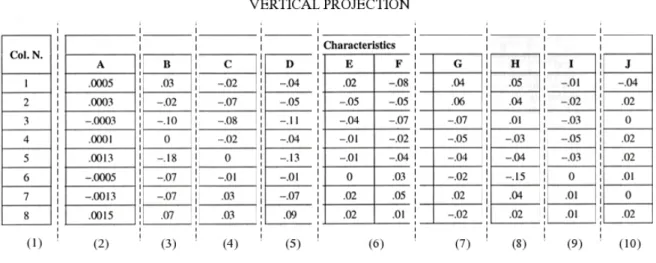
Figure 2.2: A Statistical table.
However, it has some significant drawbacks. For instance, tables are likely to have some spanning cells, which in turn, makes the PPC over-segment or under-segment the columns of the table. This can be illustrated by the next example.
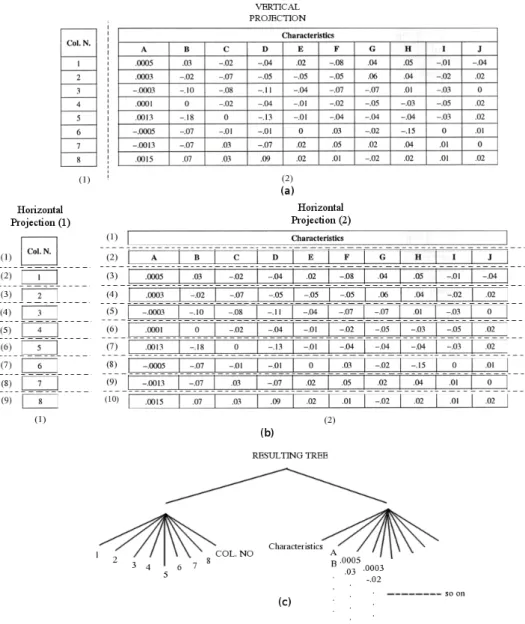
Considering the table in figure 2.2, The first projection would lead to a vertical cut that separates the table into two columns. First column headed by Col. N. and the second one headed by Characteristics(see figure 2.3(a)). This corresponds to the first layer in the resulting parse tree (see figure 2.3(c)). Then horizontal cuts are followed to separate the first column to nine rows and the second to ten rows (see figure 2.3(b)). This indeed forms the outer structure of the table. Nevertheless, this is not the only acceptable scenario. Figure 2.4 illustrates the other possible vertical and horizontal cuts.
It can be inferred from the above example that there is some drawbacks of using PPC. Below is a list of these drawbacks:
1. PPC separates columns or rows (over-segment), which is generally undesirable, as they have to be reassembled.
2. PPC would fail if it is used for multi-line rows. Specially, if there is no a distin-guishable spaces between them.
rela-Figure 2.3: An example of PPC applied to the table in figure 2.2
tionships between what is horizontal and vertical, touching symbols might wrongly segment as atomic blocks that can cause under-segmentation of rows and columns.
2.5.3
Grouping approaches
These techniques at first construct alignments by clustering units using a bottom-up ap-proach [Breu 02]. These units could be simple like pixels or complex such as connected components and blocks. The joining process depends on both local and global constraints. These constraints are used for testing consistency.
Figure 2.4: An example of PPC’s drawback.
The document structure method of O0Gorman [OGor 93] is an example of the grouping technique using a bottom-up approach. It assembles consecutive connected components using heuristic rules which are built using the geometric relationship that exists between adjacent units. This technique works on printed documents [Bake 09] and also on hand-written documents with little overlapping [Bous 10].
2.5.4
Hough transform approaches
The method described in [Houg 62] and [Illi 88] is the typical approach for retrieving the line’s parameters in a binary image. It was introduced to detect parametrised regions in binary images and also to compare each image point with all points that exist in the parameter space that could likely produce the image point. Therefore, each image point gives a vote for the region parameters that could produce it. The most likely to have produced a specific shape in the true image is the point(s) in the parameter space gathering the greatest number of votes. The main disadvantage of implementing such techniques is its need of big storage and other computational requirements.
2.6
Mathematical expressions segmentation
There are several types of input that are used in mathematical recognition techniques which encompasses vector graphics (such as PDF) or a document images. Each of these input types imposes some demands on detecting expressions. As for document images, several techniques apply, for instance, OCR techniques, before recognising mathematical expressions in documents, to locate mathematical expressions. For PDF documents, a match technique (like the one in [Bake 10]) is used to overcome the inaccurate bounding boxes of symbols extracted from PDF files.
2.6.1
Mathematical expression segmentation in images
In this type of mathematical recognition method, the mathematical expressions are usually detected using attributes of connected components. One can categorise these expressions into two: 1) displayed expressions which are stand alone apart from text paragraphs 2) embedded expressions that occur within text lines. Figure 2.5 shows some examples of displayed and embedded mathematical expressions.
Detecting displayed expressions are often easier than the expressions embedded in text lines. This is because there are distinguishable differences between regular text lines and displayed expressions properties (this encompasses geometric features like width, space separator and symbol sizes [Gara 07, Kace 01]).
In [Gara 07] another technique for locating embedded expressions is developed. Firstly ordinary text lines are detected. Then, some statistical facts about pure ordinary text lines and texts that have embedded expressions are obtained by observing neighbouring symbols. An accuracy rate of 97% is stated.
Figure 2.5: Examples of displayed and embedded mathematical expressions which is taken from [Stro 11]
calculating the average of sophisticated parameters values for detecting the two expression types. Using recall measure for evaluation, an accuracy rate of 88.3% and 97.2% for embedded and displayed expressions respectively are obtained. These rates are considered to be high due to the comparison with the rates in [Chu 13, Lin 11, Chow 03]
2.6.2
Mathematical expression segmentation in PDF files
For PDF documents, the work has been so far focused on how to extract symbols and recognise manually clipped expressions. However, to the best of our knowledge, a ded-icated work about automatic segmenting of mathematical expressions is not yet accom-plished, since the information currently available in PDF files does not provide any ad-vantages in detecting mathematical expression positions [Zani 12]. Therefore, conducting
research on finding possible ways to tackle this issue is important for several applications of retrieving mathematical information.
2.7
Unsolved issues concerning the detection of lines
containing mathematical expressions
While in regular text documents generally lines can be clearly separated by simply detect-ing consecutive whitespace between lines and applydetect-ing vertical cuts or by usdetect-ing one of the techniques mentioned earlier, for documents containing mathematical expressions the cur-rent techniques do not suffice due to the occurrence of particular artifacts of mathematical notations (e.g., mathematical accents, the limits of sum symbols). And while there exists a body of work on the segmentation of mathematical documents, this work is generally more concerned with the identification and separation of mathematical structures from surrounding text and their subsequent layout analysis [Zani 12].
2.8
Existing table segmentation methods
The main segmentation goal is to describe the physical structure of a table, i.e. detect its cells and their border information, and also its columns and rows. In this section, we sum up the segmentation methods proposed by different authors. These techniques are categorised based on the approaches used in detecting a table’s cells.
2.8.1
Projection-profile approaches
In Green and Krishnamoorthy [Gree 95], the user supplies a table prototype. This proto-type includes the features of the separators that split up the table into different areas, en-compassing its cells, rows and columns. Based on these features, the table is consecutively sub-split into the smaller levels of the prototype and each one is labelled by combining
output is represented in an XY tree. Experimental results on a small number of tables are reported
In Wang et al. [Wang 01], a vertical projection is made on the word boundaries and columns are extracted based on the space corresponding to every peak between two valleys. The same authors in [Wang 02] imply that they have the intention to build a probabilistic algorithm for this task. For the evaluation of this technique, a dataset of 1125 document pages which contains 518 table entities and 10941 cell entities is utilised. The method uses segmented line and word as input. 90% accuracy rate for correctly detecting cells was obtained
Kieninger [Kien 98] builds a network of block segmentation based on words that are horizontally overlapped in consecutive lines. It is found that, unlike other document components, blocks in a table are only horizontally overlapped to form columns. A claim from the author stated that this algorithm has a reasonable performance on ASCII files and can be adapted to work with scanned documents. The issues with this method are that it has too many heuristic rules and there is no guidance for how to use the parameters in the post processing steps.
2.8.2
Heuristic approaches
Mixed rule
Ferguson [Ferg 97], uses column headers usually appearing in the first row of the table to roughly detect column bounders, then, lines are extracted until the detection of the end of table bounders. Based on this information, the table is segmented such that lines contain number of cells, ranged from one to the maximum columns of the table.
In [Janu 97], the model used to manipulate tabular data utilizes font features, posi-tional information and some heuristic rules extracted using OCR results to detect the cell
boundaries. In case information is lacking, vertical and horizontal white space are utilized.
White spaces rule
In Shamillian et al. [Sham 97], the user is provided with a model that is able to retrieve table row and column separators using the white space; those separators are then used to segment the table.
In Tupaj et al. [Tupa 96], vertical white space paths existing in the table are retrieved; the lines intersecting a great number of such paths are eliminated from the table; when there is a line with narrow paths, the centre of the path assigns to the column sepa-rators. Unfortunately, cells spread over columns are not correctly extracted; and as a consequences, ghost columns containing a few cells are wrongly detected.
2.8.3
Grouping approaches
Kornfeld and Wattecamps [Korn 98] split up the lines of the table into cells. Each line would have number of cells not less than one cell and no more than the maximum number of columns that possibly exist in the table. A method then clusters the cells that are consecutive in the horizontal direction where the space between them is too small for the horizontal gap usually available between the columns.
Chao [Chao 03] applies a hierarchical grouping algorithm to cluster the words inside the table (to form cells) based on how close their beginning and end positions are. Then the best clustering levels that might compose a column are chosen according several heuris-tics. The author assumes that the column in the leftmost position of the table is often a header. Then, a method is utilized to detect table rows. The lines that have no data are assembled with the above line. This basic heuristic leads the cells which represent titles in lower position to be gathered with lines that have no data. The method does not
Mandal et al. [Mand 06] have proposed a simple method for table detection. It relies on observing spaces between table cells in an image (this gap is supposed to be larger than the gap between words in a regular text line). This technique claims an accuracy rate of 97.21%. One drawback of this approach as the author stated is that the algorithm does not work properly when a page contains tables only or those with narrow columns with single word/numbers.
2.8.4
Advanced approaches
In Ng et al. [Ng 99], they expected column delimiters to be whenever the change from an alphanumeric to a non-alphanumeric character takes place. Every column which has a width of one character is compared with the following and the previous and checked whether there are changes between different character groups. A neural networks algo-rithm (decision tree induction algoalgo-rithm together with a backpropagation algoalgo-rithm) was utilized to infer a classifier that judges whether a particular vertical line in the document is a column delimiter or not.
Handley [Hand 00], starts by observing if the table cells are completely extracted using graph line or not. If not, the position of line is combined against the relative location of the word boundaries and white spaces around them. An initial guess of lines is constructed using the histogram of the horizontal projection of the word boundaries in the table; then words that are vertically overlapped and are close to each other are clustered into cells. A histogram of the vertical projection on cells is constructed to extract columns. However, header cells of the table would give less weight, because the likelihood of such cells to be spanning is high. A more precise heuristic using the same histogram approach is used for detecting spanning rows and cells.
the document. The model encompasses statistics including how many two words occur together in the training set. The document is retrieved to collect the points needed for a decision maker to decide about what the next to text components in documents should be. The method splits, using the model of language, the candidate cells existing in a table. The output of this technique is segmentation of the table into cells [Hurs 01], spanning cells are also included. In [Hurs 03] Hurst develops an approach that clusters these cells into rows and columns. This is accomplished by concatenating together cells that hori-zontally or vertically overlap with each other. Several conditions must be satisfied when constructing these links. This step might correct the mistakes made in the segmentation of cells phase described in [Hurs 01].
2.9
Existing table segmentation techniques for
PDF/-Postscript
Yildiz et al. [Yild 05] proposed a scheme called PDF2table which is a syntactic approach that encompasses two techniques: table recognition, where components arranged in tab-ular form is segmented, and table re-composition in which extracted elements are passed to a table model. Experimental results of running the approach over a dataset of 150 documents are presented. However, comparing this method with other technique is im-possible, due to the fact that the dataset is not available.
Hassan and Baumgartner [Hass 06] design a method that extracts components from PDF files (such as paragraphs, tables and graphics). These components are then tagged with a appropriate labels. This work is accomplished by observing the features of all text fragments structure and also by considering the white gap between different components. Authors mentioned that their work can not ensure a reasonable performance when it runs over PDF files that contain tables. The output can sometimes contain an object that represent a whole column, also sometimes cells of tables are interpreted as single objects.
Lawrence et al [Lawr 99] have designed methods that aim to improve the accessibility of scientific documents. This work is sponsored by Citeseer project. This research mainly focused on indexing all texts that are within scientific articles which have Postscript and PDF formats. However, the necessary attention for tables structure and their contents is not given in this research.
Anjewierden [Anje 01] works with information directly extracted from PDF files. He claims that this would allow us to have the same components as they appear in original documents, as wall as extra fonts and style information. He states that his grammars effectively work with several type of documents. This system, according to the author, performed on three different document domains which are:
1. Military equipment. 2. Car repair.
3. Electronic control systems for traffic lights.
2.10
Unsolved issues concerning the segmentation of
tables into cells
Silva et al. [Silv 06] state that most approaches to table recognition are still not general enough to derive physical models of complex tables with overlapping cells if no grid-lines are available. As an example, they present the table in Fig. 2.6 where the top left cell spans two columns, but can usually not be detected by table recognition approaches if the cell contains more than one distinguishable word (e.g., [Tupa 96, Kien 98]). Unfortu-nately, tabular layout of this nature is very common for mathematical formulas.
Figure 2.6: A table (taken from [Silv 06]) most segmentation algorithms would not process accurately
An exceptional approach that can deal with these types of cells is presented by Hurst [Hurs 01, Hurs 03]. Rather than using abstract words and their position to identify columns, Hurst uses a language model in order to group words into cells, before con-structing rows and columns. While this makes the method more robust to the presence of multicolumn or multirow cells as well as to some extend to cell overlap, one needs to have a sufficiently robust language model first, which to our knowledge does not exist for arbitrary mathematical expressions.
2.11
Table representation techniques
Tables are usually represented by a tree or graph at the logical level. The role of this table recognition stage is to bridge the tables at abstract and physical levels by defining the table cells and the proper way of how they can be recomposed to form a table. Examples are in [Hara 94, Nagy 00, Wang 96, Wang 93]. Before going further, a brief description of the table at abstract and physical levels is given.
The table encompasses and expresses the intention of the author. This could be sta-tistical data of a particular type of job seekers, or a comparison of different data that the composer tries to convey in a concise manner. Abstract tableslabel can be given to tables in this level where a description of table structure is manually presented by the composer. Examples of such a level of tables are provided in [Wang 93].
represent them. P hysical tables mean here the description of layout structures of the tables [Hara 94, Hurs 99, Nagy 00]. Physical tables are often constructed automatically; these kind of tables are usually composed by tools which are built on some high level description of the tables. For instance, tables in XML documents are constructed by browsers using mark-up tags. In the same manner, tables in PDF documents could be composed from strings of table description that obey the LATEX syntax rules.
2.12
Models to represent tables
As mentioned above, alogical tables role specifies how table cells should be re-arranged using the relationship between cells. Next, various models are illustrated which include Tree, Dual Hierarchy, CALS and Graph Models.
2.12.1
Tree models
Trees are a well-known model for representing the structures of table. Nagy and Seth [Nagy 84] were the first authors to use x-y trees for representing tables. Since then, such models have been widely utilized. Examples of applications encompassing the representation of the hierarchy of form documents, for instance, [Duyg 00, Duyg 98], table structures recognition, for instance, [Ha 95, Sylw 01, Zou 07] and extraction data from tables, for instance, [Kr 05, Tari 98].
To extract a table’s structure, the table is split into rectangular blocks using the x-y cut algorithm [Zani 00]. The algorithm recursively cuts along row and column delimiters until nothing remains to be cut. For example, a vertical cut can split the table in Figure 2.7 into two parts: the right part that represents cell A and the left part that represents cells B and C which could be segmented again by projecting a horizontal cut to the left part. The resulting cells are represented by an x-y tree. The whole table is represented by the
Figure 2.7: Table used for describing the work of the x-y cut algorithm
Figure 2.8: The table cells in Figure 2.7 represented by x-y tree
root of the tree where a leaf node denotes a single cell and a non-leaf node indicates a part that can be further segmented. Figure 2.8 illustrates the x-y tree for the table structure in Figure 2.7. The x-y tree structure matches with the table structure that it represents. The x-y tree hierarchy matches with the table block hierarchy and the re-composition of a table can be accomplished by traversing the tree.
2.12.2
Dual hierarchy models
In this type of representation, row and column hierarchies are simultaneously used to rep-resent a table. Examples of this kind of reprep-resentation are in [Bigg 84, Beac 85, Came 89]. A linked list of rows and a linked list of columns are utilized to represent a table. Each cell in the table corresponds to an element in both the row and column lists. If a cell was to be deleted, then the row and column lists must be updated.
The authors in [Bigg 84] introduced a system for recognising table called TABLE. However, prior to the system implementation, a comparison between the effectiveness of the tree and dual hierarchy representations was accomplished. The authors concluded that there are advantages and disadvantages for both representations, functions which perform well on one representation were usually show degradation in accuracy at the other one. For instance, functions which deal with cells spanning more than one row or column were much easier to be implemented using the tree representation. On the other hand, functions that are used to observe the pointer movements between cells of tables were much easier to perform using the dual hierarchy representation. The authors overall decided to use the dual hierarchy representation. Since there are similarities between this type of representation and graph representation which, as we will be discussed later, outweighs the advantages of using a tree representation, one can say that authors was right to work with this representation.
2.12.3
The CALS model
This model was designed by the Organization for the Advancement of Structured Informa-tion Standards (OASIS). Tables in SGML/XML use this model as a standard to represent them. It is designed to deal with a wide range of complex tables found in technical docu-ments of military organizations. The CALS modal allows encoding the geometric features that are extracted from a table as well as several basic formatting styles, for instance, borders and cell alignment. XML strings are used to define tables in the CALS model. These strings must meet the CALS DTD, see [OASI 95, OASI 96, OASI 99]. The CALS DTD contains many detail but structurally, this table model establishes that any table must include a head title.
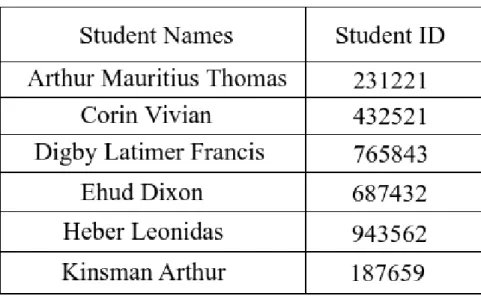
Among the characteristics of this model is the one that gives the ability to authors to assign name strings to columns. Rather than pointing to columns using their references, such as column no 1 and column no 2, columns could be retrieved by some strings, such
Figure 2.9: Example of table used in illustrating CALS representation model
as “student names column” and “student ID column” in Figure 2.9. Despite the fact that a set of characters can be assigned to columns, this CALS model can not semantically interpret these column names.
2.12.4
Graph model: Amano and Asada’s model
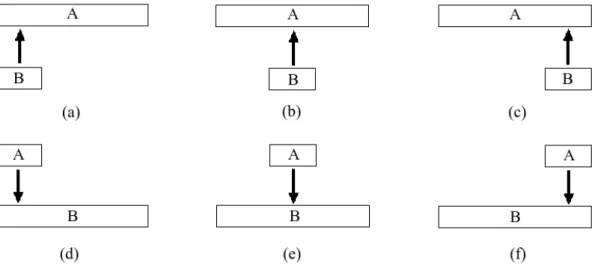
A table graph representation usually encodes the geometric relationships between table cells such that each cell is denoted by a node and that the relationships between these cells are denoted by edges.
In [Aman 02] a graph representation system which directly implements the geometric relationship between table cells is introduced. These cells defined by projecting on the x axis and y axis to extract vertical and horizontal lines positions that are then used in detecting the borders of table’s cells. Every cell in the table is denoted by a node. An edge in the graph is used to represent the relationship between pairs of nodes. Different edges are considered to represent a relationship between any two cells. Here is an illustration of some of these edges.
Figure 2.10: Cells that are totally and vertically overlapped
Figure 2.11: Cell’s y-axis borders within other cell’s y-axis borders
1. Two cells that are vertically overlapped where they have the same start and end y-axis border values. Figure 2.10 shows Cell A and Cell B and the unique geometric relationships between them (edge).
2. Two cells that are vertically overlapped where the start and end y-axis borders of one cell is within the start and end y-axis borders of other cell. Figure 2.11 shows Cell A and Cell B and the unique geometric relationships between them (edge).
3. Two cells that are horizontally overlapped where they have the same start and end x-axis border values. Figure 2.12 shows Cell A and Cell B and the unique geometric relationships between them (edge).
4. Two cells that are horizontally overlapped where the start and end x-axis borders of one cell is within the start and end x-axis borders of other cell. Figure 2.13 shows Cell A and Cell B and the unique geometric relationships between them (edge).
Figure 2.12: Cells that are totally and horizontally overlapped
Figure 2.13: Cell’s x-axis borders within other cell’s x-axis borders
5. Two cells that are horizontally overlapped where the end x-axis border of one cell is greater than the start x-axis border and less than the end x-axis border of other cell. Figure 2.14 shows Cell A and Cell B and the unique geometric relationships between them (edge).
In this representation model, the geometric relations that occur between table cells are represented by the edge types in the graph. For example, figure 2.16 is the graph representation of figure 2.15( Note: only a sub set of edges are shown in this example not all edges). This representation opens the gate for expressing table layouts using context-free grammars by detecting all layout relations any two cells can have.
Figure 2.14: Cells that are partially and horizontally overlapped
Figure 2.15: Example for table representation model (taken from [Grad 07])
2.13
Unsolved issues concerning the representation
of table structure
The authors of [Rame 03] analyse the two most well-known table representation systems (which are introduced by the World Wide Web Consortium (W3C) and Advancement of Structured Information Standards (OASIS)) that are used to represent tables and find that they share the same deficiencies. First, the representation of irregular physical layouts are difficult. Poorly aligned borders of cells are not allowed and improvised solutions are provided for the spanning cells. Finally, limited means are supplied for the description of the logical structure of a table. Therefore, the first issue is to find a general model for representing the information of table structure. Table representation models which are domain-dependent do exist, however, usually the performance of these methods hugely decreases when one tries to generalise. Scalability, extensibility are among the preferable
Figure 2.16: The resulted graph representation of figure 2.15
properties of any general representation methods.
2.14
Summary
In this chapter, table recognition literature review, which encompasses a discussion of different techniques and approaches that are used to tackle several problems facing the recognition of table structure, is given. Firstly, current line/cell segmentation methods are reviewed and classified based on the standard approaches that are widely utilised in segmenting lines/cell. In addition, some issues regarding detecting mathematical expres-sion is mentioned. Secondly, several existing cell segmentation techniques which utilise various features, that can be observed within tables, to detect table cells, as well as, un-solved problems concerning cell segmentation are discussed. Finally, different algorithms that are currently used to represent table structure and some limitations concern these representation algorithms are illustrated.
Part II
Preprocessing Steps Toward A
Robust Mathematical Table
CHAPTER 3
A NOVEL HISTOGRAMMATIC APPROACH TO
LINE SEGMENTATION
The basis of our table recognition system is a robust algorithm for the separation of mathematical lines. Line segmentation is a prerequisite step for structural analysis of both printed and handwritten documents. Much work has been done for text line seg-mentation of documents containing text only. The developed techniques such as projection profile cutting [Mart 01, Bous 10], smearing [Wong 82], grouping [OGor 93] or seam carv-ing [Saab 11], rely to some extent on the fact that in regular text documents generally lines can be clearly separated by detecting consecutive whitespace between them.
For documents containing mathematical expressions, however, these techniques do not suffice due to the occurrence of particular artifacts of mathematical notations such as mathematical accents, the limits of sum symbols, etc. that, while actually constituting a single line, can appear spatially laid out over more than one separable line. And while there exists quite a body of work on the segmentation of mathematical documents, this work is generally more concerned with the identification and separation of mathematical structures from surrounding text and their subsequent layout analysis [Zani 12].
In this chapter we present a mathematical line recognition algorithm that is indepen-dent of knowledge on any peculiarities of mathematical expressions. It is based on spatial
considerations only, thus avoiding committing to premature errors that stem from con-sidering actual content such as symbols or fonts. In particular, we use a histogram-based approach, considering horizontal spaces between glyphs in lines of a page, in order to classify lines into two types: principal and non-principal, where the former are lines in their own right, while the latter are only parts of mathematical expressions and should be merged with neighbouring lines. In addition to this technique we have developed a set of heuristics using simple yet effective measures for the correction of classification errors as well as to separate lines that share vertically overlapping characters but that belong to distinct mathematical expressions. We demonstrate the effectiveness of our approach by presenting experiments on two distinct data sets containing 200 and 1000 pages from mathematical documents, where we achieve an accuracy rate of 96.9% and 98.6%, respec-tively for line detection (Sec. 3.2).
The basic idea of our approach is to detect all possible individual lines first and then merge neighbouring lines into single lines likely to contain mathematical expressions. Thereby we rely neither on knowledge of the content of lines, font information nor verti-cal distance. Instead we use a histogrammatic measure on space within a single line. In a final step we then employ simple height considerations to detect lines that have not been merged or wrongly merged.
3.1
The approach at a glance
In summary our procedure consists of the following six steps: 1. Compute bounding boxes of all glyphs on a page.
2. Construct lines by separating sets of glyphs with respect to vertical whitespace.
That is, we use vertical cuts similar to projection profile cutting [Zani 00]. These lines will get refined later.
3. Detect and split lines with vertically overlapping characters.
4. We classify lines as principal or non-principal — where the former constitute a proper line while the latter should be merged with a principal line above or below (see figure 3.8)— by comparing the horizontal distances of neighbouring glyphs. A line is classified as non-principal if no pairs of its glyphs have a separation distance within a certain threshold, where the threshold is computed from the histogram of all horizontal distances between neighbouring glyphs for the entire page.
5. The classification is then corrected by comparing non-principal to neighbouring principal lines with respect to their maximum character height. If a non-principal line is not within a ratio of the character height of its neighbouring principal lines it is promoted to principal line.
6. In a second corrective step we compare all lines identified as principal on a page with the maximum height of all existing non-principal lines on that page. If any principal line is less than or equal to that maximum, it is demoted to non-principal line.
7. Finally non-principal lines are merged recursively with their closest neighbouring principal lines.
More formally we define the following concepts for our algorithms. First we render our notion of bounding boxes (See figure 3.1) more precise:
Definition 1 (Bounding Box). Let g be a glyph, then the limits of its bounding box are defined by l(g), r(g), t(g), b(g) representing left, right, top and bottom limit respectively. We also havel < r and t < b.
Definition 2 (Vertical and Horizontal Overlap). Let g1,g2 be two glyphs. We say g1
Figure 3.1: Examples (taken from [Grad 07]) of glyph’s bounding boxes and vertical and horizontal overlaps.
Similarly we definehorizontal overlap of two glyphsg1,g2by [l(g1), r(g1)]∩[l(g2), r(g2)]6=
∅.
Algorithm 1: Composing initial lines algorithm
input : N on−empty list of bounding boxes of page’s glyphs that is in ascending order according tot(g)
output: Initial lines contain mathematical structure 1 begin
2 let list = list of glyphsg
3 let lines = emptylist 4 let listTemp = emptylist
5 let tallestGlyphs = b(head(list)) 6 while list 6= emptylist do
7 if t(head(list))< tallestGlyphs then
8 add head(list) to listTemp
9 tallestGlyphs = maxg∈listT empb(g)
10 remove head(list) from list
11 else
12 add listTemp to lines
13 let tallestGlyphs =b(head(list))
14 let listTemp = emptylist
15 add listTemp to lines 16 return lines
We can now define a line using the vertical overlap on a set of glyphs. The goal of this step is to extract initial lines that exist in a page. See figure 3.2.
Definition 3 (Line). Let G = {g1, ..
![Figure 1.2: Two different interpretations of a single table (taken from [Grad 07]).](https://thumb-us.123doks.com/thumbv2/123dok_us/741224.2593850/20.892.154.770.127.483/figure-different-interpretations-single-table-taken-grad.webp)
![Figure 2.5: Examples of displayed and embedded mathematical expressions which is taken from [Stro 11]](https://thumb-us.123doks.com/thumbv2/123dok_us/741224.2593850/37.892.166.793.120.652/figure-examples-displayed-embedded-mathematical-expressions-taken-stro.webp)
![Figure 3.7: Examples (taken from [Deni 11]) of pages and their histogram of the gap between glyphs](https://thumb-us.123doks.com/thumbv2/123dok_us/741224.2593850/65.892.190.809.134.567/figure-examples-taken-deni-pages-histogram-gap-glyphs.webp)
![Figure 4.1: Tables (taken from [Grad 07]) with mathematical expressions before applying the Kieninger’s algorithm.](https://thumb-us.123doks.com/thumbv2/123dok_us/741224.2593850/82.892.177.770.152.670/figure-tables-taken-mathematical-expressions-applying-kieninger-algorithm.webp)