© 2015, IRJET ISO 9001:2008 Certified Journal
Page 1461
Enhanced Cost Sensitive Boosting Network for Software Defect
Prediction
Sreelekshmy. P
M.Tech, Department of Computer Science and Engineering, Lourdes Matha College of Science & Technology,
Kerala,India
---***---Abstract -
Software Defect Prediction (SDP)plays an important role in reducing the costs of software development and maintaining the high quality of software systems. The early prediction of defect-proneness of the modules can allow software developers to allocate the limited resources on those defect-prone modules such that high quality software can be produced on time and within budget. It is a great challenge to address the class-imbalance and high-dimensional data problems of software defect prediction. In this paper, three cost-sensitive boosting algorithms are analyzed to boost networks for software defect prediction. Most of the previously developed prediction models do not consider this cost issue. The cost sensitive prediction technique is considered as an effective means for the optimization of quality assurance activities. Cost will never be an independent term because there are too many variables involved in the calculation of cost estimation such as human, technical, environmental and political factors. When compared to blind classifiers, the proposed cost-sensitive boosting methods considering cost information in both feature selection and classification stages provide better solutions to deal with the class imbalance and high-dimensionality problems in SDP. Software Defect Prediction is extremely essential in the field of software quality and software reliability. These systems can be used to achieve timely fault prediction for software components. Then the software quality assurance team can utilize the predictions to use available resources for obtaining cost effective reliability enhancements.
Key Words:
Software Defect Prediction, Cost.
1. INTRODUCTION
Software Defect Prediction (SDP) is one of the most active research areas in software engineering. It plays an important role in reducing the costs of software development and maintaining the high quality of software
systems. It allows software project managers to allocate limited time and manpower resources to defect-prone modules through early defect detection. Software defect prediction is the process of locating defective modules or data in software. To produce high quality software, the final product should have as few defects as possible. As the size of the software projects become larger, defect prediction techniques support developers as well as it helps to speed up time to market with more reliable software products.
Defect Prediction studies are still have many challenging issues. Most of the previously developed prediction models do not consider the cost issue. The cost sensitive prediction technique is considered as an effective means for the optimization of quality assurance activities. Cost will never be an independent term because there are too many variables involved in the calculation of cost estimation such as human, technical, environmental and political factors. Here an enhanced cost sensitive boosting technique is proposed which achieves better performance in software defect prediction compared to existing techniques.
© 2015, IRJET ISO 9001:2008 Certified Journal
Page 1462
the cost-sensitive classification deems to make the SDPclassifier not dominated by the majority class.
Data is an important part of software system. To find the defective data enhances the overall system performance. Software development team tries to increase the software quality by decreasing the number of defects as much as possible. Here an enhanced technique is proposed for identifying fault prone data as well as this algorithm is compared with all previous methods to find out the best algorithm for defect prediction.
Software Defect Prediction Model refers to those models that try to predict potential software defects from test data. Here the proposed system involves mainly two parts prediction and comparison.
2. DISADVANTAGES OF EXISTING SYSTEM
The prediction accuracy of the existing techniques is low
The prior methods failed to provide a better solution for class imbalance problem.
Most of the prior methods has higher
misclassification costs and error rates.
3. PROBLEM DEFINITION
Software defect prediction still remains a difficult problem to be solved, and is faced with two challenges: high dimensionality, and class imbalance. As modern software systems grow in both size and complexity, the number of features extracted from software modules becomes much larger than ever before, and these features may be redundant or irrelevant. The second challenge for SDP is the class-imbalanced data, where the majority of defects in a software system are only found in a small portion of its modules.
The solution for high dimensionality is an important pre-processing procedure, ie, feature selection is beneficial to facilitate data understanding, to reduce the storage requirements, and to overcome the curse of dimensionality for improved prediction performance. The solution for class imbalance is cost-sensitive learning, which explicitly considers those different error costs, and aims to minimize the total expected costs rather than the classification error rates.
The goal of this developed solution is a cost-sensitive boosting method for SDP by using cost information in both the classification and the feature selection stages. This Enhanced Feature Selection and Categorization method provides cent percent accuracy and sensitivity.
4. ARCHITECTURE
-Fig 4.1- Architecture of Combined TSCS and EAFSC method
To fully utilize the valuable cost information, a two-stage cost-sensitive learning (TSCS) method for software defect prediction where the cost information is used in both the feature selection stage and the classification stage. The cost-sensitive feature selection aims to select features that are associated with the interesting class (i.e., defect-prone module), and the cost-sensitive classification deems to make the SDP classifier not dominated by the majority class (i.e., not-defect-prone module). The above two stages are used to solve the class imbalance problem in SDP. Fig 3.1 illustrates a general architecture of the combination TSCS and EAFSC method. As shown in Fig. 3.1, the historical data, including various software metrics captured from software systems, are
Historical data
Testing data
Cost Sensitive Feature selection
Data pre processing Training
data
Data pre processing
Dimension reduction EAFSC
Selected Features
Test Data
Cost Sensitive Classification
Classifier
Prediction© 2015, IRJET ISO 9001:2008 Certified Journal
Page 1463
divided into two groups: the training data set, and the testdata set. These data are pre-processed before being fed into the following feature selection and classification algorithms. In the second stage, cost-sensitive feature selection algorithms are applied to the training data to find the optimal features, and thus the dimension can be reduced. The next step is to train the cost-sensitive classification models based on the training data set with selected features.
As a part of first step of feature selection, a random selection approach namely Enhanced Algorithm for Feature Selection and Classification (EAFSC) have been used. EAFSC is a random search method, capable of effectively exploring large search spaces, which is usually required in case of attribute selection. Enhanced Algorithm for Feature Selection and Categorization combines the three filter type feature selection methods Variance Score, Laplacian Score and Constraint Score. Then Feature Selection and Categorization are done on the same stage using these methods. Finally, the two learned model is evaluated on the test data set.
4.1 Data pre-processing
Data preprocessing describes any type of processing performed on raw data to prepare it for another processing procedure. The data are pre-processed before being fed into the following feature selection and classification algorithms. The resultant data is complex.
4.2 Cost Sensitive Feature Selection
The aim of feature selection is to find the minimally sized feature subset that is necessary and sufficient for a specific task. Here, it introduces three popular filter-type feature selection methods including Variance, Laplacian Score, and Constraint Score, which are relevant to the proposed methods. Variance score (VS) is a simple unsupervised evaluation criterion of features. It selects features that have the maximum variance among all samples, with the basic idea that the variance among a feature space reflects the representative power of this feature. As another popular unsupervised feature selection method, Laplacian Score (LS) not only prefers features with larger variances which have more representative power, but also prefers features with stronger locality preserving ability. Constraint Score (CS) is a semi-supervised feature selection method, which performs feature selection according to the constraint preserving ability of features. It uses must-link and cannot-link pair-wise constraints as supervision information, where features that can best preserve the must-link constraints as well as the cannot-link constraints are assumed to be important.
4.3 Cost Sensitive Classification
The next step is to train the cost-sensitive classification models based on the training data set with selected features. In the SDP domain, many cost-sensitive classification methods have been applied and shown effective to deal with the class imbalance problem. Any kind of cost-sensitive classifiers can be used in the classification stage. Cost information is used to evaluate the misclassification costs from different types of errors. Other than focusing on lower classification error rates, cost-sensitive learning methods aim to minimize the total expected costs by utilizing the cost information.
4.4 Enhanced Feature Selection and Categorization
Further, unlike many search algorithms, which perform a local, greedy search, EAFSCs performs a global search. An Enhanced algorithm (EAFSC)) is a search algorithm inspired by the principle of natural selection. Here the basic idea is to evolve an optimized algorithm using Variance Score, Laplacian Score, and Constraint Score so that it can provide high accuracy rate. This three cost-sensitive feature selection algorithms by emphasize samples with higher misclassification costs, and de-emphasizing those with lower misclassification costs in the feature selection stage. It is adopted in practice due to their simplicity and computational efficiency. The prediction model can predict whether a new instance is defect-prone (buggy or clean) or not.
4.5 Performance Evaluation
Finally, the two learned model is evaluated on the test data set. For better evaluating the performances in the cost-sensitive learning scenarios, the Total-cost of misclassification, which is a general measurement for cost-sensitive learning, is used as one primary evaluation criterion. The results clearly depicts the relevant attributes as identified by the Enhanced Feature Selection and Categorization have indeed improved classification accuracy of the all the four classifiers used for validation when compared to classification accuracy with all the inputs.
Actual
Predicted
Defect-prone
Not-defect-prone
Defect-prone TP FP
Not-defect-prone FN TN
© 2015, IRJET ISO 9001:2008 Certified Journal
Page 1464
A confusion matrix is a table that is often usedto describe the performance of a classification model on a set of test data for which the true values are known. On the other hand, the classification results can be represented by the confusion matrix with two rows and two columns reporting the number of true positives (TP), false positives (FP), false negatives (FN), and true negatives (TN).
From the confusion matrix, sensitivity and accuracy can be defined as:
Sensitivity measures the proportion of defect-prone modules correctly classified and Accuracy measures the proportion of samples correctly classified among the whole population. In addition to the Total-cost, it also adopts the Sensitivity and Accuracy of the classification results as evaluation measures.
5. PERFORMANCE EVALUATION
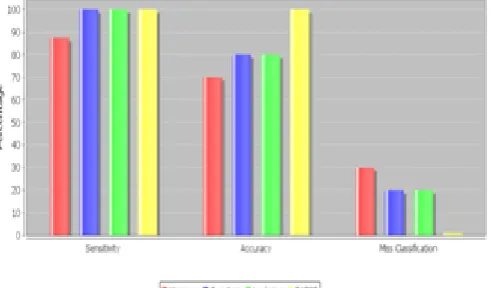
[image:4.595.312.539.201.310.2]Analysis is done on the four methods and selects the most appropriate one. Fig 5.1 shows the graphical representation of the four methods Variance score, Laplacian score, Constraint score and EAFSC in terms of Accuracy, Sensitivity and Misclassification cost. Accuracy and Sensitivity of the EAFSC method is more than all other methods. Also the misclassification cost is almost zero in the case of EAFSC method. From this it will understand the proposed method outperforms all the methods.
Fig 5.1 Algorithm Comparison in terms Sensitivity, Accuracy and Misclassification cost.
[image:4.595.41.287.543.687.2]To verify the efficiency of the proposed method, extensive experiments are performed in datasets. The experiment is conducted by comparing training data and test data by applying the four methods- Variance Score, Laplacian score, Constraint score and EAFSC. In terms of CPU utilization the proposed system scores high when compared to other independent methods.
Fig 5.2 CPU Utilization Graph
6. CONCLUSION
Here a novel architecture for software defect prediction is proposed. This architecture involves evaluation and prediction. In the evaluation stage, three filter type feature selection methods are evaluated and proved that the best one is the combination of three methods. Then in the prediction stage, the predictor is finally used to predict defect on the test data. To improve the sensitivity and accuracy cost sensitive boosting method is proposed, where the cost information is utilized not only in the advanced classification stage but also in the advanced feature selection stage. This architecture is more stable. Experimental results demonstrate that the proposed cost sensitive boosting method outperform TSCS methods.
In the current experiments, public software defect prediction data sets from NASA projects are used. Any other software defect data could be used to further validate the proposed methods. As a future work a generalized equation can be developed for Enhanced Algorithm for Feature Selection and Categorization. This may further improve the efficiency and reduce the complexity of the proposed method. Also a method can be developed to identify the reasons for the defective data and rectify that problem.
REFERENCES
© 2015, IRJET ISO 9001:2008 Certified Journal
Page 1465
[2] J. Munson and T. M. Khoshgoftaar, “Regressionmodelling of software quality: empirical investigation,” J. Electron. Mater., vol. 19, no. 6, pp. 106–114, 1990.
[3] N. B. Ebrahimi, “On the statistical analysis of the number of errors remaining in a software design document after inspection,” IEEE Trans. Softw. Eng., vol. 23, no. 8, pp. 529–532, 1997.
[4] S. Vander Wiel and L. Votta, “Assessing software designs using capture-recapture methods,” IEEE Trans. Softw. Eng., vol. 19, no. 11, pp. 1045–1054, 1993.
[5] P. Runeson and C. Wohlin, “An experimental evaluation of an experience-based capture-recapturemethod in software code inspections,” Empirical Softw. Eng., vol. 3, no. 4, pp. 381–406, 1998.
[6] L. C. Briand, K. El Emam, B. G. Freimut, and O. Laitenberger, “A comprehensive evaluation of capture-recapture models for estimating software defect content,” IEEE Trans. Softw. Eng., vol. 26, no. 6, pp. 518–540, 2000. [7] K. El Emam and O. Laitenberger, “Evaluating capture-recapture models with two inspectors,” IEEE Trans. Softw. Eng., vol. 27, no. 9, pp. 851–864, 2001.
[8] C. Wohlin and P. Runeson, “Defect content estimations from review data,” in ICSE ’98: Proceedings of the 20th International Conference on Software engineering. Washington, DC, USA: IEEE Computer Society, 1998, pp. 400–409.
[9] Q. Song, M. Shepperd, M. Cartwright, and C. Mair, “Software defect association mining and defect correction effort prediction,” IEEE Trans. Softw. Eng., vol. 32, no. 2, pp. 69–82, 2006.
[10] A. Porter and R. Selby, “Empirically guided software development using metric-based classification trees,” IEEE Software, vol. 7, pp. 46–54, 1990.
[11] J. C. Munson and T. M. Khoshgoftaar, “The detection of faultprone programs,” IEEE Trans. Softw. Eng., vol. 18, no. 5, pp. 423–433, 1992.
[12] V. R. Basili, L. C. Briand, and W. L. Melo, “A validation of objectoriented design metrics as quality indicators,” IEEE Trans. Softw.Eng., vol. 22, no. 10, pp. 751–761, 1996. [13] T. M. Khoshgoftaar, E. B. Allen, J. P. Hudepohl, and S. J. Aud, “Application of neural networks to software quality modeling of a very large telecommunications system,” IEEE Trans. Neural Networks, vol. 8, no. 4, pp. 902–909, 1997.
[14] T. M. Khoshgoftaar, E. B. Allen, W. D. Jones, and J. P. Hudepohl, “Classification tree models of software quality over multiple releases,” in Proceedings of the 10th International Symposium on Software Reliability Engineering, Washington, DC, USA, 1999, p. 116.
[15] K. Ganesan, T. M. Khoshgoftaar, and E. Allen, “Case-based software quality prediction,” Int’l J. Software Eng. and Knowledge Eng., vol. 10, no. 2, pp. 139–152, 2000. [16] K. El Emam, S. Benlarbi, N. Goel, and S. N. Rai, “Comparing case-based reasoning classifiers for predicting
high risk software components,” J. Syst. Softw., vol. 55, no. 3, pp. 301–320, 2001.
[17] T. M. Khoshgoftaar and N. Seliya, “Fault prediction modeling for software quality estimation: Comparing commonly used techniques,” Empirical Softw. Engg., vol. 8, no. 3, pp. 255–283, 2003.
[18] “Analogy-based practical classification rules for software quality estimation,” Empirical Softw. Engg., vol. 8, no. 4, pp. 325–350, 2003.
[19] L. Guo, Y. Ma, B. Cukic, and H. Singh, “Robust prediction of fault-proneness by random forests,” in ISSRE ’04: Proceedings of the 15th International Symposium on Software Reliability Engineering, Washington, DC, USA, 2004, pp. 417–428.