© 2015, IRJET ISO 9001:2008 Certified Journal Page 139
DETECTION OF TRANSIENT AND HARMONICS DISTURBANCES USING
DISCRETE WAVELET TRANSFORM AND ANN.
Ishita Dupare, Pankaj Hedao, Abhay Satmohankar
1 Student, Electronics Engineering, WCEM, Maharashtra, India
2Asst. Professor, Electronics Engineering, WCEM, Maharashtra, India
3 Asst. Professor, Electronics Engineering, WCEM, Maharashtra, India.
Abstract:
In power system power quality problems exists in India. Increase in power quality disturbance i.e. harmonics & transients in the power system affecting the load side severely and decreasing the life of load side equipments .So the detection of this disturbance has become big concern in India. This paper deals with detection of power quality disturbance including both transient and harmonics using wavelet transform. Various features have been extracted by decomposing the signals of harmonics and transients. By which it is easy to classify the category of disturbance.ANN is used as a classifier for classification.Keywords— Power quality, classification, DWT, feature extraction, ANN
I.
INTRODUCTION
Power quality is usually defined as the study of the quality of electrical signal. In the recent years with the growing use of non-linear loads, power electronics based equipment etc., Power quality (PQ) has become a big concern. Poor PQ has consequences such as; malfunctions, instability, shortened life of the equipment etc. Power quality disturbances like; voltage sag, voltage swell, notches, glitches, momentary interruption, harmonic distortions, transients etc. have become common in today’s power system. In order to improve the quality of the electric power, the sources and causes of such disturbances must be known .These PQ disturbances are non-stationary in nature and occur for short duration. IEEE 1159-2009 defines these disturbances in terms of their frequency content, magnitude and duration [1].
There are different signal processing methods are employed for the analysis of these PQ signals. Fourier transform gives amplitude frequency representation while the time information gets void is one of the methods for transformation of these signals. Hence Fourier transform has some limitations for analysis of the signal. The windowed version of Fourier transform is Short time Fourier transform (STFT). Short time Fourier transform
(STFT) is the modified version of the Fourier transform which solves some drawbacks of the Fourier transform but it still have a drawback of time-frequency resolution dependent on the fixed window width[2]. Wavelet transform is further modified version of Fourier transform which can fetch frequency and time information simultaneously. It makes this transformation method suitable for the analysis of non-stationary signals. Wavelet transform is again classified into two types continuous wavelet transform and discrete wavelet transform. The discrete version of wavelet transforms; discrete wavelet transform (DWT) is used in this work for the analysis of the PQ signals [3]. So in order to classify the PQ disturbances properly wavelet transform is used. Various features can be extracted using discrete wavelet transform (DWT). There are various literatures proposed which show classification using DWT like; Multi level decomposition of signals is done using DWT, a combined feature vectors are obtained using standard deviation and energy of signals to fed SVM as classifier [3]. Energy distribution pattern of distorted signals are used as feature to classify the PQ disturbances using neural network [4].
© 2015, IRJET ISO 9001:2008 Certified Journal Page 140
II. DESCRETE WAVELET TRANSFORM
The wavelet analysis block transforms the distorted signal into different time-frequency scales. Wavelet analysis employs the expansion and contraction of basis function to detect simultaneously the characteristics of global and local of measured signal .Discrete wavelet transform digital filtering technique is used to decompose the signal at
different level. The composite signal is decomposed into two half sub-bands frequency signal. One band contains high frequency components i.e. detail and another frequency band contains lower frequency components known as approximate signal. The number of samples will be halved at each decomposition level [6].
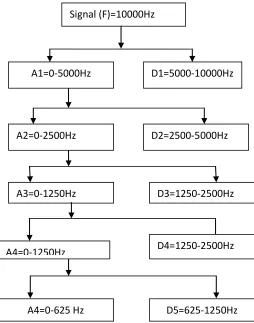
Multilevel signal decomposition is done. The signal can be decomposed to ‘N’ level to filter out high frequency components.fig 1 shows the multilevel decomposition of the signal .Here signal F is decomposed to fetch another system.
In DWT multi level decomposition of the signal can be done. The signal can be decomposed into ‘N’ levels in order to filter out the high frequency component present in the signal. A1 of Fig. 1 is again decomposed to fetch further information present in the signal. This is called multi level decomposition. Since the analysis is repetitive, the decomposition can be done until the details consist of one sample (i.e. single sample). Therefore the appropriate level of decomposition should be selected for suitable criterion [6,7].The approximations coefficients and detail coefficients are used for detecting the signal disturbance.
The approximation coefficients (A1), the detail coefficients (D1) at the first level and approximation coefficients (A2), the detail coefficients (D2) are considered for disturbance recognition and categorization of the power signal. Fig. 1 shows five level decomposition of the signal. In fig 1 signal of 10 KHz frequency is decomposed further by fetching it to level 1 decomposition. The decomposed lower frequency component of A1 further fetched for decomposition & so on for filtration of the lower frequency signal. Here 7 level decomposition is done. The signals are acquired at 20 kHz sampling frequency.
[image:2.612.315.569.204.527.2]
Fig.1 Multi-level decomposition of signal.
III FEATURE EXTRACTION USING DWT
Feature extraction is the operation that transforms a pattern from its original form to a new form suitable for further processing. This feature extraction is done by using DWT from simulated PQ signal for proper classification. The simulations of various signals containing both harmonics
and transient disturbances are done using
MATLAB.Transient disturbances are created by capacitor switching& harmonics are created by varying non nonlinear load across the rectifire.The analysis is done on various
Signal (F)=10000Hz
D1=5000-10000Hz A1=0-5000Hz
A2=0-2500Hz D2=2500-5000Hz
A3=0-1250Hz D3=1250-2500Hz
D5=625-1250Hz D4=1250-2500Hz
© 2015, IRJET ISO 9001:2008 Certified Journal Page 141 simulated PQ disturbances which are acquired at a sampling
frequency of 20 kHz to get features[7,8].
0 0.01 0.02 0.03 0.04 0.05 0.06 0.07 0.08 0.09 0.1 -1
-0.5 0 0.5 1 1.5x 10
4
Time
M
a
g
n
it
u
d
e
(a)
0 0.05 0.1 0.15 0.2 0.25 0.3 0.35 0.4
-1 -0.8 -0.6 -0.4 -0.2 0 0.2 0.4 0.6 0.8 1x 10
4
Time
M
a
g
n
it
u
d
e
[image:3.612.302.575.65.416.2](b)
Fig. 2 Simulated power quality signals. (a) Transient signal, (b) Harmonics signal.
The signal acquired using different methods is decomposed into 7 levels using discrete wavelet transform.
Fig 3(a) & (b) shows the 7 level decomposition of the signal having transient and harmonics disturbance respectively. Here S is the original signal, a7 is the approximation of decomposed signal having fundamental frequency. Plots d1 to d7 are the details. Detail d2 and d3 have maximum magnitude.
maximum efficiency. Third stage is testing the neurons which are trained at first stage is tested in order to measure the performance of the network.
© 2015, IRJET ISO 9001:2008 Certified Journal Page 142 Fig. 3(b) 7 level decomposition of the harmonics signaL
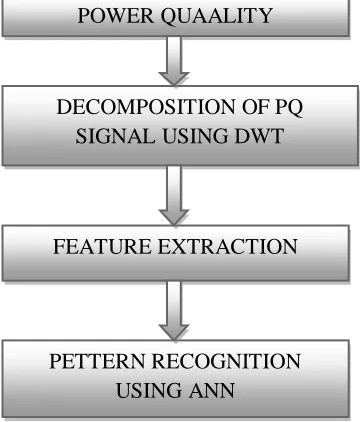
Fig. 4 Flow chart to detect PQ disturbances.
a)
Maximum deviation of d1:
[image:4.612.41.554.58.445.2]Table 1 shows the maximum deviation analysis of the decomposed signal of level one i.e. d1 as we collected the maximum and minimum values for the two disturbance signals i.e. harmonics & transient.
Table 1: min & max value of max(d1)
Max(d1) Min Max
Transient 17.23479384 40.09063352
harmonics 3.42579519 30.01438171
IV PATTERN RECOGNITION USING ANN
In pattern recognition problems, we are using neural network to classify inputs into a set of target categories.The Neural Network Pattern Recognition Tool helps us to select data, create and train a network, and evaluate its performance using mean square error and confusion matrices.
[image:4.612.37.288.91.379.2]
Fig 5. Block diagram of ANN.
Fig 5. Shows a two-layer feed-forward neural network, with hidden and output neurons. Training of ANN consist of three stages, First stage is initial training the inputs are fed to the ANN according to which the neurons get trained by recognizing the pattern of the input. Second stage is validation used to measure network generalization and it determines when to stop the training in order to get
V RESULT AND CONCLUSION
110 signals were collected using feature extraction method. Out of the total signals 30% is used for
training neuron &70%used for testing the signals.32 signals were used for training purpose & 78 signals were used for testing purpose.Fig.6 shows the output of ANN testing result of signal by neurons. First row first column shows that 47 transient signals were detected & 31 harmonics signals were detected.
POWER QUAALITY DISTURBANCE
DECOMPOSITION OF PQ SIGNAL USING DWT
FEATURE EXTRACTION
PETTERN RECOGNITION USING ANN
DETECTION OF PQ DISTURBANCE
INPUT HIDDEN
LAYER
OUTPUT
LAYER
[image:4.612.65.245.427.638.2] [image:4.612.307.559.461.503.2]© 2015, IRJET ISO 9001:2008 Certified Journal Page 143 Fig.6 Output of ANN
VI REFERENCES
[1] Kamble. S, Naik.C.A, Kndu.P, “Detection of Simultaneous transient and harmonics disturbances employing DWT”IEEE conference on microelectronics commnications and renewable energy, kanjirapally, june - 2013
[2] IEEE recommended practice for monitoring electric power qality, IEEE std. 1159-2009 (revision of IEEE std 1159-1995) [3] Rob polikar,” the Engineer’s ltimate guide book to wavelet analysis”.
[4] S.Santos. E.J.Powers, W.M. Grady and P.Hofman, “power quality assessment via wavelet transform analysis,” IEEE trans. Power delivery, vol. 11, no.2m pp.924-930, april 1996.
[5] G.T. heydt and A.W.Galli”Transient power qality problems analyzed using wavelets,” IEEE trans. Power delivery, Vol,12 no.2, pp 908-915, April 1997.
[6] S.Suja and jovithq jerome,” power signal distrbance classification using wavelet based neural network” serbian jornal of electrical engineering vol 4 no 1 pp 71-83, jne 2007.
[7] Cagri kocaman and muammer ozdemir,: comparassion of statical methods and wavelet energy coefficients for determining two common PQ disturbances,Sand and swell” IEEE trans. Power delivery, Vol 5 pp80-84, nov 2009.
[8] IEEE std. 1366-2003,” IEEE Gide for electric power distribution relibility indices.”.
[9] Z.L.Gaing “wavelet based neural network for power disturbance recognition and classification”, IEEE Trans.Power delivery,Vol 19,pp 1560-1567, oct - 2004
[10] Zwe-lee Gaing,Member IEEE, “ wavelet based neural network for power distrbance recognization and classification”, IEEE trans.