2018 International Conference on Computer, Electronic Information and Communications (CEIC 2018) ISBN: 978-1-60595-557-5
Intelligent Park Automatic Demand Respond Characteristic Analysis
Based on Optimal Fuzzy C-means Clustering Algorithm
Jian-cheng YU
1, Si-wei LI
2, Liang YUE
2, Jie ZHANG
2,
Yong-li WANG
3and Jia-pu LI
31Stage Grid Tianjin Electric Power Company, Hebei District, Tianjin 300010, China
2
Fibrlink Corporation Stage Grid Information and Telecommunication Group, Beijing 100070, China 3
School of Economics and Management, North China Electric Power University, Changping District, Beijing 102206, China
Keywords: Intelligent park, Automatic demand response, Electric fuzzy clustering, Fuzzy C-means.
Abstract. Firstly, This paper introduces automatic demand response technology and fuzzy C-mean clustering algorithm, then An algorithm based on fuzzy C means clustering is used to cluster analysis of the daily load data of a distribution station in a certain Eco-city, and the optimal number of load clustering is calculated, and the optimal load clustering results are obtained. At last, this paper summarizes the load response characteristics of various types, and provides a research idea for the cluster analysis of demand response to user load characteristics.
Introduction
The global energy Internet is characterized by clean energy, UHV and smart grid technology, Intelligent park is a typical load system for building the energy Internet at the end of the user's terminal. The key to the realization of the automatic demand response technology in the intelligent park is the comprehensive planning of the user's side load and resources, and study the actual curve characteristics of the user load and the load response characteristics of different types of users, implement the automatic demand response scheme for different types of user loads, So as to improve the security, stability and reliability of power supply in the transmission and distribution network, To realize the improvement of energy efficiency of regional users, as well as the safe use of electricity, intelligent electricity, energy saving, energy saving, environmental protection and orderly use of electricity, has become one of the new hot topics to study the technology of energy Internet demand response.
To sum up, clustering load according to the characteristics of user load is difficult to meet the management needs of lean and complex power demand side only by classifying the load according to the traditional load classification method, Combining the load clustering technique based on the actual load curve and the automatic demand response technology of electric power, using cluster algorithm to cluster analysis of user load according to the characteristic of actual curve, Responding to different load characteristics from different load types, combining the actual demand response characteristics of regional users and the configuration of user side demand respond resources like energy storage device and distributed generation, Develop a different response scheme and implement an automatic demand response in the region. As the result, The power demand response scheme is more scientific and more feasible, and it also makes the power demand side management more systematic and targeted.
Fuzzy C-means Clustering Algorithm
Clustering algorithm, which is known as cluster analysis, is a statistical analysis method to study the classification of samples or indicators, and it is also an important algorithm for data mining. The analysis consists of a number of clustering, it can often be a metric vector, or a point in a multidimensional space, clustering analysis based on similarity and clustering in a set, membership between the elements between elements in the same cluster has more similarity. FCM algorithm is a flexible clustering method based on fuzzy partition. It optimizes the objective function to get the membership degree of every sample point to all the class centers, and determines the class of the sample points to achieve the purpose of automatically classifying the sample data. At present, there are many ways to load classification based on actual load curve. As one of the most widely used classification algorithms for power load characteristics, Fuzzy C means clustering algorithm is more ideal than other algorithms in terms of running time, accuracy of algorithm results, algorithm stability and final clustering effect[5].
In FCM algorithm, For the given set of dataX ={x1,x2,...,xn},
S j R
x ∈
,That is, each sample in the data set is a S dimensional vector, divide X into c(2≤c≤n) classes, The set of vector sets of each cluster center is set to V ={v1,v2,...,vc},The membershipxj degree of the data samples belonging to the class cluster center iis uij∈[0,1],
∑
== =
c
i
ij j n
u 1
,..., 2 , 1 , 1
.The objective function of FCM is the sum of the product of the degree of membership and the Euclidean distance between the point and the cluster center. The FCM algorithm is the partition matrix U and the cluster center matrix C, which minimizes the clustering objective function. The expression of the objective function of the algorithm :
2 1 1 )
,
( ij
c
i n
j m ijd
u V
U
J
∑∑
= =
=
(1) In the formula (1), d is the Euclidean distance between the sample xj and the cluster center i
v
.the algorithm is d= xj−vi ,and mis the fuzzy weighting coefficient that represents the degree of fuzziness of the classified matrix. The membership degreeuij and the calculation formula of the cluster centervi are shown in the following formula:
∑
=
− =
c
y
m yj ij ij
d d u
1
1 2
) / (
1
∑
∑
= = = n j m ij n j j m ij i u x u v 1 1 (3) The implementation of the FCM algorithm is to iteratively update the clustering center matrix C and the membership matrix U. The specific iterative steps of the algorithm are as follows:Step l: given the number of load clustering c, fuzzy weighting index m and iterativeε stopping threshold, take k to be 0, initialization of the membership degree matrix U0and cluster center matrix C0.
Step 2: update Uk According to the formula (2),∀i,j,if k ij d >0, then 1 ) 1 /( 2 1 ) ( − − = =
∑
m c r k rj k ij k ij d d u=0, then =1 k ij
u
and j≠k, =0. k ij
u
(4) Step 3: update Ck+1 According to the formula(4) :
∑
∑
= = + = n j m k ij n i j m k ij k i u x u c 1 1 1 ) ( ) ( (5) Step4: Computational objective function according to the formula (2),if − <ε
+1 k k
C C
, then Then stop the iteration, the clustering results are output. If not, take k=k+1, back to step 2.
The clustering validity of the FCM clustering algorithm needs to be tested to judge the rationality of the results. In this paper, the clustering validity of the algorithm is analyzed from the index method of the possibility division of the clustering algorithm in [13]. The formula is as follows:
] 1 ) ( [ ) ( max ) ( min , 2 1 2 1 1 1 2 1 1 1 2 1 1 1 1
∑
∑
∑∑
∑
∑
∑
∑
∑
= = = = = = = = = = = − − − + = n i n i i i c j n i j i ij c j n i ij n i ij n i ij c j n i ij c j x x x x u u c u u u c UP( )
(6)
n i
R
x m
j∈ , =1,2,..., is m-dimensional sample vector; c
i R
vi∈ m, =1,2,...,
is Cluster center;
} {uij U=
is Membership degree matrix.
The optimal value of the number of fuzzy clustering is checked and judged by calculating the clustering validity function, and the number of clusters corresponding to maximum values of clustering validity function is the best number of clustering.
Example Analysis
Example Scenario
intelligent public service network, The energy Internet in the region has diversified resources such as photovoltaic, wind power, unit, energy storage, controlled load that has Built smart home, automatic demand response, megawatt level microgrid, smart city comprehensive energy service platform and Integrated storage and storage scheduling platform for smart grid source network, the automatic demand response potential and the facilities conditions are ideal, Therefore, it is used as the selection of clustering data and the example object.
The operation of the automatic demand response system of the park requires the coordinated operation of the three modules of ADR, distribution network and users. The connection among the three modules depends on the power equipment, the distribution grid, the information flow and the energy flow. In these three modules, the user module is the base and the main object of the response, the ADR module is the "nerve center system", which affects the whole response system. The distribution network module is the top operation mechanism of the response system, which is responsible for the operation and promotion of the automatic demand response system and the related information collection work. Government departments play a regulatory role in the top level supervision of distribution networks and service providers, and also formulate relevant policy mechanisms.
Selection and Preprocessing of Daily Load Curve Data
In order to reduce the interference of other external conditions, such as time, environment, and other factors, The calculation example uses the 96 point daily load data of the 20 stations in the ecological city for 30 days, The typical daily load curve data are obtained by means of the mean, and the computational procedure are as follows:
96 day load curve selected from each distribution station from July 3, 2016 to August 3rd for January, then the mean value of each distribution station 30 days average daily load curve as the typical daily load curve in the time period of each distribution station.it is expressed as this formula:
] ,..., ,
[ i1 i2 in
i x x x
x =
Due to the large difference of load data in different scale distribution stations, the extreme sequence of typical daily load curves of each group is normalized (the normalized data
] 1 , 0 [ '
∈
ij
x
)The normalization formula is as below:
] ,..., ,
max[ 1 2 96 '
i i i
ij ij
x x x
x
x =
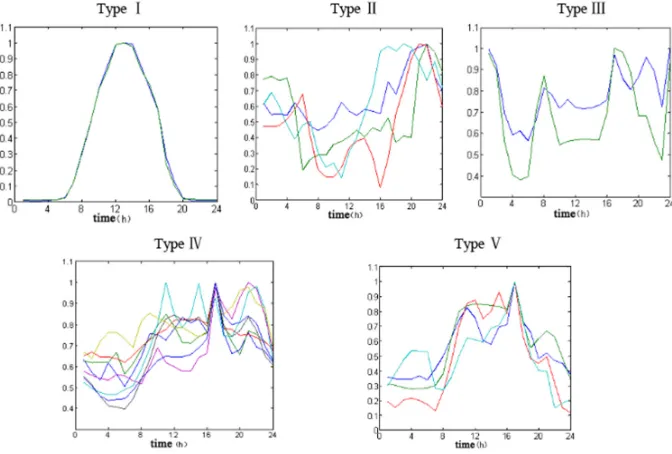
Figure 1. Cluster result type I to V of daily load curve.
From the final clustering results of 20 load data, we can see that each classification can clearly represent the load characteristics of a typical load, and the clustering results are ideal. For example, the load level of class I was stable at 0-6, and kept at a lower level, at about 6, the load level rose rapidly and reached the peak from 12 o'clock to 13 o'clock, then keeps down to 20 o'clock and keep low load level. The overall trend of class II load to rise after the first drop further, from 0 o'clock to 8 o'clock, the overall load tends to decline, and gradually increased from 16 o'clock to 20 o'clock to the load peak and begin to decline to close to 24 o'clock. Class III load increased steadily from 6 to 22, and reached a peak at 17 to 18 o'clock. The load type is similar to the distribution station of residential area, and the load level is at the highest level before and after dinner time. Group IV reached peak load at 8 o'clock and 17 o'clock respectively, the lowest load time was 4 to 6 AM, and the total load level of class V increased at first and then decreased, and reached the peak load at 5 PM.
According to the analysis of the above load cluster data, it can be concluded that for the whole system, in 0:00 to 4:00, it is necessary to respond to the low power load of class I and v when time during 0 o’clock to 4 o’clock. From 6 am to 4pm, 8pm to 24pm, the response measures to type IV and type I load response are needed respectively. In the peak response of the power load, The peak shaving response should be carried out for class II load at about 8 am, and the user load of class V should be involved in the peak shaving response from 10 o’clock to 17 o’clock. From 12 to 14 o’clock, class I load will also respond to the peak shaving response of the power load. From 16 to 17 pm, the users of class II and class III need to take part in the power load shaving response, from 17 to 22 PM, the demand response to the power load peeling is the user of the fourth class.
game relationship of load response is analyzed, and incentive measures are established. Similarly, we can encourage the residents to use load response devices such as washing machines and water heaters to fulfill the load filling in the low load period by charging the energy storage devices and subsidized incentives in the low load period, and through the cogeneration unit to adjust the cold, heat and electricity load peak, distributed photovoltaic power consumptive area, While ensuring the stability and reliability of the operation of the integrated energy system in the park, it plays an automatic demand response to the controllable load of the user.
By clustering analysis of the above user load, the power supply side makes different time sharing incentive strategies or time sharing optimization schemes for users with different load curve characteristics and different load response characteristics. It encourages users to participate in demand response, so as to achieve the goal of system planning and operation to improve the energy efficiency level of regional power users, and enhance the safety, stability and reliability of power grid operation.
Conclusion
Based on the FCM algorithm, this paper cluster analysis on the power load characteristics of the automatic demand response users in the Intelligent Park, introduces the automatic demand response technology and the fuzzy C mean clustering algorithm and implementation process, and applies the algorithm based on fuzzy C means clustering to cluster analysis of the daily load data of distribution stations in an eco city. The number of optimal load clusters is calculated by iteration, and the optimal load clustering results are obtained. The load response characteristics of each type are summarized, which provides a research idea for clustering analysis of load characteristics of users in response to demand.
In this paper, we use fuzzy C mean clustering algorithm to cluster the analysis of the characteristics of user power load, and use clustering validity function to optimize the number of clustering C, and get the optimal number of clusters, the clustering results of 96 point daily load curves of 21 stations in an ecological park from July 3, 2016 to August 3rd are output by iteration. Clustering results divide user load into 5 categories. According to different types of load characteristics, this paper puts forward differentiated time-sharing demand response intervals of different types of loads in the park system. The clustering results have ideal typicality and discrimination. Different clustering results can represent the user load of different curve characteristics, which can support the research on the load characteristics of the power users, and provide the basis and reference for the realization of the park's automatic demand response technology.
References
[1] Luo Dian-sheng, Wang Xing-kun. Research on the Framework of Smart Grid Load Forecasting Platform Based on Cloud Computing[J].Journal of Hunan University Natural Sciences, 2016, 43(02):101-108.
[2] Yan Huaguang, Chen Songsong, Du Chongyang. Research and Design of Power Demand Response Standard System About Smart Grid[J].Power System Technology, 2015, 39(10):2685-2689.
[3] Jun, Zhu Yanping, Peng Wenhao, Qi Bing, Cui Gaoying. Interactive Demand Response Method of Smart Community Considering Clustering of Electricity Consumption Behavior[J].Automation of Electric Power Systems, 2017, 41(17):113-120.
[4] Dong Qi-fen, Yu Li, Song Wen-zhan, Hong Zhen. Demand response for delay tolerant consumers in smart grid[J].Control Theory and Applications, 2017, 34(04):467-476.
Classification Technology Research Based on an Optimal Fuzzy C-means Clustering Algorithm[J].Journal of Zhengzhou University (Medical Sciences), 2015, 36(06):56-60.
[6] Xu Yuanbin, Li Guohui, Guo Kun, Guo Songrong, Lin Wei. Research on parallel clustering of power load based on improved K- Means algorithm[J]. Computer Engineering and Applications | Comput Eng Appl, 2017, 53(17):260-265.
[7] Chen Mingzhao, Mao Jian, Du Zonglin, Liu Junzhi. Analysis on demand side management scheme of industrial enterprise based on clustering method[J].Power System Protection and Control, 2017, 45(07):84-89.