2019 International Conference on Computation and Information Science (ICCIS 2019) ISBN: 978-1-60595-644-2
A Study of Bad Driving Behavior Based on
Improved K-Means Clustering and
Neural Network
Fujun Yang, Yi Zhang, Junpeng Chen, Qiang Yang
and Zhqiang Zhou
ABSTRACT
With the popularization of the Internet of Vehicles technology, excavating useful information from a large amount of driving behavior data to evaluate the driver's safe driving behaviors in real time, accurately and efficiently, is of great significance to improve the safety management level and transportation efficiency of road transportation process. Based on the driver's driving behavior characteristics and driving industry management standards, this paper proposes a bad driving behavior evaluation method based on improved k-means clustering and neural network. It uses the improved k-means clustering method to select typical sample points from the characteristic parameters extracted from the vehicle GPS positioning platform. The Backpropagation neural network algorithm is designed to learn the clustering results, and the online classification evaluation of bad driving behavior is realized. It provides a new direction for the transportation vehicle management department to carry out safety management of the road transportation process.
1. INTRODUCTION
As people's demand for automobiles continues to increase, China's car ownership has been increasing year by year. Automobiles bring convenience to people, but at the same time, environmental pollution and traffic safety problems are becoming more and more prominent. In recent years, due to the government's increasing emphasis on information
FujunYang, School of Computer Science, Southwest Petroleum University, Chengdu, 610500, China
Yi Zhang, School of Computer Science, Southwest Petroleum University, Chengdu, 610500, China
Junpeng Chen, School of Foreign Languages, Southwest Petroleum University, Chengdu, 610500, China
Qiang Yang, School of Computer Science, Southwest Petroleum University, Chengdu, 610500, China
technology in the transportation industry, more and more units and enterprises have begun to build satellite positioning systems for road transport vehicles. Satellite positioning systems, which collects driving behavior data of the automobile during driving to regulate the driver's driving behavior and ensure road traffic safety. Due to the above reasons, researching on traffic safety with bad driving behavior has attracted much attention. For example, using the vehicle trajectory data collected by the vehicle GPS module, a method for realizing the safety analysis of vehicle driving behavior is proposed, which provides a scientific basis for the bus traffic management department to evaluate and manage driving behavior [1].In addition, for the satellite positioning data, a method for identifying the illegal driving behavior with anti-noise is proposed, which identifies the driver's overspeed, unruly driving and other illegal driving behaviors[2]. And an improved PWARX identification model based on two clusters is proposed to identify the driver's driving behavior[3].
By comparison, it is found that the main method for studying the bad driving behavior of the car is to evaluate the driver's driving behaviors by extracting the original driving data in the vehicle satellite positioning system and extracting the extracted feature data. However, this evaluation method tends to be subjective therefore not scientific. Thus, this paper proposes a method based on improved k-means clustering and neural network to evaluate poor driving behaviors. This method extracts the characteristics of bad driving behaviors from the original vehicle GPS positioning platform. Firstly, the improved k-means clustering algorithm is used to screen out the outliers, and the typical sample points are obtained as the training set. The neural network is used for learning. The Backpropagation neural network is used to construct the driving behavior evaluation grading model, and the driver's driving behavior is dynamically evaluated to improve the accuracy of the identification of poor driving behaviors and to provide a new method for evaluating bad driving behaviors.
DRIVING BAHAVIORS EVALUATION PARAMETERS EXTRACTION
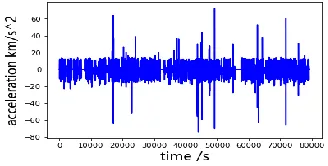
The data in this paper comes from a GPS vehicle positioning platform, a total of 450 vehicles, with each vehicle containing 80,000 information. The vehicle GPS platform can record the satellite positioning data and the driver's daily driving information during the working of the vehicle in real time, including the basic information such as the latitude, longitude, engine state, steering angle, GPS speed, and mileage of the vehicle. The following pictures show the original driving data of the platform:
(c)acceleration variation chart (d)driving route map
Figure 1. Original driving data display.
1.1 Definition of Vehicle Samples Information
A sample of a driving vehicleMiis defined as follows:
( , , , , , )
i i i i i i i
M t j w v S r (1)
Where i is vehicle number, tiis a certain time the vehicle is traveling, ji is the
longitude of the current vehicle, andwiis the latitude of the current vehicle. Where vi is the
driving speed of the vehicle, and ri is the current direction angle of the vehicle, that is, the
horizontal angle from the clockwise direction to the traveling direction from the north direction of the positioning point.
1.2 Construction of Driving Behaviors Evaluation Index System
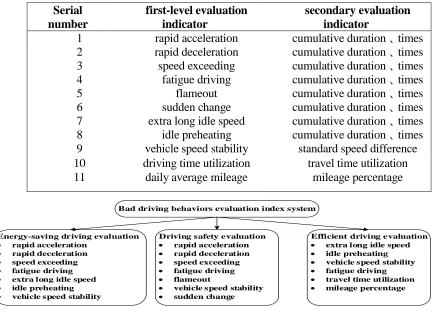
While referring to the relevant literature on bad driving behavior evaluation, this paper considers the driver's driving behavior from three aspects: driving safety, energy saving and efficiency.[6] It establishes an evaluation index system for bad driving behaviors, as shown in Figure 2.A total of 11 first-level evaluation indicators for bad driving behaviors were extracted, and corresponding secondary evaluation indicators were extracted from these first-level indicators, as shown in TABLE I.
The travel time utilization and mileage percentage formulas are as follows:
end start
T (2)
move
move stop T
T T (3)
TABLE I. BAD DRIVING BEHAVIORSEVALUATION INDEX. Serial number first-level evaluation indicator secondary evaluation indicator
1 rapid acceleration cumulative duration 、times
2 rapid deceleration cumulative duration 、times
3 speed exceeding cumulative duration 、times
4 fatigue driving cumulative duration 、times
5 flameout cumulative duration 、times
6 sudden change cumulative duration 、times
7 extra long idle speed cumulative duration 、times
8 idle preheating cumulative duration 、times
9 vehicle speed stability standard speed difference
10 driving time utilization travel time utilization
11 daily average mileage mileage percentage
Figure 2. Evaluation index system diagram.
The mileage percentage refers to the percentage of the mileage traveled by the vehicle on the day of the total mileage. See formula (3), whereis the utilization rate of the vehicle,
move
T is the length of travel of the transport vehicle, and Tstop is the length of rest of the
transport vehicle.
1.3 Driving Behaviors Evaluation Parameters Extraction
Then, according to the relevant traffic road behavior norms promulgated by the state, combined with the actual operation of the driver on the vehicle platform, the second-level evaluation indicators are scored. There are three common scoring models:
1 2 1 1 2 100 100 0.5 0.5 y t
y k n
y y y
(4) 1 2 4 1 2 100 480 0; 480 100 0.5 0.5 ; t y t
y k n
y y y
(5)
100; 0 20 80; 20 40 60; 40
y (6)
Bad driving behaviors evaluation index system
Energy-saving driving evaluation
rapid acceleration
rapid deceleration
speed exceeding
fatigue driving
extra long idle speed
idle preheating
vehicle speed stability
Driving safety evaluation
rapid acceleration
rapid deceleration
speed exceeding
fatigue driving
flameout
vehicle speed stability
sudden change
Efficient driving evaluation
extra long idle speed
idle preheating
vehicle speed stability
fatigue driving
travel time utilization
Where1,2, 3 and 4 are coefficients, and the specific values of the coefficients are determined according to the actual operation of the driver of the vehicle platform.tis the
cumulative time andnis the cumulative times.
According to the existing research direction [7], this paper adopts formula 4 for the evaluation of rapid acceleration, rapid deceleration, sharp change lane and speed exceeding behaviors, and adopts formula 5 for fatigue driving, flameout, super long idle speed and idle speed preheating driving behaviors. Formula 6 is adopted for the vehicle speed stability, the utilization of travel time and the average daily driving situation.
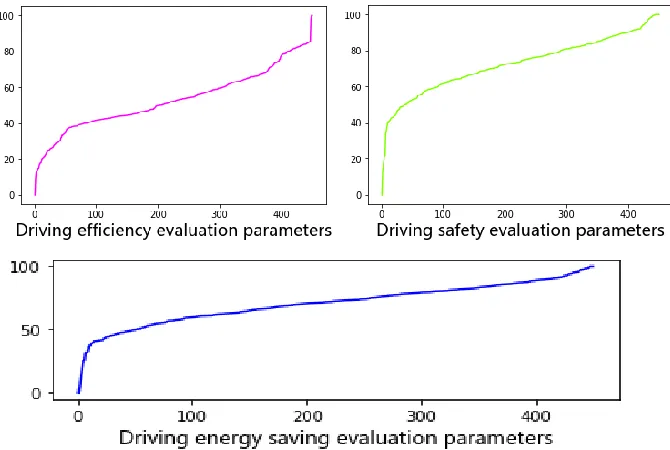
[image:5.612.148.483.269.494.2]After obtaining the evaluation results of each driving behavior, this paper refers to Liu Yingji's method [4], and uses the analytic hierarchy process to obtain driving behavior evaluation parameters from three aspects: safety, energy saving and efficiency. The evaluation parameters are shown in Figure 3:
Figure 3. Evaluation parameters.
2. DRVING BEHAVIORS EVALUTION ALGORITHM BASED ON IMPROVED
K-MEANS CLUSTERING AND NEURAL NETWORK
2.1 Traditional K-means Clustering Algorithm
The traditional k-means clustering algorithm selectsKsamples randomly from a given data set as input parameters. The n sample dataX { ,x x1 2,...,xn}is taken as the data set, where
1 2
( , ,..., )
T
j j j jd
x x x x is the d-dimensional vector. The goal of the k means- algorithm is to find the set { , ,..., }1 2
T k
1 ( , )
j i k j ii x S
E d x c
(7)
Where Siis the ith sample set, d x c( , )j i is the distance between the sample data and the cluster center. 1 2 2 2 1 ( , ) d
j i j i jl il
l
d x c x c x c
(8)
Where: 1
j i i j x c i c x n (9) ic is the center position of theith class,i=1,2,…k.nj is the number of sample data in
classci, andxjis the sample data in table ci.
2.2 Typical Sample Selection
However, the traditional algorithm has certain shortcomings. It relies on the central point. The initial cluster center point is completely randomly selected and therefore can easily falls into the local optimal solution. At the same time, according to the average value of all samples in the cluster class, the cluster center is calculated. If the cluster contains more noise points and more isolated points, it will have a great influence on the mean value, and the clustering result will have a large deviation. In order to eliminate the influence of noise and isolated points on the clustering results during clustering, and to cluster in the data with noise space, this paper proposes an improved clustering algorithm based onk means
-clustering and combines DBSCAN algorithm [5]. It filters out typical sample points in the sample set and removes points farther from the center point. The specific steps to improve the k-means clustering algorithm are as follows:
Step1: Forksample data points, each sample point is used as an initial center point, and
the distance of each other sample data to each center point is calculated by formula (8). Step 2: According to the distance, the sample is assigned to the class closest to it. Recalculate the value of the cluster center according to formula (9).
Step 3: If the cluster center does not change or satisfies the objective function formula (7), the class set(C C1, 2,...,Ci)will be obtained, whereCi( ,p p1 2,...,pni), niis the number of samples inCi.
Step 4: Calculate the distances of the two samples in classCi, respectively, to obtain the distance set Li, and find the minimum valuemin( )Li and the maximum valuemax( )Li in Li.
Step 5: Divide the interval[min( ), max( )]Li Li intoNintervals, and the number of samples in each interval is counted to obtain a matrix .
1 2
Where N is the interval number of min( )- max( )Li Li and N is the sample logarithm of the Nth interval.
Step 6: Label the interval number with the largest number of samples asm, and the
corresponding neighborhood radius parameterEpsiin Ci is calculated, that is, the center value corresponding to the distance of them-th interval sample:
min( )
2 (max( ) min( )) /
i
i i i
i i i
d
Eps D m d
d L L m
(11)
Step 7: Find all the sample sizes of the samples in classCiin the neighborhoodEpsi, and set the minimum value toMinPtsi.
Step 8: Iteratively performs the above steps to obtainEpsandMinPtsin each class, and the largestMinPtsis used as the a parameter of all classes, and the corresponding parameters are
(Eps1,MinPts)、(Eps2,MinPts)、…、(Epsi,MinPts).
Step 9: Randomly select any sample point to find the class to which it belongs. Under the condition of (Epsi,MinPts), if the point is a core point, treat it as a typical sample point. If the point is a non-core point, mark it as noise point while removing it.
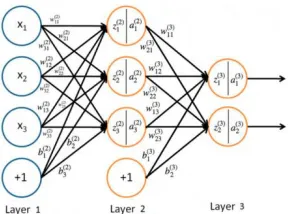
2.3 Backpropagation Neural Network Design
[image:7.612.348.492.486.593.2]Backpropagation neural network belongs to a branch of artificial neural network. Since its introduction, it has been widely used in image processing, pattern recognition, machine learning and other fields. Backpropagation neural network is a multi-layer feedforward network with threshold and weight adjustment through backpropagation algorithm. The learning algorithm is the steepest descent method. Through the back dissemination of the output error, the network connection weight coefficient and the threshold information are continuously adjusted to minimize the square error of the neural network, thereby achieving the desired requirement.
Figure 4. Typical cluster object. Figure 5. Backpropagation neural network.
[image:7.612.151.267.486.596.2]typical sample points selected are used as training samples, and a driving behaviors evaluation model[8] is obtained by Backpropagation neural network training. The driving behaviors are classified and evaluated by the model.
4. ANALYSIS OF EXPERIMENTAL RESULTS
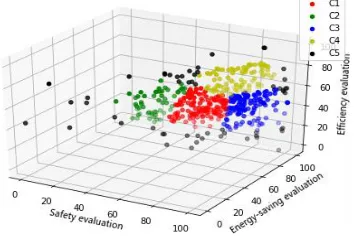
Based on the actual vehicle GPS platform data, this paper sets the clustering category to 4, and uses the improvedk means- algorithm for clustering. The clustering results are shown
in Figure7. The black points in the figure are off-group points, and the remaining points are typical sample points selected. It can be seen that the outliers screened by the improved
-k meansclustering is better, and the category 5 is distributed at the outermost periphery, and
[image:8.612.213.417.326.439.2]has no typical features. Safety evaluation, rapid acceleration, rapid deceleration, and speed exceeding have a greater impact on driving safety. While energy conservation evaluation, the occurrence of idle behavior such as ultra-long idle speed and idle speed preheating will lead to a decrease in energy-saving evaluation indicators. Also, efficiency evaluation, driving conditions and time utilization have a great impact on driving efficiency.
Figure 6. Cluster distance distribution.
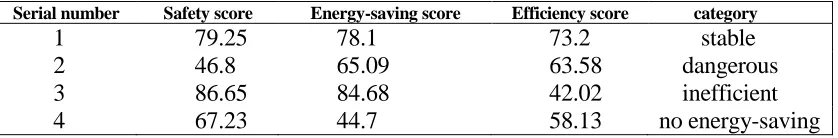
Category 1 belongs to the stable driving behavior in which the safety, energy saving and efficiency indicators are relatively stable. Category 2 is a more dangerous driving behavior with lower safety indicators. Category 3 is an inefficient driving behavior with low efficiency indicators. Category 4 is a non-energy-saving driving behavior with low energy-saving indicators[9].
TABLE II. IMPROVED 4 CLUSTER CENTERS OBTAINED BY K-MEANS CLUSTERING.
Serial number Safety score Energy-saving score Efficiency score category
1 79.25 78.1 73.2 stable
2 46.8 65.09 63.58 dangerous
3 86.65 84.68 42.02 inefficient
[image:8.612.99.518.617.686.2]Figure 7. Improved k-means clustering results. Figure 8. Neural network training effect.
According to the improved clustering results ofk means- algorithm, this paper uses the
typical samples selected as input variables to design a three-layer Backpropagation neural network, using 70% of the data set as the training set, 15% of the data as the verification set, and 15% of the data as the test set. The number of hidden neurons is 10, the number of output layer nodes is 1, and the output variable is the category of vehicle driving behavior. Neural network training effect Figure 8, uses the trained neural network model to achieve online classification and evaluation of driving behavior.
5. CONCLUSIONS
According to the driving data of a GPS vehicle platform, this paper constructs the corresponding evaluation index system and model, and extracts the corresponding bad driving behaviors evaluation parameters. The improvedk means- clustering algorithm is used
to screen the typical samples of driving behaviors, and the discrete points are removed. According to the clustering results, the representative samples are put into the Backpropagation neural network model for training, and the model trained by Backpropagation neural network is used to realize the online classification evaluation of bad driving behaviors. Effectively identify bad driving behaviors, and classify bad driving behaviors into four types: stable, relatively dangerous, inefficient, and non-energy-saving. From the perspective of data mining, it provides a scientific and feasible new direction for the evaluation of bad driving behaviors.
ACKNOWLEDGEMENT
Shengte Cup Research Project of Southwest Petroleum University, 2019-09-007.
REFERENCES
1. Ren, H.J., T. Xu and X. Li. 2014. "Driving Behavior Analysis Based on Trajectory Data Collected with Vehicle-mounted GPS Receivers," Geomatics and Information Science of Wuhan University, 39 (6): 739-744.
[image:9.612.107.284.73.191.2]3. Ying, H.N., Z.M. Tangand X. Han. 2019. "PWARX Driving Behavior Identification Model Based on Twice Clustering," Journal of Chong Qing Jiao Tong University (Natural Science), 38 (2) : 79-86. 4. Liu, Y.J., C. Zeng, S.J. Wang, Y. Yao and M.Y. Liu. 2018. "An Evaluation Method of Safety and
Energy-saving Driving Behavior Based on Satellite Positioning Data," Journal of Highway and Transportation Research and Development, 35 (1): 121-129.
5. Wang, Z.F., and G.L. Shan. 2017. "k-means based method for dynamically selecting DBSCAN algorithm parameters," Computer Engineering and Applications, 53(3): 80-86.
6. Xu, S.Q. "Monitoring System about the Influence of the Drivers’ Behaviors to Driving Safety and Energy Saving," Xi’an China: Chang’an University, 2015.
7. Xia, J. "Safety and Energy Saving Evaluation Method of Driving Behavior Based on Road Transportation Enterprise Safety Production Management Data," Beijing: Beijing Jiaotong University,2016.
8. Wu, Z.H., Z.C. Wu, J. Zhang, S. Chen and J. Chen. 2018. "Research on Driving Behavior Evaluation Based on Fuzzy C-means and Neural Network," Computer system application, 27(03): 263-267.