Ashford, Paul and Moss, David S. and Alex, A. and Yeap, S.K. and Povia,
Alice and Nobeli, Irene and Williams, Mark A. (2012) Visualization of variable
binding pockets on protein surfaces by probabilistic analysis of related
structure sets. BMC Bioinformatics 13 , p. 39. ISSN 1471-2105.
Downloaded from:
Usage Guidelines:
Please refer to usage guidelines at
or alternatively
BIROn -
B
irkbeck
I
nstitutional
R
esearch
On
line
Enabling open access to Birkbeck’s published research output
Visualization of variable binding pockets on protein
surfaces by probabilistic analysis of related structure sets
Journal Article
http://eprints.bbk.ac.uk/5657
Version: Published (Refereed)
Citation:
© 2012
BioMed Central Ltd
Publisher version
______________________________________________________________
All articles available through Birkbeck ePrints are protected by intellectual property law, including copyright law. Any use made of the contents should comply with the relevant law.
______________________________________________________________
Deposit Guide
Contact: [email protected]
Ashford, P. et al (2012)
Visualization of variable binding pockets on protein surfaces by
probabilistic analysis of related structure sets–
M E T H O D O L O G Y A R T I C L E
Open Access
Visualisation of variable binding pockets on
protein surfaces by probabilistic analysis of
related structure sets
Paul Ashford
1, David S Moss
1, Alexander Alex
2, Siew K Yeap
2, Alice Povia
1, Irene Nobeli
1*and Mark A Williams
1*Abstract
Background:Protein structures provide a valuable resource for rational drug design. For a protein with no known ligand, computational tools can predict surface pockets that are of suitable size and shape to accommodate a complementary small-molecule drug. However, pocket prediction against single static structures may miss features of pockets that arise from proteins’dynamic behaviour. In particular, ligand-binding conformations can be observed as transiently populated states of theapoprotein, so it is possible to gain insight into ligand-bound forms by considering conformational variation inapoproteins. This variation can be explored by considering sets of related structures: computationally generated conformers, solution NMR ensembles, multiple crystal structures, homologues or homology models. It is non-trivial to compare pockets, either from different programs or across sets of structures. For a single structure, difficulties arise in defining particular pocket’s boundaries. For a set of conformationally distinct structures the challenge is how to make reasonable comparisons between them given that a perfect structural alignment is not possible.
Results:We have developed a computational method, Provar, that provides a consistent representation of predicted binding pockets across sets of related protein structures. The outputs are probabilities that each atom or residue of the protein borders a predicted pocket. These probabilities can be readily visualised on a protein using existing molecular graphics software. We show how Provar simplifies comparison of the outputs of different pocket prediction algorithms, of pockets across multiple simulated conformations and between homologous structures. We demonstrate the benefits of use of multiple structures for protein-ligand and protein-protein interface analysis on a set of complexes and consider three case studies in detail: i) analysis of a kinase superfamily highlights the conserved occurrence of surface pockets at the active and regulatory sites; ii) a simulated ensemble of unliganded Bcl2 structures reveals extensions of a known ligand-binding pocket not apparent in theapo crystal structure; iii) visualisations of interleukin-2 and its homologues highlight conserved pockets at the known receptor interfaces and regions whose conformation is known to change on inhibitor binding.
Conclusions:Through post-processing of the output of a variety of pocket prediction software, Provar provides a flexible approach to the analysis and visualization of the persistence or variability of pockets in sets of related protein structures.
Background
The availability of a protein’s 3D structure may provide
insight into its mechanism and a basis for rational design of small molecule modulators of its function. Key to understanding and modifying function in many
proteins is knowledge of the structure of potential bind-ing sites. Rational drug design strategies may then be used to design small molecules that bind to complemen-tary features of such sites. In the absence of a structure containing a ligand, computational tools allow predic-tion of small molecule binding sites by scanning the
protein’s surface for pockets. These pockets must at
least be of a size and shape that allows a ligand to bind with suitable specificity and affinity. Existing computa-tional tools use a variety of methods to identify pockets,
* Correspondence: [email protected]; [email protected]. uk
1
Institute of Structural and Molecular Biology, Department of Biological Sciences, Birkbeck, University of London, Malet Street, London WC1E 7HX, UK Full list of author information is available at the end of the article
the simplest are based on local geometry and include PASS [1], LIGSITE [2], Pocket [3], PocketPicker [4], SURFNET [5], CAST [6] and fpocket [7]. Additional properties can be employed in pocket prediction, for example, LIGSITE-csc [8] and Concavity [9] combine structural information with sequence conservation scores, and Q-Site Finder [10] considers the energy of
binding of hydrophobic probes to the protein’s surface.
It has been shown that the application of these tools to the analysis of individual static structures is useful in identifying a primary binding site [11,12], such as an
enzyme’s active site. However, proteins in solution are
dynamic entities that explore conformational space over time due to side chain motions, local backbone flexibil-ity and larger sub-domain or domain motions [13]. It follows that predictions of pockets based on single static structures may fail to detect potential binding sites, or features of such sites, that result from changes in their shape and size over time. The conformational selection hypothesis posits that bound conformations of proteins are often observed as transiently populated, high
free-energy conformations of theapoprotein. Ligand binding
simply lowers the free-energy of the binding-capable conformation, thus increasing the probability and popu-lation of this state [14]. It is thus supposed that some points of the conformational space dynamically explored
by theapoprotein correspond to the pocket
conforma-tion of a ligand-bound form. Therefore, we can expect to gain insight into binding-capable pockets from inspecting conformational variants of proteins. Sets of variants can be derived from several sources: simulated ensembles created using Molecular Dynamics (MD) [15,16], Essential Dynamics (ED) [17], Normal Mode Analysis (NMA) [18] or constraint-based methods such as CONCOORD [19] and tCONCOORD [20]; solution-NMR conformational ensembles; multiple structures of the same protein solved in different crystal forms, or with different ligands or experimental conditions. It has also been shown that the structure-space explored within sets of homologues correlates with that observed with MD simulations [21], consequently homologous superfamilies of proteins provide other potentially useful sets of variant structures.
Difficulties comparing predicted pockets between different programs or across related structures
Given a set of related protein structures, how do we compare their pockets and the variation within the set?
An approach is to designate particular pockets, ‘Pocket
A’, ‘Pocket B’, etc., and in each case perform some
detailed analysis of the pocket’s geometry and other
characteristics. This can be effective with a single,
highly-conserved pocket, such as an enzyme’s active site
[22]. However, a problem is that it is not clear how to
consistently and unambiguously define each pocket in terms of its boundaries in cases where there are many possible sites i.e. are neighbouring pockets best consid-ered as two distinct entities, or as part of a single con-tiguous whole (for discussion see [23,24])? An additional complication is that for any given single structure we can obtain different predicted pockets depending on which software we choose to run. A simple case of two
different programs’ (PASS and LIGSITE) outputs for a
single structure of human interleukin-2 (IL-2) is illu-strated in Figure 1A, which shows only partial overlap of the clusters of pocket points for the two programs. In comparing pockets predicted in homologues, the issue is to identify whether apparent differences in pocket loca-tions are simply a result of problems with structural alignment (Figure 1B). The visual comparison of pockets in diverse conformations of a single protein can also be affected by difficulties with alignment. Figure 2 illus-trates how the spread of PASS predicted pocket points increases with the number of conformations used, an effect caused both by local structural variations and dif-ferences in global orientation required to produce the best overall alignments of the structures.
Analysing a large set of conformers may help identify structural variation in otherwise persistent pockets, and transient pockets that are observed in only some mem-bers of the set. Finding evidence of variable or transient pockets may suggest novel targets and provide a useful adjunct to rational drug design strategies. Recent ana-lyses have addressed the evidence for transient pockets by applying PASS to snapshots of MD trajectories of a
member of the B-cell lymphoma family (Bcl-XL), human
IL-2 and mouse double minute 2 (MDM-2) [25] and identifying pockets across snapshots by clustering on pocket volume and the overlapping pocket-lining resi-dues, finding several distinct transient pockets in these systems. In a follow-up study, tCONCOORD produced
comparable pockets to the MD simulations for Bcl-XL
analyses of predicted pocket variation across any suita-ble set of related protein structures. The approach of
first mapping the location of pockets to the protein’s
atoms and residues removes the art factual influence of differences in global orientation of structurally aligned sets and provides for weighting of probability densities by residue conservation. Consequently, the method is particularly advantageous in analyses of sets of confor-mers or homologues that differ markedly in structure.
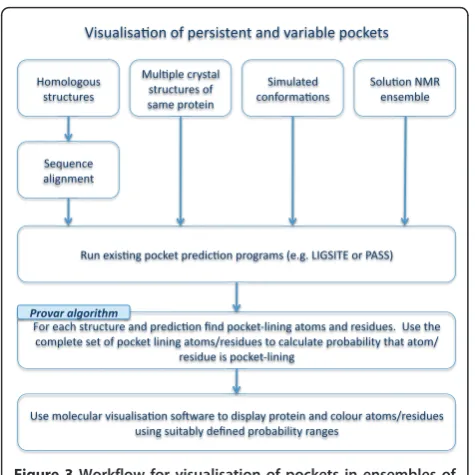
Algorithm
We have developed a method that gives visual insight into the variability of predicted pockets whilst overcom-ing the difficulties outlined above. A flowchart outlinovercom-ing the potential utilization of the method to analyse/iden-tify regions of interest using multiple pocket predictions is given in Figure 3.
At the heart of the approach is an algorithm, Provar (Probability of variation), for automatically identifying and scoring pocket-lining residues or atoms, which is
outlined in Figure 4. For each set ofnrelated structures
{s1,s2,si,...,sn}, we also haven pocket predictions{d1,d2,
di,...,dn} from programs such as PASS or LIGSITE
whose predictions are collections of points in space. Together we have a set of pairs of structures and predic-tions: {{s1,d1},{s2,d2},{si,di}...,{sn,dn}}. For each of these
matched pairs (i), Provar determines that an atom (k) of
a structure is pocket-lining if it lies within a parameter-defined cut-off distance of any pocket prediction point
and gives it a score of 1 (ak= 1). For each amino acid
(j) in the sequence, should ak = 1 for any of its atoms,
the amino acid is given a score of 1 (rj= 1). This
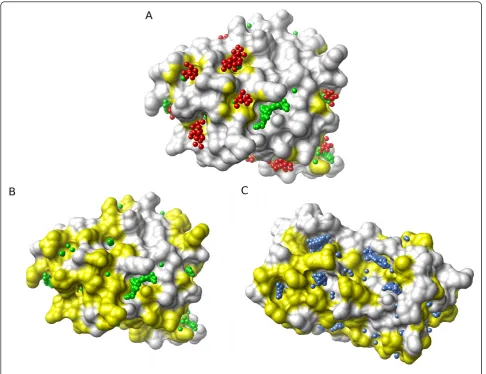
[image:5.595.57.540.88.228.2]pro-cess results in an array of atom and residue values for each structure prediction pair: {si,di}® {a1,a2,ak,...,al}i Figure 1The difficulties of global comparison of pockets on protein surfaces.(A)Pocket predictions from PASS (red) and LIGSITE-cs(green) for the same interleukin-2 (IL-2) structure (ribbon, PDB:1M47). The similarities and differences between these predictions are readily visualized, but how can identification of common features be automated?(B)Homologous structures: The surface pockets of IL-2 (white ribbon, green spheres) [PDB:1M47] and its distant homologue leukaemia inhibitory factor (LIF) (blue ribbon, blue spheres) [PDB:1LKI], both represented by LIGSITE-cs spheres, show little overlap. Is this because the pockets are genuinely unrelated, or because of the difficulty of making a‘correct’structural alignment?.
[image:5.595.60.539.532.660.2]where akÎ {0, 1}and l is the number of atoms in the
protein and{si,di}® {r1,r2,rj,...,rm}iwhere rj Î{0, 1}and
mis the number of residues in the sequence.
If we are dealing with sets of structure-prediction pairs containing the same number of atoms and residues (e.g. CONCOORD conformers, or NMR ensembles) we can now assign an atom-level probability score for the
kth atom:
pk= 1
n n
i=1
aik (1)
i.e. the proportion of structures in which the atom is pocket-lining. We can do a similar calculation for the
jth residue:
pj= 1
n n
i=1
rij (2)
If we have a set of homologous structures, then their sequences must first be aligned. The probability calcula-tion in this case must take into account the number of
structuresnjthat have an aligned residue at position j.
Alignments are performed on sequences comprising those residues having coordinates in the PDB file, as
this ensures missing residues don’t bias the probability
calculations.
pj= 1
nj n
i=1
rij (3)
It is difficult to define an atom-based equivalent to Equation 1for homologous structures as aligned residues may have different numbers of atoms. However, a resi-due-based average of atom scores can be defined as fol-lows:
pj= 1
nj n
i=1
(1
lij lij
k=1
aijk) (4)
$($& !#$$%%)#! %$
(&!#,$% $%#(%(#$ $!# % ($
$%#(%(#$
(% #& $
(& $
"( %
(+$&! %!#& !# #$1.. #2
#$%#(%(#!#& ! %0% $#$($.$% !%$% ! %% $/#$($% (%!# %,%%% /
#$($! %0
$ (#)$($& $ *#% $!,!# % (#% $/#$($ ($$(%,!# %,#$
# $%#(%(#
% %
[image:6.595.56.294.86.324.2][image:6.595.304.539.87.475.2]
Figure 3Workflow for visualisation of pockets in ensembles of structures using Provar tools.
where lijis the number of atoms in the jth residue of
theith structure andaijkis the atom-based score for the
kth atom of the jth residue for the ith structure. This
can be applied both to structures with the same sequence and to homologues to give the proportion of the atoms of each equivalent residue in the set of struc-tures that are pocket-lining, and can usefully distinguish those residues which contribute most to the formation of the pocket.
The probability values for each residue can then be displayed on a protein structure in a number of ways. Our software writes the probability values as a percen-tage to the B-factor column of the PDB file of a user chosen representative structure from the set. This struc-ture can then be rendered using any suitable molecular graphics program. We show how the Provar algorithm provides a practicable solution to the problems outlined in the Introduction when considering pocket predictions from multiple programs on a single structure, across homologous structures and within sets of generated conformations.
Results
Visual comparison of alternate pocket predictions, homologous structures and variation among multiple conformations
Figure 5A illustrates the use of Provar to represent the PASS and LIGSITE predictions from Figure 1A on the surface of IL-2, with atoms colored yellow only if both
programs mark an atom as pocket-lining (pk = 1). For
the more difficult problem involving IL-2 and its distant homologue LIF (from Figure 1B) - we can now readily visualise surface patches of coincident pockets between the two homologues where yellow patches represent equivalent residues that are pocket-lining in both
struc-tures (pj= 1) mapped to the surface of either IL-2
(Fig-ure 5B) or LIF (Fig(Fig-ure 5C).
Figure 6 provides the Provar solutions to the problem posed by multiple generated conformations of IL-2 (from Figure 2). The probability that an atom is pocket-lining across all 50 structures is indicated on a continu-ous scale on the surface (Figure 6A), while the residue-level calculation using Equation 2 is applied to a ribbon representation (Figure 6B). This provides a simple way of identifying the atoms/residues involved in the most persistent pockets (darker reds) and regions that har-bour variable pockets (lighter reds).
Visualising the most conserved pocket-lining residues across a kinase superfamily
Protein kinases form a large and well conserved super-family that are of particular interest in drug discovery. For example, constituent activity of Abl kinase result-ing from the Bcr-Abl gene fusion leads to chronic
myeloid leukaemia (CML) [29]. Specific small mole-cule inhibitors of the Abl kinase active site have been developed and approved as therapy for CML. Using Provar we can conveniently summarise pocket-lining residue conservation across all superfamily members onto a single structure to highlight regions that show conservation of predicted pockets (Figure 7). As expected, residues around the active site (indicated with superimposed ATP) are clearly highlighted (Fig-ure 7A) due to conservation of struct(Fig-ure and function. Another distinct region is found on the other side of the protein (Figure 7B) and the high conservation of this pocket is likely to have functional relevance across the superfamily. For the specific case of Abl kinase, this region is known to form part of the interface of the auto inhibitory interaction with its own SH3 domain, and this fact is suggestive of a conserved role for this pocket in mediating protein-protein interac-tions. In this case, the red colouration indicates that the residue in that alignment position is pocket-lining in most or all homologues. There may, of course, be considerable variability both in the actual residue pre-sent and the orientation of its side-chain that gives scope for binding other proteins or, in a drug-design context, a small molecule ligand with suitable specifi-city for a particular kinase.
Visualisation of pocket-lining atoms from a simulated ensemble of Bcl-2 conformers
Bcl-2 is part of a family of apoptosis regulators that can homo-dimerize or hetero-dimerize with other members of the family to form pro- or anti-apoptotic complexes. As pro-apoptotic proteins such as BAK and BAD can be inhibited by the binding of Bcl-2 (or its homologue
Bcl-XL), specific inhibitors of these protein-protein
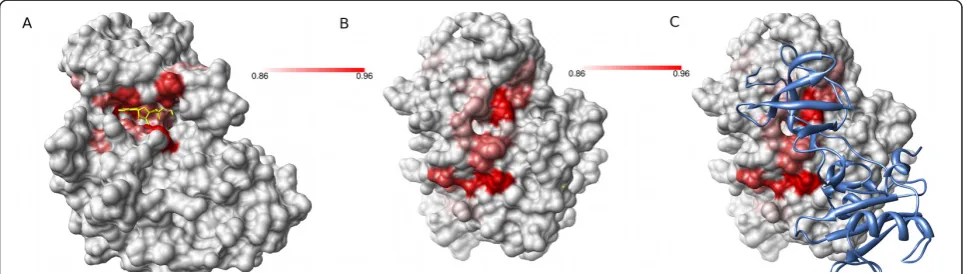
interactions are of interest in oncology research [30]. In Figure 8, we compare PASS pocket predictions for the
apocrystal structure of Bcl-2 with a Provar analysis of
250 tCONCOORD generated conformations. For the crystallographic Bcl-2 structure (Figure 8A), pocket pre-dictions, in red, coincide with a large portion of the known protein-protein interface groove. Small molecule drugs have also been found to target this interface in
both Bcl-2 and Bcl-XLand superposition of an
acyl-sul-fonamide-based ligand from aholostructure shows how
it follows the interface groove, but extends outside the pocket identified by PASS. In contrast, Provar analysis of the tCONCOORD ensemble shows that an extension to the pocket is found at the left in a substantial
pro-portion of conformers (Figure 8B). In the apo crystal
structure, the pocket is bounded at the left by Glu-136 (with which the superimposed ligand is seen to clash in Figure 8), this residue reorients in other conformers
groove for binding. Although, the members of the apo
tCONCOORD ensemble do not fully recapitulate the
Bcl-2 holo conformation, Provar analysis of the
ensem-ble shows that 87% of the atoms in the binding site of Bcl-2 for this inhibitor are identified by PASS to be pocket-lining in at least 25% of the structures (as
opposed to 49% of these atoms in theapo crystal
struc-ture). Additionally, away from the main groove, the probability map indicates where atoms flagged as pocket-lining in the single structure turn out to be less important across the ensemble. For example, prominent pocket-lining atoms at the very top of the crystal struc-ture in Figure 8A are found to have much lower prob-ability in the ensemble than the main binding groove (Figure 8B).
Application to simulated ensembles relevant to inhibition of protein-protein interactions
It is of interest to more broadly investigate the beha-viour of protein-protein interfaces (PPIs) known to bind small-molecule inhibitors. Whereas protein-protein interfaces are generally rather flat and lacking pocket features, it has been observed in number of cases that pockets are stabilised in the presence of a small-mole-cule, which consequently acts to inhibit protein-protein complex formation [31]. Are these pockets discernable
in the apo proteins in the absence of inhibitor? Is it
common that a substantial proportion of the inhibitor binding sites seen in the complexes comprise variable
pockets in the apostate and that variable features can
[image:8.595.56.543.88.462.2]be recovered through tCONCOORD simulation of the
Figure 5Mapping pocket locations to the protein atoms and residues simplifies comparison between methods and proteins.(A)
apo structure accompanied by Provar scoring of pockets?
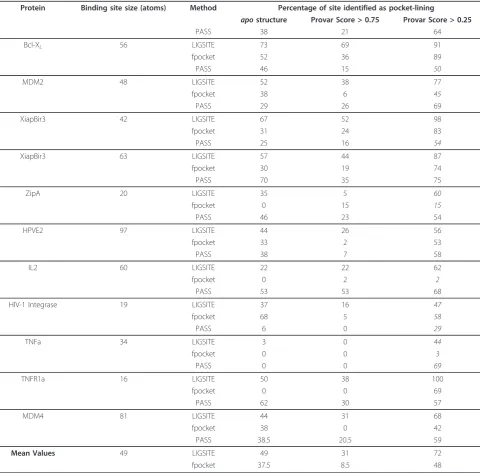
We have investigated all 11 proteins in the 2P2I data-base of protein-protein interface inhibitors [31] that have been structurally characterised. The results of pocket analyses of the crystal structures and
tCON-COORD ensembles of the apoform of these proteins
-in respect of the pocket-l-in-ing character of the atoms known to interact with a small molecule ligand - are
given in Table 1. Here we see that on average LIGSITE
-cs
identifies almost half of the known binding-site atoms
as pocket-lining in the apo crystal structures, this
[image:9.595.55.539.87.284.2]proportion falls to somewhat less than one-third that are persistently pocket lining in the dynamic ensemble (we define persistent as occurring in more than75% of conformations), but rises to an average of 72% of the binding-site atoms that are found to be pocket lining in at least 25% of the ensemble. These trends are mirrored by results obtained for PASS and fpocket analysis of the same structures. It is also clear, from Table 1 that the precise results of these ensemble-based pocket analyses are rather different for each program, with PASS and fpocket identifying, on average, successively fewer bind-ing-site atoms as pocket-lining. This order is not
Figure 6Provar discriminates atoms and residues which persistently or variably contribute to pockets in an ensemble.(A)The atomic Provar score for a set of 50 conformers of IL-2 generated with tCONCOORD readily distinguishes those atoms persistently involved in pocket formation (dark red) from those only involved in pocket formation in minority of structures (light red).(B)Equivalent residue scores on a ribbon representation.
[image:9.595.57.541.516.653.2]preserved for every structure, and whether or not pock-ets are found, presumably, depends upon precise geo-metric features of pockets in individual proteins to which each algorithm is differently sensitive. Although,
on average, LIGSITE-cs recovers more of the known
binding sites, this is substantially due to it identifying more of the protein as a whole as pocket-lining.
Accord-ing to LIGSITE-cs, 60% of all the atoms averaged over all
the proteins are pocket-lining in more than 25% of con-formations. This is due to there being many small
pock-ets in the ensemble to which LIGSITE-cs is sensitive
(using the default parameters). Both PASS (41%) and fpocket (32%) are more conservative in predicting pock-ets across the protein surface and, although they on
average identify fewer of the binding sites’ atoms as
pocket, are slightly more specific. Despite these varia-tions, it is the case that all the prediction programs identify substantially more binding-site atoms as persis-tently or variably pocket-lining than in the protein as a whole. This is also true for the majority of analyses of individual proteins i.e. that the distribution of Provar scores of binding site atoms is significantly different from the protein as a whole and biased toward a higher probability of being identified as pocket-lining in the ensemble. Overall, these results support the notion that transient or variable features of pockets are at least a majority feature of protein-protein inhibitor binding sites.
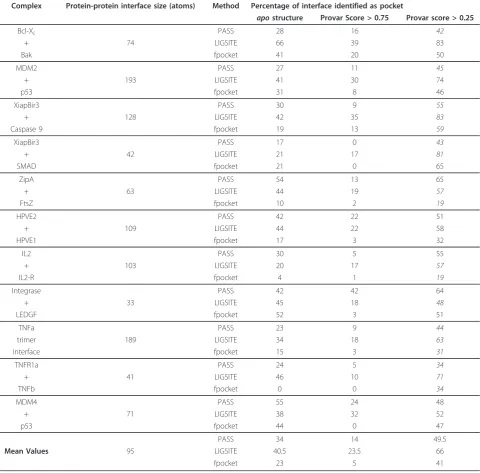
Considering these same ensembles of apostructures
from the perspective of the protein-protein interface, there are proportionately fewer pocket-lining atoms in such interfaces, although still greater than the protein surface as a whole. On average both the binding-site and protein-protein interface have a greater proportion of atoms that are variably pocket lining according to PASS (38.5% binding-site vs. 35.5% PPI vs. 27% protein
surface) and fpocket (39.5%,36%,32%). This dynamic pocket formation is in contrast to earlier analysis of the
apo crystal structure dataset [31] using Q-Site Finder
which found relatively few “static” pockets at these
interfaces. Given the large numbers of atoms in total in this set of interfaces, the average differences found here are significant, but it is also the case that excess pockets in PPIs are only found in half of the individual analyses (Table 2). Consequently, there is no strong evidence on which to make general statements about the relative variability of drug gable PPI interfaces in terms of pocket formation. Clearly all these interfaces can form pockets able to bind small molecule ligands, but it seems more likely that this is a very local feature of the protein-protein interface rather than a consequence of an average property of it.
Visualisation of IL-2 homologues shows conserved pockets at thea,bandgreceptor interfaces
The cytokine IL-2 binds the IL-2 receptor (IL-2R) at three distinct protein-protein interfaces with the
recep-tor’sa,band g chains [32]. We might anticipate that
these receptor-binding interfaces will be used by other members of the superfamily to form complexes with
their specific receptors. Provar’s summary of the surface
pockets found in theapostructures of this superfamily
does indeed show a strong overlap between the most conserved pockets on these small and diverse proteins
and the sites of interaction of the a,b and greceptor
chains found in the IL2-receptor complex (Figure 9). Although there is greater variation of the surface fea-tures of this superfamily homologous cytokines than in the case of kinases discussed above, the overlap of the IL2 binding interfaces and the relatively most conserved pockets is clearly discernable. If we consider analyses
[image:10.595.58.539.88.234.2]using each of PASS, LIGSITE-csand fpocket (Table 3),
then we find that the most conserved pockets (defined by the pocket-lining residues having a Provar score in the highest quartile) recover only ~ 30-42% of the known protein-protein interfaces i.e. conserved pockets are a minority feature of these interfaces. Thus, the sen-sitivity of detection of the extent of protein-protein interfaces by detection of conserved pockets is low. However, we also find that pockets are very specifically
[image:11.595.57.538.99.572.2]conserved at these interfaces (specificity is ~ 71-82%) and that there are very few highly conserved pockets elsewhere on the protein surface. This high degree of specificity means that it is tempting to hypothesise that it may be possible to identify functional binding pockets in other systems through analysis of superfamily mem-bers even in the absence of structures showing the inter-actions with their receptors. The success of such an Table 1 Ensemble analysis of the binding sites of protein-protein interaction inhibitors
Protein Binding site size (atoms) Method Percentage of site identified as pocket-lining
apostructure Provar Score > 0.75 Provar Score > 0.25
PASS 38 21 64
Bcl-XL 56 LIGSITE 73 69 91
fpocket 52 36 89
PASS 46 15 50
MDM2 48 LIGSITE 52 38 77
fpocket 38 6 45
PASS 29 26 69
XiapBir3 42 LIGSITE 67 52 98
fpocket 31 24 83
PASS 25 16 54
XiapBir3 63 LIGSITE 57 44 87
fpocket 30 19 74
PASS 70 35 75
ZipA 20 LIGSITE 35 5 60
fpocket 0 15 15
PASS 46 23 54
HPVE2 97 LIGSITE 44 26 56
fpocket 33 2 53
PASS 38 7 58
IL2 60 LIGSITE 22 22 62
fpocket 0 2 2
PASS 53 53 68
HIV-1 Integrase 19 LIGSITE 37 16 47
fpocket 68 5 58
PASS 6 0 29
TNFa 34 LIGSITE 3 0 44
fpocket 0 0 3
PASS 0 0 69
TNFR1a 16 LIGSITE 50 38 100
fpocket 0 0 69
PASS 62 30 57
MDM4 81 LIGSITE 44 31 68
fpocket 38 0 42
PASS 38.5 20.5 59
Mean Values 49 LIGSITE 49 31 72
fpocket 37.5 8.5 48
approach would, of course, depend on whether the recognition mechanism for the superfamily utilised pockets.
The IL-2 superfamily data also provide an opportunity to contrast the ensemble averaging approach of Provar to that of fpocket/MDpocket. As described in the Algo-rithm section, both programs take a probabilistic approach to scoring pockets found in ensembles of structures. In the case of fpocket/MDpocket, structures
[image:12.595.58.539.101.574.2]are superimposed and the proportion of structures in which pockets are found at each point in space is deter-mined. Spatially averaged pocket densities determined by the fpocket algorithm can be mapped by MDpocket to the neigbouring surface atoms of a reference struc-ture. In contrast, Provar maps pockets to the local sur-face atoms for each structure in the ensemble and then accumulates these atomic scores over the ensemble. When the structures in the ensemble are fairly similar, Table 2 Ensemble analysis of pockets at protein-protein interfaces
Complex Protein-protein interface size (atoms) Method Percentage of interface identified as pocket
apostructure Provar Score > 0.75 Provar score > 0.25
Bcl-XL PASS 28 16 42
+ 74 LIGSITE 66 39 83
Bak fpocket 41 20 50
MDM2 PASS 27 11 45
+ 193 LIGSITE 41 30 74
p53 fpocket 31 8 46
XiapBir3 PASS 30 9 55
+ 128 LIGSITE 42 35 83
Caspase 9 fpocket 19 13 59
XiapBir3 PASS 17 0 43
+ 42 LIGSITE 21 17 81
SMAD fpocket 21 0 65
ZipA PASS 54 13 65
+ 63 LIGSITE 44 19 57
FtsZ fpocket 10 2 19
HPVE2 PASS 42 22 51
+ 109 LIGSITE 44 22 58
HPVE1 fpocket 17 3 32
IL2 PASS 30 5 55
+ 103 LIGSITE 20 17 57
IL2-R fpocket 4 1 19
Integrase PASS 42 42 64
+ 33 LIGSITE 45 18 48
LEDGF fpocket 52 3 51
TNFa PASS 23 9 44
trimer 189 LIGSITE 34 18 63
interface fpocket 15 3 31
TNFR1a PASS 24 5 34
+ 41 LIGSITE 46 10 71
TNFb fpocket 0 0 34
MDM4 PASS 55 24 48
+ 71 LIGSITE 38 32 52
p53 fpocket 44 0 47
PASS 34 14 49.5
Mean Values 95 LIGSITE 40.5 23.5 66
fpocket 23 5 41
the differences between these two approaches to aver-aging is small in terms of the final map of pockets to the protein surface. However, in a case such as the IL-2 superfamily, whose representative members have less than 15% pair wise sequence identity and rather diverse structures that are difficult to superimpose, pockets
found on one structure’s surface may be quite far from
the surface of the reference structure. Thus any final mapping of spatial densities may be spread across the surface in an art factual way. The consequence of this lack of direct association with a local surface is that, in the IL2 superfamily case, fpocket/MDpocket ensemble averaging scores more of surface residues as pocket-lin-ing, and that consequently more of the interface resi-dues are associated with a high score. However, specificity is much lower than fpocket/Provar as more non-interface sites are also considered conserved. Of course, this case is particularly difficult for fpocket/ MDpocket, but the lesson is that one or both
approaches may be useful depending on the structure set in question.
Highlighting variation in the contribution of residues to pocket formation among homologues and simulations of apo IL-2 also highlights regions known to undergo conformational change on binding inhibitors
Not all residues forming the IL-2:IL-2Rainterface show
conserved pocket-lining propensity. By colouring the group of residues that are relatively variable in their lining character (here defined as those pocket-lining residues with scores in the quartiles either side of the median), we obtain Figure 10. In this representation, those residues in equivalent alignment positions across the homologues that show the relatively greatest varia-bility as to whether they form pockets are highlighted in a deep blue (Figure 10A). In this case a region to the
left of the a interface is notably variable. It has been
[image:13.595.59.540.88.237.2]suggested that when analysing a set of homologues,
Figure 9Residues lining pockets across apo IL-2 superfamily members overlap with IL-2-receptor interfaces. The residues most often involved in pocket formation (defined as those residues having the top 25% of Provar scores,≥0.364 in this case) across 17apostructures of functionally diverse IL-2 homologues are colored red on the molecular surface of IL-2 in a receptor bound conformation [PDB:2B5I]. These pocket forming residues, thus identified in a substantial subset of theapo-structures, overlap the IL-2:IL-2 receptor interfaces(A,B,C)with respectively the receptora,bandgchains, suggesting that the location of their receptor interaction sites is well conserved across the family despite low sequence identity.
Table 3 Conserved pockets in the IL-2 superfamily at the known IL2 receptor interfaces
Pocket prediction (ensemble scoring) Highly conserved pocket residues at interface Sensitivity Specificity
PASS (Provar) 13 30.2 81.8
Ligsite pockets (Provar) 13 30.2 80.5
fpocket (Provar) 18 37.2 71.4
fpocket (MDpocket) 21 48.8 46.8
There are three distinct interfaces made between IL-2 and the subunits of the IL-2 receptor, which together involve 43 residues of the 120 residue IL2 protein (with only 1 residue that contacts two subunits). Investigation of pockets in 17apostructures from the highly diverse IL-2 superfamily (pair wise sequence identities of 7.5-13.3%) using the Provar scoring methodology (Equation 4) shows that there are several relatively highly conserved pocket-lining residues which lie at the receptor interfaces (Figure 9). This is suggestive that these pockets are functionally significant in a substantial proportion of the family. Selecting the 25% of residues with the highest Provar scores from analyses with PASS, LIGSITE-cs
[image:13.595.57.544.581.649.2]structural variability in a particular aligned region may imply that the equivalent position on an individual pro-tein in the superfamily is amenable to conformational change [33]. This suggestion seems to be at least partly correct in the case of IL-2. It is known that inhibitors of
IL-2:IL-2R association bind at the ainterface and that
formation of their binding pocket requires reorientation of IL-2 side chains precisely in the region highlighted as variable amongst homologues. Figure 10B compares the side chain orientations of residues known to be essential
to either receptor or ligand binding between the a
-receptor-bound and a ligand-bound structure. Of the five residues known to undergo large rearrangements of side chains to accommodate the ligand (Arg 38, Lys 35, Met 39, Phe 42 and Leu 72) [32], three (Lys 35, Met 39 and Leu 72) appear to be variably pocket forming
according to Provar analysis of apostructures from the
superfamily. Of the two residues not highlighted by the analysis of homologues, one (Phe 42) is persistently pocket-lining and the other (Arg 38) has a low propen-sity to form a pocket. However, these two residues (together with Leu 72) are highlighted as variably pocket-lining in simulated ensemble of conformers of
apoIL-2 itself (Figure 10C). These results indicate the
potential for combining analyses of a superfamily, which can indicate both conserved and variable pocket-lining regions, with simulations of an individual protein, which
may provide specific insights into variable regions in the context of a particular interface.
Discussion
Having a consistent and simple representation of both persistent and variable predicted pockets across arbitra-rily large sets of related structures simplifies interpreta-tion of data from which it may otherwise be difficult to extract meaning. Even with a simple example, the pre-dictions of two programs on a single structure, it is not obvious how to quantitatively compare the two pocket predictions. With many conformations the mass of pre-diction points becomes spread-out and ambiguous as the increasing number of conformers leads to increased local structure variation and smearing due to the changes in the overall global alignments. With the struc-tural dissimilarities that occur in sets of homologues the comparisons can become even harder and necessitate an approach that deals effectively with the problems of structure and sequence alignments. All three of these problems can benefit from the probabilistic approach taken here that assesses the extent to which predictions of pocket-lining atoms or residues hold for the dataset as a whole.
[image:14.595.59.540.436.585.2]This atom-centred approach avoids the complex issue of how to define each individual pocket and compare these between structures, rather focusing on groups of
Figure 10Residues with variable roles in pocket formation in apo structures may indicate cryptic binding sites. Analyses of apo structures of IL-2 superfamily members and a set of simulated conformers of apo IL-2 show that residues that have variable roles in pocket formation include those that undergo the significant side-chain conformational rearrangements necessary to accommodate small molecule interface inhibitors.(A)Residues that are pocket-lining in a small proportion of the 17 apo homologues of IL-2 are highlighted on the IL-2 surface (dark blue represents the median Provar score of 0.26, with lighter blues indicating a higher or lower score). A region to the left of thea receptor interface (c.f. Figure 9A) is prominent in this visualisation and indicates structural heterogeneity of this region across the superfamily.(B)
residues or atoms whose roles in pocket formation are most (or least) variable as a whole. The corollary is that these gross dataset properties do not provide detailed geometric or structural information on individual pock-ets. The fraction of structures of an ensemble in which equivalent atoms or residues are involved in pocket for-mation does, of course, not contain all the inforfor-mation present in the original outputs of the prediction pro-grams. For example, if a group of residues form a pocket in all members of an ensemble, their Provar score will readily identify them, but it will not indicate whether the pocket has the same geometry in each structure or not. Our use of persistent and variable to describe pock-ets reflects the identity of the residues forming the pocket (and indirectly its location) and not necessarily the shape of the pocket. However, in the case of variable pockets, variation in the number and location of resi-dues forming the pocket will almost certainly be accom-panied by shape changes. The aim in summarising
information using Provar’s scoring schemes is to allow
insight into large amounts of data that is otherwise diffi-cult to visualise. Once regions of interest are identified then further more focused analyses may be possible.
We have not attempted to re-validate the outputs of existing pocket prediction software (which have in any case been recently critically evaluated [12] for their abil-ity to predict small-molecule binding sites). In this regard, the Provar methodology described here merely aids comparison of different prediction software. Provar analysis readily shows that pocket prediction programs give somewhat different outputs (Figure 1, Tables 1 and 2). Which programs are most suited to particular inves-tigations in the context of analysis of sets of structures remains to be tested, and it may be that it makes sense to combine results of prediction algrorithms that may have different strengths and weaknesses [11]. In this lat-ter case, Provar scores provide a straightforward basis for creating a summary or consensus of several pro-grams (Figure 5).
In the examples that we have presented here, we have mainly been concerned with visualising the persistence/
variation of pockets in a protein’s conformational or
superfamily ensemble in the absence of any ligand, and identifying instances of correlation of pockets formed in these ensembles with persistence or variation of experi-mentally known ligand binding sites. Such identification (or prediction) of features of ligand binding sites is a widespread application of pocket prediction software when applied to individual structures. The application of the Provar algorithm provides means to visualise the results of analyses on large sets of related structures.
For a kinase superfamily, pockets whose locations are highly conserved across homologues were readily
identi-fied and correspond to the enzyme’s active and allosteric
regulatory sites (Figure 7). There is a potential for simi-lar analysis of other less well understood protein super-families to identify common features that would then be the target of functional investigation.
We have seen how Provar visualisations allow us to identify pockets present in members of an ensemble that may be absent from an individual crystal structure. In analysing a conformational ensemble of Bcl-2, Provar analysis indicates an extended binding groove among
simulated apoconformations compared to that of the
crystal structure (Figure 8). We have shown that ana-lyses of conformational ensembles of apo structures usually recover more of known PPI inhibitor binding sites than analyses of single static structures, but that precise outcomes of such analyses are rather dependent on the pocket prediction software used. Again, Provar scoring does provide a convenient approach to compar-ing such results.
Provar analysis of pocket predictions on simulated ensembles may help guide ligand design efforts by indi-cating which regions of the proteins surface may adapt to accommodate larger (or smaller) ligands. The resi-due-based Provar scores themselves could be further analysed to identify subsets of conformations (or subfa-milies) in which particular residues are involved in pocket formation. Such subsets may then find a use in computational design efforts, e.g., docking, were they may increase the diversity of candidate ligands, which in turn increases the likelihood of finding one that simulta-neously satisfies the requirements of specificity, affinity and ADME-Tox. In the kinases, identifying variable pocket-lining regions bordering conserved regions may be helpful when designing inhibitors that are specific to a particular kinase or kinase subset.
In common with many other forms of structural ana-lyses, the type and quality of inferences made from Pro-var visualisation depend on an appropriate choice of structure set. We anticipate that a judicious combina-tion of evidence obtained from both sets of homologues (where suitable) and simulated conformational ensem-bles of individual proteins may provide most insight into variability of pockets, as illustrated with the IL-2:IL-2R interface. In binding-site prediction applications, it is necessary to be careful to exclude any structures that have ligands bound. In the case of comparison of homo-logous structures, it is necessary to create a set of pro-teins or domains which are representative of the members of the superfamily, but sufficiently dissimilar from each other to avoid bias to the features of the members with the most numerous structures. However, other applications of the Provar approach may require different criteria, e.g., it may be of interest to compare
sets ofapoand ligand containing structures to identify
ligand binding that may suggest sites for allosteric regulation.
Conclusion
The approach to probabilistic analysis of variation of pockets on protein surfaces through mapping the pre-sence or abpre-sence of a pocket to the protein atoms and residues that form the pocket, provides a straightforward way of summarising the surface features of many struc-tures. The visualisations of the results of this probability analysis provided useful insight into pocket variability and may find particular application in target characteri-sation in computational structure-based drug design.
Methods
Data sets
All PDB files were downloaded in text format from the RCSB Protein Data Bank [34] and processed to extract only the protein chain of interest. Because artifacts may be generated by pocket prediction programs due to missing residues in the PDB file, care has been taken that these do not overlap with a region of interest.
Simulations
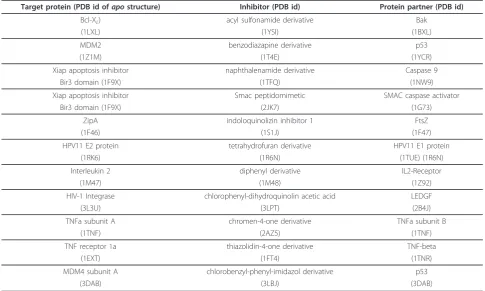
The structures used in simulation ensemble analysis of proteins involved in protein-protein interactions (Tables 1 and 2) are drawn from the 2P2I database of protein-protein interfaces with known inhibitors [31]. The PDB ids of structures used are listed in Table 4. Prior to simulation, structures were protonated using UCSF Chi-mera [35] using options to protonate His residues based on their H-bonding pattern. Multiple conformations (250 per run) were generated using tCONCOORD (ver-sion 1.0) [20] with the standard input parameter file. For the IL-2 data shown in Figures 2 and 6A
simula-tions were based on an apostructure [PDB:1M47] with
only the first 50 conformers used in Provar analysis. The atom-based representation (Figure 6A) was obtained by applying Equation 1 and the residue-based ribbon diagram (Figure 6B) using Equation 2. For Bcl-2
(Figure 8) 250 conformers were generated from anapo
structure[PDB:1GJH] and atom-based Provar scoring (Equation 1) was used to generate Figure 8B. In all cases, binding sites and protein interfaces are defined using those non-hydrogen atoms of the protein within
4.5Åof a non-hydrogen atom of the binding partner.
Kinase superfamily
We took the single CATH v3.4 [36] representative domains at the S35 level (sequence identity > 35%) for homologues of Phosphorylase Kinase domain 1 (CATH superfamily ID: 3.30.200.20), giving 93 protein chains. Structures were downloaded from the PDB and pro-cessed as outlined above. Pocket predictions using PASS
(for the 91 structures that gave valid output) were used to generate residue-based probabilities using Provar scoring with Equation 3 and multiple sequence align-ments from ClustalW2 [37].
Homologues of IL-2
Seventeen apo structures were identified among the
representative S35 domains in CATH homologous superfamily 1.20.1250.10. An overall sequence alignment was generated using MUSTANG [38] using only the observed amino acid sequences found in the PDB files. In order to map Provar results for Figures 9, 10A and 10B onto a bound structure, the receptor-bound IL-2 chain [PDB:2B5I] was included in the MUS-TANG alignments, but ignored during Provar calcula-tions. Equation 4 was used for scoring in Figures 9 and 10. Pocket predictions were made for each structure
with LIGSITE-cs(shown in Figure 9), PASS and fpocket
and averaged using Provar. MDPocket was also used to map fpocket-based scores to residue for this dataset. Figure 10C used 250 conformers from a tCONCOORD
simulation of apoIL2 [PDB:1M47] to define
probabil-ities. To enable comparison between scores generated from different datasets and methods, the subsets for analysis and visualization are selected using the quartiles of each distribution of non-zero probability scores, where residues which are relatively persistently pocket
forming have scores (Q3) (i.e. in the top 25%) and those
which are relatively variable fall in the range(Q3-Q1) in
each case.
Pocket prediction
Sets of related structures (conformers, homologs etc.) were processed as a batch with either PASS (v2.0.36) or
LIGSITE-cs or fpocket v1.0. PASS was run with the’
-more’flag and only the files ending’probes_r.pdb’,
com-prising the final layer of individual probe spheres were used in the Provar analysis. fpocket was run using
default’SET1’ parameters. LIGSITE-cs was run with
default parameters, with the exception of a grid size of
0.5Å, and files ending’pocket-r.pdb’, containing the
cen-troids of all pocket-prediction spheres were used in ana-lysis. In all cases, atoms were defined as pocket-lining
by Provar if within 3.75Åof any predicted pocket
posi-tion (centres of probe spheres). Provar scores are poten-tially sensitive to the precise placement of pocket prediction spheres with respect to the protein atoms. Too coarse a representation of pockets by the pocket prediction software can lead to artifacts in mapping to atoms. However, comparative tests on tCONCOORD generated ensembles show that use of this distance cri-terion in conjunction with any pocket prediction sphere
radius or grid spacing≤1.0Ågives consistent scores (e.
scores for LIGSITE-csbetween grid size = 0.5Å and all
grid sizes≥0.2Åand ≤1.0Åare > 0.88).
Software implementation
The Provar method is implemented as a series of MATLAB modules driven from a single user-modifiable configuration file (describing paths and input data types). Presently, pocket descriptions can be read from
fpocket, LIGSITE-cs, SiteMap and PASS format output
files. A PDB input format is also supported for those programs, such as CASTp, which directly output atom or residue based scores in this format. Modules were developed and run in MATLAB 7.4.0.287 (R2007a) run-ning on OS X (Leopard). PDB files manipulated via
Bio-Java v1.7 [39] modules. PASS (v2.0.36), LIGSITE-cs and
fpocket were run on an IBM 3550 Dual Xeon X5355 @ 2.66GHz CPU, 16Gb Memory, SuSE Linux workstation. tCONCOORD (v1.0) was run on nodes of a Rocks Clus-ter. All structures were visualised and rendered using UCSF Chimera (v1.5.2) [35].
Availability and requirements
The Matlab modules for Provar, together with a descrip-tion of their use and example datasets, are freely available
at http://people.cryst.bbk.ac.uk/~ubcg66a/software.html. In addition to the base implementation of Matlab (ver-sion 7.4 or later), the Statistics Toolbox is required.
Acknowledgements
Paul Ashford was supported by a BBSRC-CASE studentship which was part funded by Pfizer.
Author details
1Institute of Structural and Molecular Biology, Department of Biological
Sciences, Birkbeck, University of London, Malet Street, London WC1E 7HX, UK.2Pfizer Global Research and Development, Ramsgate Road, Sandwich CT13 9NJ, UK.
Authors’contributions
PA carried out all programming. PA and AP carried out data analysis. All authors contributed to design and development of the study. PA, DSM, IN and MAW wrote the paper. All authors read and approved the final manuscript.
Competing interests
The authors declare that they have no competing interests.
Received: 7 October 2011 Accepted: 14 March 2012 Published: 14 March 2012
References
[image:17.595.55.541.100.391.2]1. Brady G, Stouten P:Fast prediction and visualization of protein binding pockets with PASS.J Comput Aided Mol Des2000,14:383-401.
Table 4 Structures used in protein-ligand and protein-protein pocket analysis
Target protein (PDB id ofapostructure) Inhibitor (PDB id) Protein partner (PDB id)
Bcl-XL) acyl sulfonamide derivative Bak
(1LXL) (1YSI) (1BXL)
MDM2 benzodiazapine derivative p53
(1Z1M) (1T4E) (1YCR)
Xiap apoptosis inhibitor naphthalenamide derivative Caspase 9
Bir3 domain (1F9X) (1TFQ) (1NW9)
Xiap apoptosis inhibitor Smac peptidomimetic SMAC caspase activator
Bir3 domain (1F9X) (2JK7) (1G73)
ZipA indoloquinolizin inhibitor 1 FtsZ
(1F46) (1S1J) (1F47)
HPV11 E2 protein tetrahydrofuran derivative HPV11 E1 protein
(1RK6) (1R6N) (1TUE) (1R6N)
Interleukin 2 diphenyl derivative IL2-Receptor
(1M47) (1M48) (1Z92)
HIV-1 Integrase chlorophenyl-dihydroquinolin acetic acid LEDGF
(3L3U) (3LPT) (2B4J)
TNFa subunit A chromen-4-one derivative TNFa subunit B
(1TNF) (2AZ5) (1TNF)
TNF receptor 1a thiazolidin-4-one derivative TNF-beta
(1EXT) (1FT4) (1TNR)
MDM4 subunit A chlorobenzyl-phenyl-imidazol derivative p53
(3DAB) (3LBJ) (3DAB)
2. Hendlich M, Rippmann F, Barnickel G:LIGSITE: automatic and efficient detection of potential small molecule-binding sites in proteins.J Mol Graph Model1997,15:359-363.
3. Levitt D, Banaszak L:POCKET: A computer graphics method for identifying and displaying protein cavities and their surrounding amino acids.J Mol Graph1992,10:229-234.
4. Weisel M, Proschak E, Schneider G:PocketPicker: analysis of ligand binding-sites with shape descriptors.Chem Cent J2007,1:7. 5. Laskowski RA:SURFNET: a program for visualizing molecular surfaces,
cavities, and intermolecular interactions.J Mol Graph1995,13:323-330. 6. Liang J, Edelsbrunner H, Woodward C:Anatomy of protein pockets and cavities: measurement of binding site geometry and implications for ligand design.Protein Sci1998,7:1884-1897.
7. Schmidtke P, Guilloux VL, Maupetit J, Tuffery P:fpocket: online tools for protein ensemble pocket detection and tracking.Nucleic Acids Res2010, 38:W582-W589.
8. Huang B, Schroeder M:LIGSITEcsc: predicting ligand binding sites using the Connolly surface and degree of conservation.BMC Struct Biol2006, 6:19.
9. Capra JA, Laskowski RA, Thornton JM, Singh M, Funkhouser TA:Predicting protein ligand binding sites by combining evolutionary sequence conservation and 3D structure.PLoS Comput Biol2009,5:e1000585. 10. Laurie A, Jackson R:Q-Site Finder: an energy-based method for the
prediction of protein-ligand binding sites.Bioinformatics2005, 21:1908-1916.
11. Huang B:MetaPocket: a meta approach to improve protein ligand binding site prediction.OMICS2009,13:325-330.
12. Chen K, Mizianty MJ, Gao J, Kurgan L:A critical comparative assessment of predictions of protein-binding sites for biologically relevant organic compounds.Structure2011,19:613-621.
13. McCammon JA, Harvey SC:Dynamics of proteins and nucleic acids
Cambridge: Cambridge University Press; 1987.
14. Keskin O, Gursoy A, Ma B, Nussinov R:Principles of protein-protein interactions: what are the preferred ways for proteins to interact?Chem Rev2008,108:1225-1244.
15. McCammon JA, Gelin BR, Karplus M:Dynamics of folded proteins.Nature
1977,267:585-590.
16. Karplus M, McCammon J:Molecular dynamics simulations of biomolecules.Nat Struct Biol2002,9:646-652.
17. Amadei A, Linssen A, Berendsen H:Essential dynamics of proteins.
PROTEINS: Struct Funct Gen1993,17:412-425.
18. Brooks B, Karplus M:Normal modes for specific motions of
macromolecules: application to the hinge-bending mode of lysozyme.P Natl Acad Sci USA1985,82:4995-4999.
19. de Groot B, van Aalten D, Scheek R, Amadei A, Vriend G, Berendsen H: Prediction of protein conformational freedom from distance constraints.
Proteins1997,29:240-251.
20. Seeliger D, Haas J, de Groot BL:Geometry-based sampling of conformational transitions in proteins.Structure2007,15:1482-1492. 21. Leo-Macias A, Lopez-Romero P, Lupyan D, Zerbino D, Ortiz AR:An analysis
of core deformations in protein superfamilies.Biophys J2005, 88:1291-1299.
22. Via A, Ferre F, Brannetti B, Helmer-Citterich M:Protein surface similarities: a survey of methods to describe and compare protein surfaces.Cell Mol Life Sci2000,57:1970-1977.
23. Kahraman A, Morris RJ, Laskowski RA, Thornton JM:Shape variation in protein binding pockets and their ligands.J Mol Biol2007,368:283-301. 24. Campbell S, Gold N, Jackson R, Westhead D:Ligand binding: functional
site location, similarity and docking.Curr Opin Struct Biol2003,13:389-395. 25. Eyrisch S, Helms V:Transient Pockets on Protein Surfaces Involved in
Protein Interaction.J Med Chem2007,50:3457-3464.
26. Eyrisch S, Helms V:What induces pocket openings on protein surface patches involved in protein-protein interactions?J Comput Aided Mol Des
2009,23:73-86.
27. Schmidtke P, Bidon-Chanal A, Luque FJ, Barril X:MDpocket: open-source cavity detection and characterization on molecular dynamics trajectories.Bioinformatics2011,27:3276-3285.
28. Halgren TA:Identifying and characterizing binding sites and assessing druggability.J Chem Inf Model2009,49:377-389.
29. Goldman JM, Melo JV:Chronic myeloid leukemia-advances in biology and new approaches to treatment.N Engl J Med2003,349:1451-1464.
30. Wells J, McClendon C:Reaching for high-hanging fruit in drug discovery at protein-protein interfaces.Nature2007,450:1001-1009.
31. Bourgeas R, Basse MJ, Morelli X, Roche P:Atomic analysis of protein-protein interfaces with known inhibitors: the 2P2I database.PLoS One
2010,5:e9598.
32. Arkin M, Randal M, DeLano W, Hyde J, Luong T, Oslob J, Raphael D, Taylor L, Wang J, McDowell R:Binding of small molecules to an adaptive protein-protein interface.P Natl Acad Sci USA2003,100:1603-1608. 33. Davis FP, Sali A:The overlap of small molecule and protein binding sites
within families of protein structures.PLoS Comput Biol2010,6:e1000668. 34. Berman H, Westbrook J, Feng Z, Gilliland G, Bhat T, Weissig H, Shindyalov I,
Bourne P:The Protein Data Bank.Nucleic Acids Res2000,28:235-242. 35. Pettersen EF, Goddard TD, Huang CC, Couch GS, Greenblatt DM, Meng EC,
Ferrin TE:UCSF Chimera-a visualization system for exploratory research and analysis.J Comput Chem2004,25:1605-1612.
36. Orengo C, Michie A, Jones S, Jones D, Swindells M, Thornton J:CATH-a hierarchic classification of protein domain structures.Structure1997, 5:1093-1108.
37. Thompson JD, Gibson TJ, Higgins DG:Multiple sequence alignment using ClustalW and ClustalX.Curr Protoc Bioinformatics2002, Chapter 2: Unit 2.3. 38. Konagurthu AS, Whisstock JC, Stuckey PJ, Lesk AM:MUSTANG: a multiple
structural alignment algorithm.Proteins2006,64:559-574. 39. Holland RCG, Down TA, Pocock M, PrlićA, Huen D, James K, Foisy S,
Dräger A, Yates A, Heuer M, Schreiber MJ:BioJava: an open-source framework for bioinformatics.Bioinformatics2008,24:2096-2097.
doi:10.1186/1471-2105-13-39
Cite this article as:Ashfordet al.:Visualisation of variable binding pockets on protein surfaces by probabilistic analysis of related structure sets.BMC Bioinformatics201213:39.
Submit your next manuscript to BioMed Central and take full advantage of:
• Convenient online submission
• Thorough peer review
• No space constraints or color figure charges
• Immediate publication on acceptance
• Inclusion in PubMed, CAS, Scopus and Google Scholar
• Research which is freely available for redistribution
![Figure 1 The difficulties of global comparison of pockets on protein surfaces[PDB:1M47] and its distant homologue leukaemia inhibitory factor (LIF) (blue ribbon, blue spheres) [PDB:1LKI], both represented by LIGSITEfor the same interleukin-2 (IL-2) structu](https://thumb-us.123doks.com/thumbv2/123dok_us/8876109.944053/5.595.60.539.532.660/difficulties-comparison-homologue-leukaemia-inhibitory-represented-ligsitefor-interleukin.webp)
![Figure 8 Scoring a simulated ensemble of apo structures of Bcl-2 identifies variation in a known ligand binding siteatoms (red) identified from a PASS analysis of thesulfonamide-based ligand, here illustrated by superimposing the ligand from [PDB:2O1Y].ens](https://thumb-us.123doks.com/thumbv2/123dok_us/8876109.944053/10.595.58.539.88.234/simulated-structures-identifies-siteatoms-identified-thesulfonamide-illustrated-superimposing.webp)