1666
THE CITIZENS ACCEPTANCE FACTORS OF
TRANSPORTATION APPLICATION ONLINE IN BATAM: AN
ADAPTATION OF THE UTAUT2 MODEL AND
INFORMATION SYSTEM SUCCESS MODEL
1MANGAPUL SIAHAAN, 2NILO LEGOWO
1Information System Management Department,
2BINUS Graduated Program – Master Information System Management
Bina Nusantara University Jakarta 11480 Indonesia
E-mail: 1[email protected], 2[email protected]
ABSTRACT
The growth of the internet and the advance of information technology, made very significant changes to transportation in Indonesia especially in Batam City. The emergence of applications for online transportations services such as Gojek / Grab has made some people switch to using conventional transportation to online transportation. But with the development of online transportation, there are still people in Batam City taking action against online transportation. For this reason, researchers conducted research to look for factors that influence the acceptance of the people of Batam City on online transportation. The researcher used the UTAUT2 research model (Unified Theory of Acceptance and Use of Technology 2) and the IS Success Model DeLone & McLean. The construct of this research model uses constructs of performance expectancy, effort expectancy, facilitating conditions, price value, information quality, system quality, service quality, behavioral intention, user satisfaction, use behavior. The number of respondents in this study amounted to 400 respondents using SPSS Amos version 22. The results of the analysis showed that the factors that significantly influenced the acceptance of the people of Batam City on the application of online transportation services were seen from constructs of behavioral intention (user intention) 91.2%, performance expectancy is 51.7%, price value is 42.6%, while construct of user satisfaction is influenced by system quality by 68%, information quality is 28.2%, service quality is 12.6%. Keywords: Transportation application online, UTAUT2, Information System Success Model Five
1 INTRODUCTION
The growth of the internet and advances in information technology, making significant changes to online application-based transportation in the city of Batam - Indonesia, where people can order transportation online through the application. With
the existence of application-based online
transportation, the shift in the power of people's interest in using conventional transportation to application-based online transportation. The online transportation that develops in Batam City are: Gojek, WakJek, Grab and Uber with 4000 Gojek drivers, Grab as many as 3,000 drivers and 1,000 drivers with a percentage of Gojek drivers of 50%, Grab 37% and Wakjek 12.5%
One of the factors that made the switch of Batam City people to switch to using online transportation was the price factor. Prices issued by users are cheaper than using conventional transportation. In addition to prices, a sense of comfort for consumers and facilitating getting online transportation is a factor in the shift of the people of Batam City to
online transportation.
1667 who reject the presence of online transportation in Batam City. As summarized from several media, people in the regions and in big cities reject the
presence of online transportation service
applications, which take action to reject the official operation of the application of online transportation services and have an impact on the safety of drivers and passengers using application-based online transportation.
Safety, design, and content factors are important factors in gaining customer trust in mobile commerce, while customer satisfaction is a post-purchase, consumer evaluation and effective response to the overall product and service [18]. The quality of information systems and service quality has a positive effect on users of information systems [13]. System quality and information quality are positively related to system usage [6]. Factors in the UTAUT2 research model such as performance expectancy, effort expectancy, social influence and facilitating condition influence the use of the information system [16].
With the rejection of the acceptance of online transportation services applications, the researchers want to conduct research to explore that what factors influence the acceptance of the people of Batam City on the application of online transportation services. In this research, researchers used an integrated research model between the UTAUT2 research model and the Information System Success model. The variables used in the UTAUT2 research model are performance
expectancy, effort expectancy, facilitating
conditions, price value, and behavioral intention and use behavior variables. While the IS Success Model research model variable uses information quality, system quality, service quality and user satisfaction variables.
1.1 Research Problem
Based on the description above, it is felt necessary to examine and explore what factors influence the acceptance of online transportation service applications in Batam City, with the research problem are:
1. Does performance expectancy have a
significant influence on the behavioral intention in influencing the acceptance of online transportation services applications?
2. Does effort expectancy have a significant
effect on behavioral intention in influencing the acceptance of online transportation services
applications?
3. Does facilitating conditions have a significant
influence on the behavioral intention in
influencing the acceptance of online
transportation services applications?
4. Does price value have a significant effect on
behavioral intention in influencing the acceptance of online transportation services applications?
5. Does information quality have a significant
influence on the behavioral intention in
influencing the acceptance of online
transportation services applications?
6. Does system quality have a significant
influence on the behavioral intention in
influencing the acceptance of online
transportation services applications?
7. Does Service quality have a significant
influence on the behavioral intention in
influencing the acceptance of online
transportation services applications?
8. Does user satisfaction have a significant
influence on the behavioral intention in
influencing the acceptance of online
transportation services applications?
9. Does information quality have a significant
influence on user satisfaction in influencing the acceptance of online transportation services applications?
10. Does system quality have a significant
influence on user satisfaction in influencing the acceptance of online transportation services applications?
11. Does service quality have a significant effect
on user satisfaction in influencing the acceptance of online transportation services applications?
12. Does behavioral intention have a significant
influence on use behavior in influencing the acceptance of online transportation services applications?
1.2 Scope Of Research
The scope of research was conducted in Batam city with analyzing the factors that influence the acceptance of the people of Batam city on the application of online transportation services.
1.3 Research Objective
1668
1. Analyzing the influence of performance
expectancy on the behavioral intention in
influencing the acceptance of online
transportation services applications.
2. Analyzing the influence of effort expectancy
on the behavioral intention in influencing the acceptance of online transportation services applications.
3. Analyzing the effect of facilitating conditions
on the behavioral intention in influencing the acceptance of online transportation services applications.
4. Analyzing the effect of price value on the
behavioral intention in influencing the acceptance of online transportation services applications.
5. Analyzing the effect of information quality on
the behavioral intention in influencing the acceptance of online transportation services applications.
6. Analyzing the influence of system quality on
the behavioral intention in influencing the acceptance of online transportation services applications.
7. Analyzing the effect of service quality on the
behavioral intention in influencing the acceptance of online transportation services applications.
8. Analyzing the effect of user satisfaction on the
behavioral intention in influencing the acceptance of online transportation services applications.
9. Analyzing the effect of information quality on
user satisfaction in influencing the receipt of applications for online transportation services.
10. Analyzing the effect of system quality on user
satisfaction in influencing the acceptance of online transportation services applications.
11. Analyzing the effect of service quality on user
satisfaction in influencing the acceptance of online transportation services applications.
12. Analyzing the influence of behavioral intention
on use behavior in influencing the acceptance of online transportation services applications
2 LITERATURE REVIEW
2.1 Unified Theory Of Acceptance And Use Of Technology 2 (UTAUT2)
Unified Theory of Acceptance and Use of Technology 2 (UTAUT 2) is a model that aims to explain the acceptance of technology based on the level of user trust in technology in improving performance or the Technology Accept Model (TAM) theory, based on the user's confidence level
that the system can strengthen individual work performance.
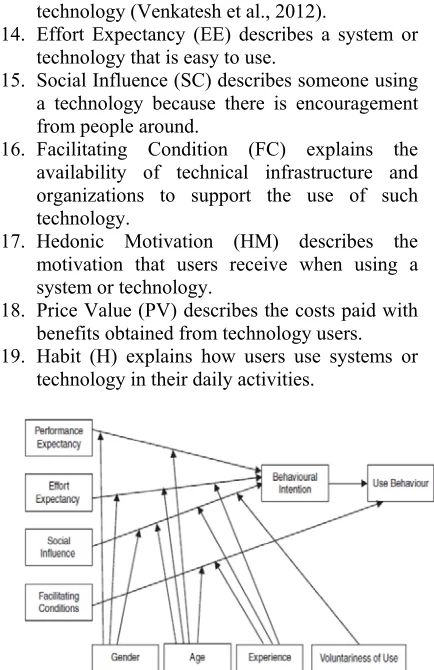
This model explains how the user's intention towards acceptance of a technology is influenced by several factors such as Performance Expectancy, Effort Expectancy, Social Expectancy, Facilitating Condition, Hedonic Motivation, Price Value, and Habit [25].
13. Performance Expectancy (PE) explains how far
users benefit from using a system or technology (Venkatesh et al., 2012).
14. Effort Expectancy (EE) describes a system or
technology that is easy to use.
15. Social Influence (SC) describes someone using
a technology because there is encouragement from people around.
16. Facilitating Condition (FC) explains the
availability of technical infrastructure and organizations to support the use of such technology.
17. Hedonic Motivation (HM) describes the
motivation that users receive when using a system or technology.
18. Price Value (PV) describes the costs paid with
benefits obtained from technology users.
19. Habit (H) explains how users use systems or
[image:3.612.313.530.221.556.2]technology in their daily activities.
Figure 1: UTAUT2 Model (Venkatesh et al., 2003)
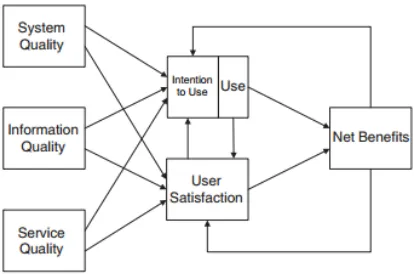
2.2 Information System Success Model (DELONE AND MCLEAN)
Information System Success Model is a model in measuring and understanding the success of information systems [6]. In measuring the success of information systems with this model using several variables such as: system quality, information quality, service quality, intention use, user satisfaction [6].
1669 such as system flexibility, quick response and user convenience.
2. Information Quality describes the quality of
information produced by the system, which is measured by timeliness, completeness and consistency.
3. Service Quality describes the quality of
services obtained for users of the system or technology.
4. Intention Use explains how many users feel
useful by using the system. This variable is measured by the level of use, number of uses, and frequency of use.
5. User Satisfaction explains the level of
[image:4.612.93.300.297.434.2]effectiveness and level of user satisfaction using the system or technology.
Figure 2: Information System Success Model (DeLone & McLean, 2003)
2.3 Information Quality, System Quality, Service Quality Dan Behavioral Intention Customer decisions in purchasing company products or services can be determined from the quality of information available [14]. The quality of information from company offerings is believed to be very important to create a positive image of the company and build sustainable relationships with customers, thus the quality of information from a Web or application affects the customer's intention to access the Web or application and potentially to prospective buyers [14] .
There is a relationship between service quality and behavioral intention [18]. Service quality affects behavioral intention, whereas according to [20], there is no relationship between service quality and behavioral intention.
2.4 User Satisfaction And Behavioral Intention There are elements that influence user satisfaction with behavioral intention [11]. Develop a behavioral intention prediction model based on customer satisfaction. In addition, service quality and customer satisfaction have a relationship [9].
[image:4.612.313.528.355.454.2]The more loyal services provided to customers, the more satisfied the services that will be obtained [8]. This will increase purchase intention (behavioral intention) and will help the company where positive information is disseminated by satisfied customers [12]. Negative information can be made by dissatisfies customers. An example is a case where a customer becomes unhappy or dissatisfied from the company for undesirable and / or negative reasons, which will result in customers complaining about the situation [10] and reducing behavioral intention. This is what shows the link between service quality, customer satisfaction, and behavior.
Figure 3: User Satisfaction and Behavioral Intention (Yakubu et al., 2018)
3 RESEARCH MODEL
This research uses the integration of the research model The Unified Theory of Acceptance and Use of Technology 2 (UTAUT2) with performance
expectancy, effort expectancy, facilitating
1670 Based on the research model image above, it produces 12 hypotheses, with the following hypothesis:
H1 Performance expectancy will have a positive influence on behavioral intention
H2 Effort expectancy will have a positive influence on behavioral intention
H3 Facilitating conditions will have a positive influence on behavioral intention
H4 Price value will have a positive influence on behavioral intention
H5 Information quality will have a positive influence on behavioral intention
H6 System quality will have a positive influence on behavioral intention
H7 Service quality will have a positive influence on behavioral intention
H8 User satisfaction will have a positive influence on behavioral intention
H9 Information quality will have a positive influence on user satisfaction
H10 System quality will have a positive influence on user satisfaction
H11 Service quality will have a positive influence on user satisfaction
H12 Behavioral intention will have a positive influence on use behavior
3.1 Data Analysis
The equation of structural model developed Based on research model in Figure 4 are:
Y1 = 𝛽0 + 𝛽11X1 + 𝛽12X2 + 𝛽13X3 + 𝛽14X4 + 𝛽15X5 + 𝛽16
X6 + 𝛽17X7 +𝛽18Y2+ε1... (1)
Y2 = 𝛽0 + 𝛽21X5 + 𝛽22X6 + 𝛽23X7 + ε2... (2)
Y3 = 𝛽0 + 𝛽31Y1 + ε3... (3)
4 RESULT AND DISCUSSION
4.1 Responden Characteristic
[image:5.612.141.451.97.320.2]Total of respondents in this research amounted to 400 respondents with the characteristics of respondents categorized by sex, age and experience using online transportation service applications with the following data.
1671 Table 1: Respondent Characteristic
Category Type Total % Gender Male 84 53.5 %
Female 73 46.5 %
Age (years) 18 – 29 95 60.5 %
30 – 39 52 33.1 %
40 – 45 8 5.1 %
> 45 2 1.3 %
Experience used < 1 60 38.2 %
1 – 2 71 45.2 %
> 2 26 16.6 %
4.2 Reliability Analysis
Reliability analysis is used to determine the consistency of the respondent's answers. The size used to determine an indicator can be stated reliably
called cronbach alpha, where the Cronbach alpha
criterion is divided into three parts, namely: it can be said that if the value is > 0.6, it can be said to be accepted
Based on the table data above with Cronbach's value without> 0.6, it can be concluded that all indicators are reliable. The data collected for now amounted to 400 respondents with the respondent's character as follows:
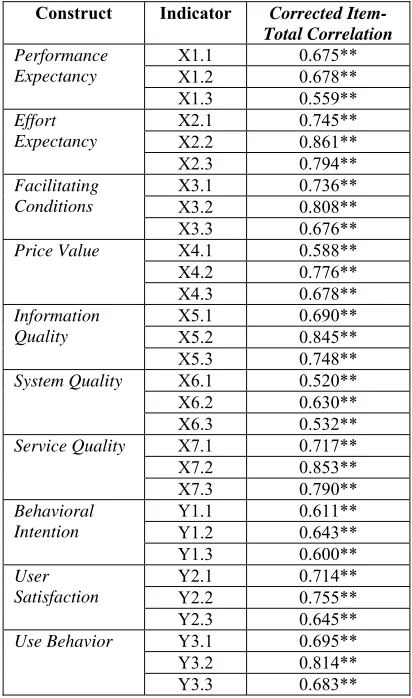
4.3 Validity Analysis
Validity analysis aims to test each indicator from the questionnaire, whether the indicators used in the research are valid or not. Calculation of validity test to find out the correlation between variables on the indicators used. The testing technique used to test validity using correlation Corrected Item-Total Correlation The value of each variable can be seen in the table below:
Based on the validity test of the table above, it produces the value of Corrected Item-Total Correlation with a correlation value > 0.5 so that it can be concluded that each variable questionnaire is valid.
4.4 Normality Test
The normality test uses the residual normality test to ensure the research data has a normal distribution.
The following are the results of the residual normality test based on the regression equation. Table 2: Result Reliability Test
Variable Cronbach’s Alpha
(> 0.6) Performance Expectancy 0.793
Effort Expectancy 0.898 Facilitating Conditions 0.862 Price Value 0.818 Information Quality 0.875 System Quality 0.734 Service Quality 0.890 Behavioral Intention 0.777 User Satisfaction 0.840 Use Behavior 0.856
Table 3: Validity Test Corrected Item – Total Correlation Construct Indicator Corrected
Item-Total Correlation
Performance Expectancy
X1.1 0.675**
X1.2 0.678**
X1.3 0.559**
Effort Expectancy
X2.1 0.745**
X2.2 0.861**
X2.3 0.794**
Facilitating Conditions
X3.1 0.736**
X3.2 0.808**
X3.3 0.676**
Price Value X4.1 0.588**
X4.2 0.776**
X4.3 0.678**
Information Quality
X5.1 0.690**
X5.2 0.845**
X5.3 0.748**
System Quality X6.1 0.520**
X6.2 0.630**
X6.3 0.532**
Service Quality X7.1 0.717**
X7.2 0.853**
X7.3 0.790**
Behavioral Intention
Y1.1 0.611**
Y1.2 0.643**
Y1.3 0.600**
User Satisfaction
Y2.1 0.714**
Y2.2 0.755**
Y2.3 0.645**
Use Behavior Y3.1 0.695**
Y3.2 0.814**
[image:6.612.327.533.132.481.2]1672 Figure 5: standardized residual Y1
In the picture above the distribution of the
residual point in the regression equation Y1 = 𝛽0 +
[image:7.612.320.517.106.315.2]𝛽11X1 + 𝛽12X2 + 𝛽13X3 + 𝛽14X4 + 𝛽15X5 + 𝛽16X6 + 𝛽17X7 + 𝛽18Y2 + ε1 spread around the line and follow the diagonal line so that the residual value is normal.
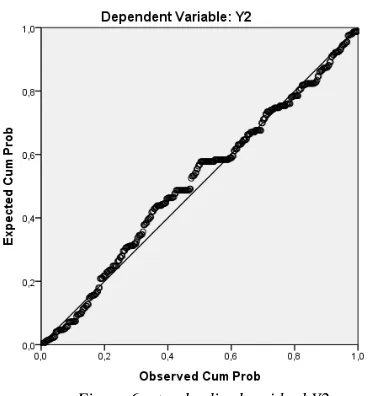
Figure 6: standardized residual Y2
In the picture above the distribution of the
residual point in the regression equation Y2 = 𝛽0 +
𝛽21X5 + 𝛽22X6 + 𝛽23X7 + ε2 spread around the line and follow the diagonal line so that the residual value is normal.
Figure 7: standardized residual Y3
In the picture above the distribution of the
residual point in the regression equation Y3 = 𝛽0 +
𝛽31Y1 spread around the line and follow the
diagonal line so that the residual value is normal.
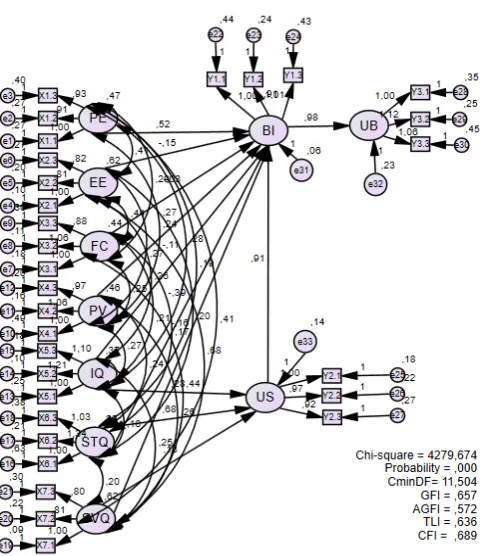
4.5 Model Output Graphic
[image:7.612.93.277.413.611.2]1673 Based on the results of the graph results of the research test, it can be concluded which constructs are significantly influential and which constructs are significant have no effect
Based on the table above with a value of α = 5%. P value which has a significant effect on behavioral intention variables is performance expectancy (PE),
effort expectancy (EE), price value (PV), system quality (STQ), service quality (SVQ), and
[image:8.612.96.527.121.266.2]user satisfaction (US) variables while facilitating variable conditions and information quality variables have no significant effect on the behavioral intention variable. Based on the results Table 4: Result output SPSS Amos
No Hypothesis Estimate S.E C.R P Description
1 PE --> BI 0.517 0.093 5.544 *** Have a positive influence 2 EE --> BI -0.146 0.045 -3.212 0.001 Have a positive influence 3 FC --> BI -0.026 0.082 -0.320 0.749 Not have a positive influence 4 PV --> BI 0.426 0.064 6.602 *** Have a positive influence 5 IQ --> BI -0.111 0.083 -1.338 0.181 Not have a positive influence 6 STQ --> BI -0.389 0.123 -3.166 0.002 Have a positive influence 7 SVQ --> BI -0.163 0.049 -3.354 *** Have a positive influence 8 US --> BI 0.912 0.113 8.094 *** Have a positive influence 9 IQ --> US 0.282 0.060 4.676 *** Have a positive influence 10 STQ --> US 0.680 0.090 7.571 *** Have a positive influence 11 SVQ --> US 0.126 0.031 4.002 *** Have a positive influence 12 BI --> UB 0.983 0.080 12.297 *** Have a positive influence
[image:8.612.146.388.372.650.2]1674 of the above calculations the most influential on the behavioral intention variable is the user satisfaction (US) variable of 91.2%, the variable performance expectancy is 51.7%, the price value variable is 42.6%.
The P value that has a significant effect on the user satisfaction variable is the variable information quality (IQ), system quality (STQ), service quality (SVQ). The P value that has a significant effect on the variable use behavior (UB) is the behavioral intention (BI) variable. Based on the results of the above calculations which most influence the user satisfaction (US) variable is the system quality variable of 68%, the information quality variable is 28.2% and the service quality variable is 12.6%.
While the behavioral intention influences the use behavior is 98.3%.
[image:9.612.86.304.355.616.2]Following are the results of the analysis on below:
Table 5: Result of Analysis
H1 Performance expectancy will have a positive influence on behavioral intention.
H2 Efort expectancy will have a positive influence on behavioral intention.
H3 Facilitating conditions will not have a positive influence on behavioral intention.
H4 Price value will have a positive influence on behavioral intention.
H5 Information quality will not have a positive influence on behavioral intention
H6 System quality will have a positive influence on behavioral intention
H7 Service quality will have a positive influence on behavioral intention
H8 User satisfaction will have a positive influence on behavioral intention
H9 Information quality will have a positive influence on user satisfaction
H10 System quality will have a positive influence on user satisfaction
H11 Service quality will have a positive influence on user satisfaction.
H12 Behavioral intention will have a positive influence on use behavior
5 CONCLUSION
The hypothesis testing states that it has accepted H1, H2, H4, H6, H7, H8, H9, H10, H11, H12 and rejects H3 and H5. The researcher concluded the results of the study as follows:
1. Variable Performance Expectancy has a
significant effect on Behavioral Intention
variables, three indicators (X1.1, X1.2, X1.3) used to measure this variable have met the validity and reliability test requirements. These results support the research of Nassuora (2013), Shah et al. (2014), states that user behavior intention (behavioral intention) will increase if users feel Gojek / Grab helps in daily life.
2. Effort Expectancy variables have a significant
effect on Behavioral Intention variables, three indicators (X2.1, X2.2, X2.3) that are used to measure this variable have met the validity and reliability test requirements. The results obtained were in accordance with Shah et al. (2014), and Nassuora (2013). Research by Chang, Sun, Pan, & Wang (2015) states that the easier the operation and use of the Gojek / Grab application, the higher the intention of Gojek / Grab users.
3. Variable Facilitating Conditions have no
significant effect on Behavioral Intention variables; three indicators (X3.1, X3.2, X3.3) that are used to measure this variable have met the validity and reliability test requirements. The results of this study are not in accordance with Guo (2015), but in accordance with Mousa Jaradat & Al Rababaa (2013) which states that facilitating conditions do not significantly influence user intentions because infrastructure such as smartphones are available to access the application of online transportation services.
4. Price Value variables have a significant effect
on Behavioral Intention variables; three indicators (X4.1, X4.2, X4.3) that are used to measure this variable have met the validity and reliability test requirements. With prices issued using online transportation, the user's intention
to use online transportation services
applications will increase. This result supports the study of Namin (2016) which states that user-issued costs (price value) is one of the factors that determine the user's intention in using the application of online transportation services.
5. Information Quality variables have no
1675 significantly influence the intention to use the application of online transportation services (behavioral intention).
6. System Quality variables have a significant
effect on Behavioral Intention variables, three indicators (X6.1, X6.2, X6.3) that are used to measure these variables have met the validity and reliability test requirements.
7. Service Quality variables have a significant
effect on Behavioral Intention variables; three indicators (X7.1, X7.2, X7.3) that are used to measure this variable have met the validity and reliability test requirements.
8. User Satisfaction variables have a significant
effect on Behavioral Intention variables, three indicators of user satisfaction variables (X9.1, X9.2, X9.3) that are used to measure this variable have met the validity and reliability test requirements.
9. Information Quality variables have a
significant effect on User Satisfaction variables, three indicators (X5.1, X5.2, X5.3) that are used to measure this variable have met the validity and reliability test requirements.
10. System Quality variables have a significant
effect on User Satisfaction variables, three indicators (X6.1, X6.2, X6.3) that are used to measure this variable have met the validity and reliability test requirements.
11. Service Quality variables have a significant
effect on User Satisfaction variables; three indicators (X7.1, X7.2, X7.3) that are used to measure this variable have met the validity and reliability test requirements.
12. Behavioral Intention variables have a
significant effect on User Satisfaction variables; three indicators (X8.1, X8.2, X8.3) that are used to measure this variable have met the validity and reliability test requirements.
REFERENCES:
[1] Agyapong, G. (2011). The Effect of
Service Quality on Customer Satisfaction in the Utility Industry - A Case of Vodafone (Ghana). International Journal of Business and Management, Vol. 6(No. 5), 203-210.
[2] Brady, M.K., Robertson, C.J., 2001.
Searching for a consensus on the antecedent role of service quality and satisfaction: an exploratory cross national study. J. Bus. Res. 51 (1), 53–60.
[3] Chang, S.-C., Sun, C.-C., Pan, L.-Y., &
Wang, M.-Y. (2015). An Extended TAM to
Explore Behavioural Intention of
Consumers to Use M-Commerce. Journal of Information & Knowledge Management, 14(02), 1550014–1 – 1550014–16. http://doi.org/10.1142/S0219649215500148
[4] Davis, F. D., Bagozzi, R. P., & Warshaw,
P. R. (1989). User acceptance of computer
technology: a comparison of two
theoretical models. Management
Science
[5] DeLone, W., & McLean, E. (2003). The
DeLone and McLean Model of Information Systems Success: A Ten-Year Update. Journal of Management Information Systems, Vol.19(No. 4), 9-30.
[6] Ghalandari, K. (2012). The Effect of
Performance Expectancy, Effort
Expectancy, Social Influence and
Facilitating Conditions on Acceptance of E-Banking Services in Iran: the Moderating Role of Age and Gender. Middle-East Journal of Scientific Research 12, Vol. 12(No. 6), 801-807.
[7] Kim, H.D., Lough, N., 2007. An
investigation into relationships among constructs of service quality, customer satisfaction, and repurchase intention in Korean private golf courses. ICHPER-SD J. Res. Health Phys. Educ Recreat. Sport Dance 2 (1), 14.
[8] Kivela, J., Inbakaran, R., Reece, J., 1999.
Consumer research in the restaurant environment, Part 1: a conceptual model of dining satisfaction and return patronage. Int. J. Contemp. Hosp. Manag. 11 (5), 205– 222.
[9] Ladhari, R., 2007. The effect of
consumption emotions on satisfaction and word- of mouth communications. Psychol. Mark. 24 (12), 1085–1108.
[10] Law, A.K., Hui, Y.V., Zhao, X., 2004.
Modeling repurchase frequency and Customer satisfaction for fast food outlets. Int. J. Qual. Reliab. Manag. 21 (5), 545–563.
[11] Laczniak, R.N., DeCarlo, T.E.,
1676
[12] Mardiana, S., Tjakraadmadja, J., &
Aprianingsih, A. (2015). DeLone–McLean
Information System Success Model
Revisited: The Separation of Intention to Use - Use and the Integration of
Technology Acceptance Models.
International Journal of Economics and Financial, Vol. 5(No.1), 172-182.
[13] Miyoung Jeong, Carolyn U. Lambert
(2001). Adaptation of an information quality framework to measure customers’ behavioral intentions to use lodging Web sites. Journal of Hospitaly Management, p131-p132
[14] Mishra, S. (2014). Adoption of
M-commerce in India: Applying Theory of Planned Behaviour Model. Journal of
Internet Banking and Commerce,
19(1), 1–18.
[15] Mousa Jaradat, M.-I. R., & Al Rababaa, M.
S. (2013). Assessing Key Factor that Influence on the Acceptance of Mobile
Commerce Based on Modified
UTAUT. International Journal of Business
and Management, 8(23), 102–113.
http://doi.org/10.5539/ijbm.v8n23p102
[16] Nassuora, A. B. (2013). Understanding
Factors Affecting the Adoption of Mcommerce by Consumers. Journal of Applied Sciences, 13(6), 913–918.
[17] Nilashi, M., Ibrahim, O., Mirabi, V. R.,
Ebrahimi, L., & Zare, M. (2015). The role of Security, Design and Content factors on customer trust. Journal of Retailing and Consumer Services, p57-p69.
[18] Niranjanamurthy, M. (2013). Advantages
and Disadvantage of M-Commerce. Analysis of E-Commerce and M-Commerce: Advantages, Limitations and Security Issues. 2 (6): 8.
[19] Olorunniwo, F., Hsu, M.K., Udo, G.J.,
2006. Service quality, customer
satisfaction, and behavioral intentions in the service factory. J. Serv. Mark. 20 (1), 59–72.
[20] Rahman, M. M., & Sloan, T. (2015).
Opportunities and challenges of
Mcommerce adoption in Bangladesh: An empirical study. Journal of Internet
Banking and Commerce, 20(3).
http://doi.org/10.4172/1204-5357.1000124
[21] Shah, M. U., Fatimee, S., & Sajjad, M.
(2014). Mobile Commerce Adoption : An Empirical Analysis of the Factors Affecting. Journal of Basic and Applied Scientific Research, 4(4), 80–88.
[22] Sun, Y., Wang, N., Guo, X., & Peng, Z.
(2013). Understanding the Acceptance of Mobile Health Services: a Comparison and Integration of Alternative Models. Journal of Electronic Commerce Research, 14(2), 183–200.
[23] Turban, E. (2012). Electronic Commerce
2012. Pearson 7th-Global Edition.
[24] Venkatesh, V., Morris, M. G. ., Davis, G.
B.., & Davis, F. D. (2003). User acceptance of information technology:
Toward a unified view. MIS
Quarterly, 27(3), 425–478
[25] Venkatesh, V., Thong, J., & Xin, X. (2012).
Consumer Acceptance And Use Of Information Technology:Extending The Unified Theory Of Acceptance And Use Of Technology. Forthcoming in MIS Quarterly, Vol. 36(No. 1), 157-178.
[26] Yakubu, N., Dasuki, S.I. (2018). Assessing
eLearning System Success inNigeria.
Journal of Information Technology