6183
AN EFFICIENT ALGORITHM FOR DATA CLEANSING
1Saleh Rehiel Alenazi, 2Kamsuriah Ahmad
1,2 Research Center for Software Technology and Management, Faculty of Information Science and Technology, Universiti Kebangsaan Malaysia, Bangi, Selangor, 43600, Malaysia
E-mail: 1[email protected], 2[email protected]
ABSTRACT
The data that have been collected from different resources might be redundant and duplicate. These data need to be cleaned in order for it to be used for other processing. The data should undergo detection process for any occurrence of duplication in the datasets. Two strategies are used to identify duplicates which are windowing or blocking. The aims of this paper are to review, to analyze and to compare algorithms in order to find the most efficient in terms of better accuracy and less number of comparisons. A comparison was made with the five most popular algorithms: DYSNI, PSNM, Dedup, InnWin and DCS++. Two benchmark datasets were used for the experiment, which are Restaurant and Cora. The results reveal that the DYNSI algorithm using both datasets gives high accuracy with respect to the number of comparisons. It is hoped that the results obtained from this study able to give the best review and comparison among the existing algorithms in producing high quality data and serve as a guidance to implement a better initiative for data storage system.
Keywords: Data Cleansing, Record Deduplication Deduction Algorithm, Windowing-based, Efficiency, Accuracy, Data Quality
1. INTRODUCTION
From organizational perspective, data cleaning is considered very crucial in data processing. Decisions might be inappropriate if the data elements used seem to be not suitable, incomplete, and inaccurate. It is important to make sure that operations on the database are carried out smoothly and efficiently with only quality data involved [1], [2]. Accessing valuable information which might improve decision making for industries and businesses seems critical because these data might be duplicated and redundant. When data from different sources are integrated, a huge party of dirty data may appear. These data will show errors in record values, duplication in records, spelling mistakes, null or illegal values, disobedience referential integrity and inconsistency in records [3], [4]. Duplication in data is one of the crucial issues of data cleaning tools which are affected by time and cost [5]. The production can be improved by using cleansed data and as a result quality decision might be produced [6]. In order to retrieve data quickly, better processing time, and improve decision making process, the data quality assurance is necessary. Since dirty data might effect on important decisions in businesses, organizations pay high attention in producing data quality [7]. Nominal data value indicates inappropriate reporting, incapacity to generate inclusive understanding the consumers from numerous
divisions and leads to an insufficient customer pleasure along with expenditures that cost amounts of dollars to the businesses.
Data mining is the way of knowledge extraction from huge databases [8]. In addition, for data mining and data integration, the record deduction duplicate and the repetition of data monitoring are considered as important topics in this area [6], [9]. Due to the increasing demand in data quality, several statistical and logical tools were put to overcome the problem [10].
6184
2. RELATED WORKS
To ensure data quality, detection of duplicate records is looked as one of the most important elements [17], [18]. Finding duplicates has a vital role in record linkage [18][19] while on the other hand getting an efficient and accurate detection of duplicates is the concern of the data mining and online analysis community [6][20]. It seems to be a very famous issue in several researches [22]. To improve the process of detecting duplicate data, it is necessary to reduce the number of comparison within the data. The process of scanning the data can be done in window or block method. These methods have some limitations and advantages.
The windows-size is firstly decided by Window-based methods’ functions (normally the records’ number that shall be scanned for duplication). This window slides once toward every cycle. The complexity arises when determining the best size of the window. In case the window size is small, several duplications would be missed. Likewise, unwanted comparisons are caused by the bigger size window. The data have to be sorted as required by window-based method. However, this process will increase processing time. To improve it, a number of comparisons need to be reduced. This can be done by restricting the resemblance measures on a little part of the dataset. Hernández and Stolfo (1998) developed a method called Sorted Neighborhood Method (SNM) or Windowing. The Windowing technique consists of three steps: Create key, Sort data, Merge [13], [23]. One major deficiency of SNM is found which is a “fixed-size-window” and it is somehow not easy to pattern. There are other Window-based algorithms such as DCS++, InnWin, PSNM, Dedup, and DYSNI. These algorithms will be reviewed in the next sections.
2.1 Duplicate Count Strategy++ (DCS++)
DCS++ overcome the issue relates to fixed size window and offer adaptive windows that vary the size on identified duplicate within that window without affecting the efficiency and effectiveness of SNM [14]. This algorithm sorts all the records according to the sorting key and put the records in current window sequentially. The record is selected from all records sequentially and check whether the record is in skip records list [6], [14].
2.2 Innovative Windows (InnWin)
Innovative Windows algorithm is a variant of SNM that raises window size on each detected
duplicate like DCS++ and terminates current window when successive non-duplicates surpass certain limit. This algorithm assumes that the duplicated records in sorted dataset increases the probability of finding more duplicates in neighborhood. Series of successive non-duplicates drops the probability of duplicates in neighborhood. Using this concept, it familiarizes window both for duplicates and non-duplicates and avoids redundant comparisons without losing effectiveness [13].
2.3 Progressive Sorted Neighborhood Method (PSNM)
Most of the pairs in the detection process are early organized by progressive duplicate detection. Progressive approaches have the aim of reducing the time after setting a duplicate [12]. By doing this, the similarities of all comparison candidates are expected so that most potential record pairs are firstly compared. In the duplicate detection process’ pair selection methods, there is a trade-off which is found by looking at the amount of the needed time when running a duplicate detection algorithm and the completeness of the result.
2.4 Dedup
Sorted Neighborhood Method (SNM) is a standard indexing algorithm that sorts dataset by using sorted key and moves fixed size window to compare records within that window. SNM works in three stages: first stage, sorting key is identified which is based on single attribute value or concatenates multiple attribute values. In second stage, this sorting key is used to sort all records in a database. In third stage, a fixed size window is moved according to Accumulative Adaptive Sorted Neighborhood Method (AASNM) over this sorted dataset. In each window, one record is compared to all records within this window [2].
2.5 Dynamic Sorted Neighborhood (DYSNI)
6185
3. EXPERIMENTAL EVALUATION
In this section, we present a thorough experimental evaluation of five algorithms which are DYSNI, PSNM, Dedup, InnWin and DCS++. The evaluation metrics, dataset used and setting up configurations for the experiments are discussed.
3.1 Evaluation Metrics
[image:3.612.97.293.526.599.2]The first parameter for evaluating an algorithm in order to compute the accuracy of the system is mainly determined by the number of duplicates detected. The correct detection of duplicate is generally regarded as true positive (TP). When a record is not duplicate but detected as duplicate then it is considered as false positive (FP). False negatives (FN) are the records that are duplicates but not detected as duplicates. The duplication detection measurement has been used to evaluate the performance of several duplication detection techniques in terms of Recall, Precision, F-Score. Recall also known as sensitivity, measures the ratio of correctly identified duplicates compared to all true duplicates. Precision also referred to as a positive predictor value, on the other hand, measures the ratio of correctly identified duplicates compared to all declared duplicates. In the information retrieval field, precision is widely used in combination with the recall as measures for visualization in precision-recall graph. Finally, F-score measure captures this tradeoff by combining recall and precision via a harmonic mean. So, it is a measure of accuracy of the experiment [24], [25]. Table 1 shows the mathematical formula for the three measures, namely; Recall, Precision, F-Score [6].
Table 1 The formula for quality measurement [6]
Quality Measure Formula
Precision TP/(TP+FP)
Recall TP/(TP+FN)
F-Score 2*( Precision * Recall)/(Precision
+ Recall)
The second element in the evaluation of any efficient duplication detection approach is the time required to get a result when the data are being cleaned and transferred to data warehouse. The amount of time that the algorithm takes to run a function of the length is called the processing time. The algorithms undergo the same data sets and the parameters and conditions whereby the processing time was recorded in the assessment of the time that is taken by the algorithm.
It is noticeable to consider the main challenge in reducing the number of physical comparison between the record with better processing and better accuracy. So, an algorithm shall be much more effective for duplicate detection when it is able to increase accuracy by reducing the number of comparison and reducing processing time. In order to achieve this, a counter is used in the algorithm to supervise how many comparisons were executed and the duplicate records were detected. Therefore, in this work, the execution time of the algorithms is considered very important to measure the efficiency of the algorithms [25].
3.2 Dataset Description
Two datasets are used to evaluate five algorithms, which are Restaurant and Cora dataset.
a) Restaurant Dataset
This dataset is a collection of records taken from ZAGAT and FODORS revolves around restaurant names [15]. Many researchers used this data set to evaluate their algorithms [26][27][1][6]. This dataset is comprised of 864 records with “name, address, phone, city and type” fields. The record consists of 112 duplicates with 432 in FODORS and 432 in ZAGAT.
When marking the duplicates, a process is written to compare the results of the algorithms with the marked dataset. The accuracy of marked duplicates is evaluated and it is encountered that after marking of duplicates, 222 duplicate records are identified out of 867 data records. While 224 duplicate records are available in the original source data and this is the only information available about the source data set. The formula to define the percentage error for marking duplicates is defined as: No. of duplicate records in the source data set minus No. of duplicate records encountered after the marking process divide by the Total number of records in the source data set) times 100. This is equivalent to (224-222 / 867) *100] = 0.23% which is quite low and almost negligible. After marking duplicates in the source data, the next step is to compare the results for each algorithm with this source dataset and to compute the values of precision, recall and F-score.
b) Cora dataset
6186 fields of author name, title, journal name, volume, pages, and date.
3.3 Experiment Setting
The developed algorithms is running in Windows 7 ultimate with Intel(R) processor Core(TM) I7 with RAM 6 GB. Java NetBeansIDE 8.2 is used to execute four algorithms which are InnWin, DCS++, PSNM and Dedup. But for DYSNI, the original code uses Python Jetbrains PyCharm 2016.
3.4 Sorting Key:
Defining the Sorting key is very important and vital aspect of sorting algorithms. Real duplicates are made closer by a perfect sorting key. Restaurant and Cora dataset attribute "phone” and “newreference” is used as a sorting key. For Cora dataset, attribute “newreference” is used. This attribute is composed of first author’s surname.
3.5 Similarity measurement
The similarity measurementcalculates the numerical similarity between two attribute values [31]. Records are considered as duplicate if two tuples are previously mentioned by predefined threshold are found similar [32]. There are a number of algorithms to identify similarity between the records proposed by previous researchers. For instance InnWin, DCS++ and PSNM used Levenshtein similarity measurement whereas Dedup and DYSNI used Jaro-Winkler similarity measurement. The threshold defines the average number of detected duplicates per comparison. To test for duplication of two datasets, the threshold value is set starting from 0.1 and increased by 0.1 until the threshold value reached 1.0.
3.6 Experimental Steps
The experiments are run using the following steps:
i. Run the algorithms in its environment
ii. Setting up the value such as datasets, sorting key and set the threshold to 0.1
iii. Start run algorithm and get the result
iv. Get the number of comparison and classify TP, FP, FN and compute the quality Measure.
v. Repeat all the steps above by increased the threshold value by 0.1 until 0.9.
vi. Repeat all the steps above using different dataset
vii. Repeat all the steps above using different algorithms.
4. EXPERIMENTAL RESULT
This section will show in details, the result obtained when the five algorithms (DYSNI, PSNM, Dedup, InnWin and DCS++) are executed using the steps identified in the previous sections.
4.1 Experimental Result Using Dedup algorithm
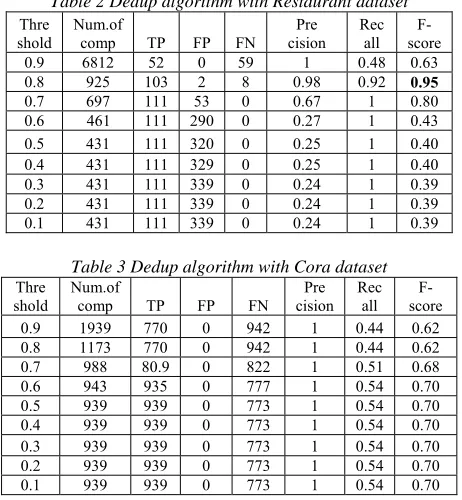
Table 2 shows the results of TP, FP, FN, precision, recall and F-score for Dedup algorithm with restaurant dataset. The TP, FN has good results when the threshold value is between 0.1-0.8. TP and FN gave good result to Recall value, whereas FP is good when threshold is greater than or equal to 0.8. However, FP value influent the results of Precision and F-score. The final result of F-score is 0.95 and the number of comparison is 925 when threshold is equal to 0.8,
However, when using Cora dataset, Dedup algorithm did not show a good performance because the existence of many non-duplicate records in the dataset. The best result of F-score is 0.708 when threshold is set at 0.5. Precision value is at 1 for all the experiments. The best value of FN is 773 when threshold is 0.5. This also leads to the best F-score value.
Table 2 Dedup algorithm with Restaurant dataset
Thre shold
Num.of
comp TP FP FN
Pre cision
Rec all
F-score
0.9 6812 52 0 59 1 0.48 0.63
0.8 925 103 2 8 0.98 0.92 0.95
0.7 697 111 53 0 0.67 1 0.80
0.6 461 111 290 0 0.27 1 0.43
0.5 431 111 320 0 0.25 1 0.40
0.4 431 111 329 0 0.25 1 0.40
0.3 431 111 339 0 0.24 1 0.39
0.2 431 111 339 0 0.24 1 0.39
0.1 431 111 339 0 0.24 1 0.39
Table 3 Dedup algorithm with Cora dataset
Thre shold
Num.of
comp TP FP FN
Pre cision
Rec all
F-score
0.9 1939 770 0 942 1 0.44 0.62
0.8 1173 770 0 942 1 0.44 0.62
0.7 988 80.9 0 822 1 0.51 0.68
0.6 943 935 0 777 1 0.54 0.70
0.5 939 939 0 773 1 0.54 0.70
0.4 939 939 0 773 1 0.54 0.70
0.3 939 939 0 773 1 0.54 0.70
0.2 939 939 0 773 1 0.54 0.70
0.1 939 939 0 773 1 0.54 0.70
4.2 Experimental Result Using DCS+ algorithm
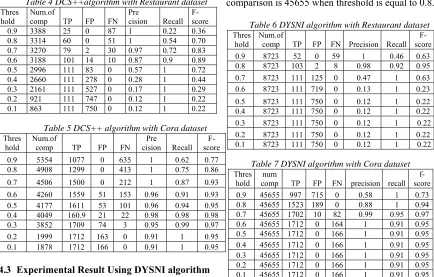
[image:4.612.303.534.417.667.2]6187 threshold is at 0.4, the FP value is very high. The values of FN are decreasing when the threshold is at 0.9. When the threshold between 0.1-0.5, the result for Precision is poor, but when the value increased, Precision shows a better performance. However, when the threshold is closed to 0.1, the value of Recall shows a better result. However, F-score shows poor accuracy with this dataset. The processing time increased when the threshold closed to 0.9. The best result of F-score is 0.89 when the threshold is at 0.6, and the number of comparison is 3188.
[image:5.612.87.521.327.604.2]Table 5 shows the result of DCS++ algorithm with Cora dataset. These results are almost the same with Restaurant dataset in term of FP, FN, Precision, Recall and F-score. The accuracy is average when the threshold ranges between 0.5-0.9. The final result of F-score is 0.98, and the number of comparison is 4049 when threshold is at 0.4.
Table 4 DCS++algorithm with Restaurant dataset
Thres hold
Num.of
comp TP FP FN
Pre
cision Recall F-score
0.9 3388 25 0 87 1 0.22 0.36
0.8 3314 60 0 51 1 0.54 0.70
0.7 3270 79 2 30 0.97 0.72 0.83
0.6 3188 101 14 10 0.87 0.9 0.89
0.5 2996 111 83 0 0.57 1 0.72
0.4 2660 111 278 0 0.28 1 0.44
0.3 2161 111 527 0 0.17 1 0.29
0.2 921 111 747 0 0.12 1 0.22
0.1 863 111 750 0 0.12 1 0.22
Table 5 DCS++ algorithm with Cora dataset
Thres hold
Num.of
comp TP FP FN
Pre
cision Recall F-score
0.9 5354 1077 0 635 1 0.62 0.77
0.8 4908 1299 0 413 1 0.75 0.86
0.7 4506 1500 0 212 1 0.87 0.93
0.6 4260 1559 51 153 0.96 0.91 0.93
0.5 4177 1611 53 101 0.96 0.94 0.95
0.4 4049 160.9 21 22 0.98 0.98 0.98
0.3 3852 1709 74 3 0.95 0.99 0.97
0.2 1999 1712 163 0 0.91 1 0.95
0.1 1878 1712 166 0 0.91 1 0.95
4.3 Experimental Result Using DYSNI algorithm
Table 6 shows the results of TP, FP, FN, Precision, Recall and F-score for DYSNI algorithm with Restaurant dataset. The FP works perfectly when the threshold is at 0.9, while it is poorly reduplicated when the threshold is closed to 0.1. The TP on the other hand shows a good result when the threshold approaches 0.9, while when the threshold approaches 0.1 it poorly works and is reduplicated when time being decreases. The FN on the contrast shows a bad result when the threshold is approaching 0.9 and it decreases when the
threshold approaches 0.1. The number of comparison is the same in all values. The Precision shows that when the threshold is approaching 0.9, it works well while when the threshold is approaching 0.1 the precision works poorly. The Recall on the other hand keeps increasing when the threshold approaches 0.1. The F-score shows a best result in this dataset with the same number of comparison for all the inputs. The good result of F-score is 0.95, and the number of comparison is 8723 when threshold is equal to 0.8.
Table 6 shows the result of Cora dataset based on DYSNI algorithm. The FP shows good results when the threshold approaches 0.1 and FN works good when the threshold approaches 0.9. The number of comparison is the same in all values. The Recall shows good result at all of threshold but for Precision and F-score they show good accuracy when the threshold ranges between 0.1-0.8. The final result of F-score is 0.97, and the number of comparison is 45655 when threshold is equal to 0.8.
Table 6 DYSNI algorithm with Restaurant dataset
Thres hold
Num.of
comp TP FP FN Precision Recall
F-score
0.9 8723 52 0 59 1 0.46 0.63
0.8 8723 103 2 8 0.98 0.92 0.95
0.7 8723 111 125 0 0.47 1 0.63
0.6 8723 111 719 0 0.13 1 0.23
0.5 8723 111 750 0 0.12 1 0.22
0.4 8723 111 750 0 0.12 1 0.22
0.3 8723 111 750 0 0.12 1 0.22
0.2 8723 111 750 0 0.12 1 0.22
0.1 8723 111 750 0 0.12 1 0.22
Table 7 DYSNI algorithm with Cora dataset
Thres hold
num
comp TP FP FN precision recall
f-score
0.9 45655 997 715 0 0.58 1 0.73
0.8 45655 1523 189 0 0.88 1 0.94
0.7 45655 1702 10 82 0.99 0.95 0.97
0.6 45655 1712 0 164 1 0.91 0.95
0.5 45655 1712 0 166 1 0.91 0.95
0.4 45655 1712 0 166 1 0.91 0.95
0.3 45655 1712 0 166 1 0.91 0.95
0.2 45655 1712 0 166 1 0.91 0.95
0.1 45655 1712 0 166 1 0.91 0.95
4.4 Experimental Result Using InnWin
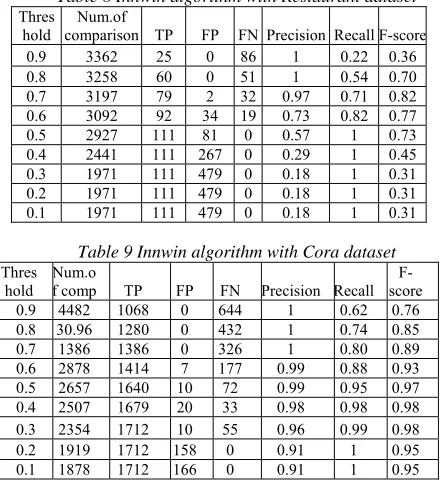
6188 good result is when the threshold is at 0.7. The F-score is 0.82 and number of comparison is 3197.
Table 9 shows the result of Cora dataset based on InnWin algorithm. When the threshold approaches 0.1, FP is increasing and decreases dramatically when the threshold approaching 0.9. It means that this method has poor performance in terms of FP when the threshold is very low. On the other hand, FN performs very poorly when the threshold is approaching 0.9 by failing to detect the duplicated records. However, precision is very high when the threshold is between 0.3-0.9. Also Recall works in contrast to Precision. i.e., it is approaching 0.9 when the threshold is approaching 0.1. Moreover, F-score gives result that is more inaccurate when the threshold approaching 0.9. This means, when threshold is high, this method cannot be used as it produces inaccurate results. The processing time performs in balance. The time increases gradually but not drastically when the input data are increasing. The good result of InnWin algorithm with Cora dataset is at threshold 0.4, the F-score is 0.98 and number of comparison is 1699.
Table 8 Innwin algorithm with Restaurant dataset
Thres
hold comparison TP Num.of FP FN Precision Recall F-score
0.9 3362 25 0 86 1 0.22 0.36
0.8 3258 60 0 51 1 0.54 0.70
0.7 3197 79 2 32 0.97 0.71 0.82
0.6 3092 92 34 19 0.73 0.82 0.77
0.5 2927 111 81 0 0.57 1 0.73
0.4 2441 111 267 0 0.29 1 0.45
0.3 1971 111 479 0 0.18 1 0.31
0.2 1971 111 479 0 0.18 1 0.31
0.1 1971 111 479 0 0.18 1 0.31
Table 9 Innwin algorithm with Cora dataset
Thres hold
Num.o
f comp TP FP FN Precision Recall
F-score
0.9 4482 1068 0 644 1 0.62 0.76
0.8 30.96 1280 0 432 1 0.74 0.85
0.7 1386 1386 0 326 1 0.80 0.89
0.6 2878 1414 7 177 0.99 0.88 0.93
0.5 2657 1640 10 72 0.99 0.95 0.97
0.4 2507 1679 20 33 0.98 0.98 0.98
0.3 2354 1712 10 55 0.96 0.99 0.98
0.2 1919 1712 158 0 0.91 1 0.95
0.1 1878 1712 166 0 0.91 1 0.95
[image:6.612.85.305.386.629.2]4.5 Experimental Result Using PSNM algorithm
Table 10 shows the results of TP, FP, FN, Precision, Recall and F-score PSNM algorithm with Restaurant dataset. The FP shows a good result when the threshold approaches 0.9 while on the other hand, it gives a bad result when the threshold approaches 0.1, Likewise FP, the TP has the same results. When the threshold approaches 0.9, the TP
is decreasing while when the threshold approaches 0.1, the TP increases. On the other hand, the FN gives different results. When the threshold approaches 0.9, the FN is increasing while if the threshold approaches 0.1, the FN is decreasing. The precision seems to be increasing when the threshold is approaching 0.9 and decreases when the threshold is approaching 0.1. This in turn has led the Recall to have different results that are the opposite of the Precision and it has also detected duplication. The F-score highest result is 0.82, and the number of comparison is 2598 when threshold is equal to 0.6.
Table 11 shows the result of Cora dataset based on PSNM algorithm. The analysis shows that the FP is decreasing when the threshold is approaching 0.1 while if the threshold is approaching 0.9 the FP is increasing. It means that this method has poor performance in terms of FP when the threshold is very low. The TP on the other hand is increasing when the threshold approaches 0.1 while it decreases when the threshold approaches 0.9. The FN as it appears decreases when the threshold is approaching 1 and it increases when the threshold approaches 0.1. For the precision, it increases when the threshold approaches 0.1 with a high number of comparisons. The time of processing is also increasing gradually but not drastically when the input data are increasing. Moreover, F-score (Accuracy) gives result that is more inaccurate when the threshold approaching 0.9. This means, when threshold is high, this method cannot be used as it produces inaccurate results. Also Recall works in contrast to Precision. i.e., it is approaching 0.1, when the threshold is approaching 0.9. The final result of F-score is 0.98, and the number of comparison is 2306 when threshold is equal 0.7.
Table 10 PSNM with Restaurant dataset
Thres hold
num
comp TP FP FN precision recall f-score
0.9 2419 25 0 86 1 0.22 0.36
0.8 2959 57 0 54 1 0.51 0.67
0.7 2831 73 2 40 0.97 0.64 0.77
0.6 2598 87 12 24 0.87 0.78 0.82
0.5 2289 93 56 18 0.62 0.83 0.71
0.4 1510 94 162 17 0.36 0.84 0.51
0.3 783 111 230 0 0.32 1 0.49
0.2 453 111 303 0 0.26 1 0.42
0.1 424 111 310 0 0.26 1 0.41
Table 11 PSNM with Cora dataset
Thres Hold
num
comp TP FP FN precision recall f-score
0.9 4572 978 734 0 0.57 1 0.72
0.8 3075 1493 219 0 0.87 1 0.93
[image:6.612.313.522.545.726.2]6189
0.6 1914 1712 0 154 1 0.91 0.95
0.5 1878 1712 0 166 1 0.91 0.95
0.4 1878 1712 0 166 1 0.91 0.95
0.3 1878 1712 0 166 1 0.91 0.95
0.2 1878 1712 0 166 1 0.91 0.95
0.1 1878 1712 0 166 1 0.91 0.95
4.6 DISCUSSION
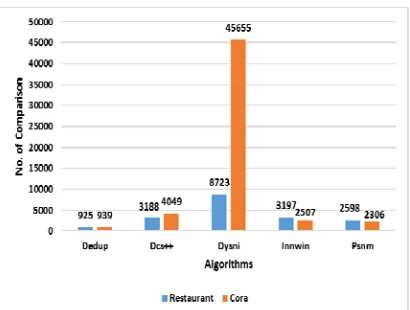
[image:7.612.91.301.238.373.2]This section is the summary of all the tables and results that are discussed in the previous section and summarized as appeared in Figure1 and Figure 2.
Figure 1 The F-Score for Five algorithms with Cora and Restaurant dataset
Figure 1 Comparison of five algorithms with Cora and Restaurant dataset
Figure 1 and Figure 2 represent the results in terms of number of comparison and F-Score of the five algorithms using Restaurant and Cora datasets. The experiments shown the different results based on the type of algorithm and the values of threshold that has influenced the good or poor results. The finding concludes that if the number of comparison is small and the F-score is high, then the algorithm able to perform well and produced good results. Dedup algorithm produced the best result when using Restaurant’s dataset with F-Score of 0.95 and the number of comparison is
925. Therefore, Dedup is the best in terms of accuracy when compared with the other four algorithms. However, DYSNI also produced F-score of 0.95 but the number of comparison is 8723, which is quite high and in fact the highest among the other four algorithms. The result for DCS++ algorithm on the number of comparison is 3188 and the F-Score is 0.89. This value is moderate; in fact the F-Score is not that high when the threshold value is closed to 1.0. Thus, the accuracy is poor here. For PSNM algorithm, the number of comparison is 2598 and the F-Score is 0.82. With regard to InnWin, the number of comparison is 3197 and the F-Score is 0.82. In terms of accuracy, InnWin did not show promising result.
Among the results of the five algorithms when using Cora dataset, Dedup is moderate in terms of the accuracy; with number of comparison are 939 and F-Score is 0.70. For the DCS++ the number of comparison is 4049 and the F-Score is 0.98. Although the F-Score has a good percentage, but with regard to the number of comparison, the accuracy is poor as other higher number of comparisons have better F-Scores. The DYNSI has F-Score value of 0.97, with the number of comparison is 45655. The accuracy is affected or poor in this case although the F-Score is somehow high. This is due to having the same number of comparison but with higher F-Score. The InnWin has 2507 as number of comparison and 0.98 for F-Score. The accuracy is poor, as the F-Score keeps increasing when the threshold reached to 1. PSNM has 2306 as the number of comparison and 0.98 as an F-Score. Also, the F-Score keeps increasing when the threshold value reached to 1, this lead to poor accuracy.
[image:7.612.91.296.405.560.2]6190 The findings from this paper is significant due to the fact that previous studies did not do an experiment using these five algorithms and make a comparison between them in terms of accuracy and the number of comparisons using Restaurant and Cora datasets. Previous studies only focus on one parameter of algorithms rather than accuracy and number of comparison in order to identify the accuracy of redundant data during data cleansing.
5. CONCLUSION
This paper described the experimental comparisons between five algorithms which are DYSNI, PSNM, Dedup, INNWIN and DCS++ using two datasets which are Restaurant and Cora. The aim of this paper is to find the best algorithms in identifying data redundancy during data cleansing in terms of accuracy and less number of comparisons. Based on the findings, it shows that when using Restaurant dataset, the Dedup and the DYNSI algorithm shows very good accuracy regardless of the number of comparisons. However, when using Cora database, DYNSI shows good accuracy, while Dedup shows poor accuracy. This study concludes that DYNSI is the best algorithm for detection of record duplication in terms of accuracy; however this algorithm used high number of comparisons. This study reveals that it is not easy to find a good algorithm that able to achieve better accuracy with less number of comparisons. Being able to reduce the number of comparisons between records indicates that the time taken to detect duplicate records is reduced. As future work, this study plan to improve DYNSI algorithm for better record duplication detection process. It is our hope that by improving this process the data will be cleansed and able to produce quality data for better decision making.
ACKNOWLEDGMENT
The authors would like to thank the Faculty of Information Science and Technology, Universiti Kebangsaan, Malaysia, for giving the opportunity to conduct this research. This research is funded by Universiti Kebangsaan Malaysia under Fundamental Research Grant Scheme FRGS/1/2014/ICT07/UKM/02/3.
REFRENCES:
[1] M. Rehman and V. Esichaikul, “Duplicate record detection for database cleansing,” in 2009 2nd International Conference on
Machine Vision, ICMV 2009, 2009, pp. 333–
338.
[2] V. Wandhekar and A. Mohanpurkar, “Proof Of Duplication Detection In Data By Applying Similarity Strategies,” in 2015 International
Conference on Information Processing (ICIP),
2015, no. Ncac, pp. 429–434.
[3] P. Ying, X. Jungang, C. Zhiwang, and S. Jian, “IKMC: An Improved K-Medoids Clustering Method for Near-Duplicated Records Detection,” Comput. Intell. Softw. Eng. 2009.
CiSE 2009. Int. Conf. on, 2009.
[4] H. Q, M. Xiang, and F. Sun, “An Optimal Feature Selection Method for Approximately Duplicate Records,” Inf. Manag. Eng.
(ICIME), 2010 2nd IEEE Int. Conf., 2010.
[5] S. R. Alenazi and Kamsuriah, “Record Duplication Detection in Database : A Review,” Int. J. Adv. Sci. Eng. Inf. Technol., vol. 6, no. 6, pp. 838–845, 2016.
[6] A. Skandar, M. Rehman, and M. Anjum, “An Efficient Duplication Record Detection Algorithm for Data Cleansing,” Int. J. Comput.
Appl., vol. 127, no. 6, pp. 975 – 8887, 2015.
[7] N. Idris and K. Ahmad, “Managing Data Source quality for data warehouse in manufacturing services,” in Proceedings of the 2011 International Conference on Electrical
Engineering and Informatics, 2011, vol. on,
1-, pp. 1–6.
[8] Lu´, I. Leit˜, and M. H. E. ao, P´ avel Calado, “Efficient and Effective Duplicate Detection in Hi- erarchical Data.,” erarchical Data. IEEE Trans. Knowl. Data Eng. Inst. Electr. Electron. Eng., 2012.
[9] X. Mansheng, L. Yoush, and Z. Xiaoq, “Property Optimization Method In Support Of Approximately Duplicated Records Detecting,” Intell. Comput. Intell. Syst. 2009. ICIS 2009.
IEEE Int. Conf., 2009.
[10] P. A. V. Hall and G. R. Dowling, “Approximate String Matching,” ACM
Comput. Surv., vol. 12, no. 4, pp. 381–402,
1980.
[11] B. Ramadan, P. Christen, H. Liang, and R. W. Gayler, “Dynamic Sorted Neighborhood Indexing for Real-Time Entity Resolution,”
Data Inf. Qual., vol. 6, no. 4, p. 15:1--15:29,
2015.
[12] T. Papenbrock, A. Heise, and F. Naumann, “Progressive Duplicate Detection,” IEEE
Trans. Knowl. Data Eng., vol. 27, no. 5, pp.
1316–1329, 2015.
6191 for duplicate detection,” Int. J. Softw. Eng. its
Appl., vol. 9, no. 1, pp. 95–104, 2015.
[14] U. Draisbach, F. Naumann, S. Szott, and O. Wonneberg, “Adaptive Windows for Duplicate Detection,” in 2012 IEEE 28th International
Conference on Data Engineering, 2012, pp.
1073–1083.
[15] A. McCallum, “Cora Dataset,”
.cs.umass.edu/~mccallum/. [Online]. Available:
https://hpi.de/naumann/projects/repeatability/d atasets/cora-dataset.html”.
[16] S. Tejada, “Restaurant dataset,” cs.utexas.edu.
[Online]. Available:
https://www.cs.utexas.edu/users/ml/riddle/data. html.
[17] G. Beskales, M. A. Soliman, I. F. Ilyas, S. Ben-David, and Y. Kim, “ProbClean: A probabilistic duplicate detection system,” in 2010 IEEE 26th International Conference on
Data Engineering (ICDE 2010), 2010, vol. pp.
1193-1, pp. 1193–1196.
[18] Singh, Gagandeep, and S. Saggar., “ProbClean: A probabilistic duplicate detection system,”
Int. J. Manag. IT Eng., vol. 3, 9 ., 2013.
[19] R. Van Bezu, S. Borst, R. Rijkse, J. Verhagen, D. Vandic, and F. Frasincar, “Multi-Component Similarity Method For Web Product Duplicate Detection,” n Proc. 30th
Annu. ACM Symp. Appl. Comput., vol. pp.
761-76, 2015.
[20] J. Kim and H. Lee., “Efficient Exact Similarity Searches Using Multiple Token Orderings,”
Data Eng. (ICDE), 2012 IEEE 28th Int. Conf.,
vol. on, p. 82, 2012.
[21] Shahri, H. Haidarian, and A. Z. B. Ahmad, “Data Mining For Removing Fuzzy Duplicates Using Fuzzy Inference,” Fuzzy Information,
2004. Process. NAFIPS’04. IEEE Annu. Meet.,
vol. of the. Vo, 2004.
[22] M. Gollapalli, I. W. X. Li, and G. Governatori, “Approximate Record Matching Using Hash Grams,” 11th IEEE Int. Conf. Data Min.
Work., 2011.
[23] S. J. S. M. A. Hernández, “Real-World Data Is Dirty: Data Cleansing And The Merge/Purge Problem,” Data Min. Knowl. Discov., vol. 2, no, 1998.
[24] S. Yan, D. Lee, M.-Y. Kan, and L. C. Giles., “Adaptive Sorted Neighborhood Methods For Efficient Record Linkage,” n Proc. 7th
ACM/IEEE-CS Jt. Conf. Digit. Libr., vol. pp.
185-19, 2007.
[25] A. Osama, Helmi, “A Comparative Study of Duplicate Record Detection Techniques,” Middle East, 2012.
[26] S. Tejada, C. A. Knoblock, and S. Minton, “Learning Object Identification Rules For Information Integration,” Inf. Syst., vol. 26, no. 8, pp. 607–633, Dec. 2001.
[27] D. Camacho, C. Elkan, and C. F. Tomas, “An Evolutionary Hybrid Distance for Duplicate String Matching,” 2008.
[28] M. Bilenko and R. J. Mooney, “Adaptive Duplicate Detection Using Learnable String Similarity Measures,” Proc. Ninth ACM
SIGKDD Int. Conf. Knowl. Discov. Data Min.,
pp. 39–48, 2003.
[29] W. W. Cohen and J. Richman, “Learning To Match And Cluster Large High-Dimensional Data Sets For Data Integration,” Proc. eighth ACM SIGKDD Int. Conf. Knowl. Discov. data Min., pp. 475–480, 2002.
[30] A. Dependences, P. Singla, and P. Domingos, “Object Identification with Attribute-Mediated Dependences Parag,” Springer, pp. 297–308, 2005.
[31] P. Christen, Data Matching. Berlin, Heidelberg: Springer Berlin Heidelberg, 2012. [32] A. K. Elmagarmid, P. G. Ipeirotis, and V. S.
![Table 1 The formula for quality measurement [6]](https://thumb-us.123doks.com/thumbv2/123dok_us/8905624.956678/3.612.97.293.526.599/table-formula-quality-measurement.webp)