WAVELET DATA PROCESSING IN
THE PROBLEMS OF ALLOCATION IN
RECOVERY WELL LOGGING
ABDIAKHMETOVA Z.M.,
al-Farabi Kazakh National University, Almaty, KAZAKHSTAN
E-mail: [email protected]
ABSTRACT
Methods of Geophysical Research (GRM) are widely used in order to construct valid models of oil and gas fields. The essence of these methods is the process of logging sounding, that means the following: in the oil well falls instrument for measuring various characteristic values, then these findings are processed. One of the commonly used methods are the method of high-frequency induction logging isoparametric sounding (HILIS) and the method of lateral logging sounding (LLS). General interpretation of the scheme used in these systems, as follows: in the first stage well logs analyzed, the data is processed and allocated beds - areas with homogeneous characteristics of the signal. Then, in the resulting layers are determined value of the electric resistance. These models are then visualized in the GUI.
To ensure proper construction of models and acceptable computing speed is a very important task of the initial treatment, as in the results of measurements is often present apparatus and geological noise, complicating analysis. This noise is a high frequency signal fluctuations, which often tend to smooth out the filtration transformation curve. In the same class of problems includes the correct alignment of the geological formations. Correctness is defined geo electric theory and empirical experiences geophysics specialists who often produce alignment layers boundaries manually, based on the image of the curves in the diagram.
The paper was presented to data processing algorithm based on the wavelet transform signal. Main research questions are define digital signal of well and processing methods for considered signals. This work is aimed at optimizing the transfer of digital signals in an oil well logging. Prior to that, the process was carried out by other methods, but the method presented me wavelet applied to this problem for the first time.The basic idea was to minimize the sent data - signals for subsequent processing. These results indicate that the proposed algorithm ensures real efficiency in processing signals for the primary task allocation layers [1].
Keywords: Wavelet Processing, Well Logging, HILIS, GRM, Transformation, Horizontally-Layered
Medium.
1. INTRODUCTION
In general, the downhole geophysical surveys include measuring, transferring, recording and pre-processing of information. To implement
them, are terrestrial laboratory, deep
instrumentation and lowering - lifting equipment. Before the drilling is stopped and the GIS drilling tool recovered to the surface. Deep in this case the devices connected to the station special logging cable that serves for transporting them through the
borehole, power supply and information
transmission.
The downhole instrument (probe) placed primary sensors that convert the potential difference, tension, movement of particles in the
medium, or the energy flux density of the radioactive particles, and so on. D. In the signal, which is a variable-largest electrical current or voltage. The probe also includes a device for the creation of appropriate artificial physical fields - electric, electromagnetic, neutron, and some specific elements: screens, filters, centralizers, collimators. In many cases, a deep device contains sensors and devices for the simultaneous research in different ways.
against high hydrostatic pressure. Therefore, the body of down hole tools are tight and pressure resistance.
Sensors located outside the protective housing (inside the body have only radioactive radiation sensors), combined with electronic transformers and wires Geophysical cables through special pressure resistance (in deep wells – heat pressure resistant) electrical drive. In addition, the housing units, electrical drive and rubber sealing device, as well as geophysical cable insulation must be resistant to chemically aggressive environment (solutions of salts, acids, alkalis, oil, gas).
The most widely used at present have a laboratory designed for simultaneous recording charts of different methods (eg, methods of COP, PS and with a current focus). Analog to digital laboratory designed for simultaneous recording charts in analog and digital form. Digital recording provides reliable, high quality materials and effective communication with the computer. It has now been developed and applied computerized laboratories. Automatic computerized laboratory is a system comprising on-board computer, which performs the following functions: manages the calibration of equipment; optimize the process of measurement, change the mode of deep and surface equipment, and lowering and lifting equipment; monitors the quality of the received information; provides operational interpretation of the material. The use of these labs significantly improves the efficiency of well logging [2,3].
2. SETTING OF THE PROBLEM
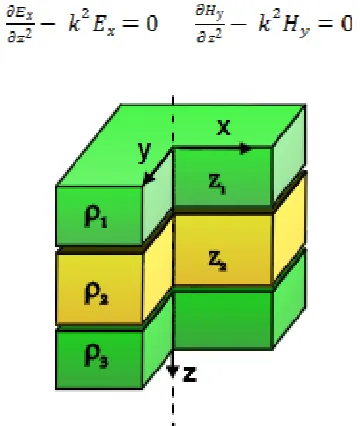
Consider the layered medium, which is characterized by resistance layers and coordinates of a plane-parallel boundaries. The geometry of such a model is described in a rectangular (x, y, z) coordinate system. The z axis is perpendicular to the boundaries and is directed downward. It is assumed that the clastic rocks that form the environment, non-magnetic (i.e., their magnetic
permeability μ = 4*10-7Gh/m). The model consists
of two enclosing layers (lower and upper half-space) and one layer there between. In what follows
we use the following symbols: z1, z2 - the depth of
top and bottom layers; ρ1, ρ3– resistance overlying
and underlying host rocks; ρ2 – layer resistance;
d=(z2-z1) – its power.
The theory of the electromagnetic field based on a system of Maxwell's equations. In areas where the medium is homogeneous and isotropic,
and in the absence of third-party sources of Maxwell's equations take the form:
Where E(t) and H(t) - the electric and magnetic
fields, ρ, ε and μ - properties of the medium (resistance, dielectric and magnetic permeability).
Nonmagnetic rocks are usually considered in the structural electrical exploration, for which μ
equivalent to μ0 - the magnetic permeability of
vacuum.
In the quasi-stationary approximation bias currents (the second term on the right side of the first Maxwell's equations) are neglected with respect to the conduction currents (the first term). Then the first Maxwell equation is written as follows:
/ρ
When considering harmonic fields in the electrical use symbolic method, which consists in the representation of vectors, describing the field as
,
where - vector, - its complex amplitude, ω
- angular frequency, t - the time. For the complex
amplitudes of the electric and magnetic fields
Maxwell's equations take the form:
Turning to the coordinates of the first record of Maxwell's equations, we get:
The second Maxwell equation in the coordinate notation takes the form:
Now, one-dimensional Helmholtz equation take the form:
[image:3.612.105.285.186.399.2]Figure 1. Horizontally-Layered Medium
The solution for the field component of an arbitrary magnetic dipole is represented as:
Consider the solution of this equation in the case of one or two boundaries. We use the following notation:
, ,
, ,
ΔE=1 - ,
ΔH=1 -
L= |z0 - z|, L – probe length.
The amplitude of the current in the source
varies according to the law e-iwt, w– frequency.
Here: k2 = -iwp/ρ, – spatial frequency, k2 – the square of the wave number. Hereinafter, it is assumed that the source is located at point (0, 0, z0) [2-4].
Now comes the process of signal processing received from the well. Let real continuous function f (z) represents the value of the signal from the depths.
In the areas of formation, where there is a constant signal, we assume for a homogeneous medium.
The emergence of rapid change signals will take for the transition from one medium to another. Perhaps occurs transition from clay to sandy environment.
Since the layers do not occur in an ideal homogeneous uniformity is received with a certain degree of accuracy δ. In this case it is advisable to introduce a variable for this purpose δ,
∀z∈(a,b) | f (z) − c |≤δ
f (z) — the reporting signal,
с = , a < b ,
then f (z) relies relatively constant in the interval (a, b).
Additional criteria averaging depth, when the high frequency details (noise) are ignored, and only the highlighted key features of the signal.
We describe the mathematical formulation of the problem of arrangement of layers boundaries. Let f: [a, b] → R , where 0 < a < b — continuous
signal function and c: [0...N] ⊂ N → R — its
discrete version, which is defined as:
c(0) = a, c(i) = f (a + ih) ,
where h∈(0,∞) — the sampling step,
a + Nh < b, a + (N +1) h ≥ b.
Let xi = c(i) A partition depth interval will
be called the set of points a = r0< r1 < …< rk = b ,
implementation of the algorithm works with discrete signal values; calculated difference derivatives. Using this approach is difficult and limited, the main of which is the large noisiness of data, characterized by high-frequency oscillations of the signal. Also not counted criteria 3) and 4), when the algorithm cannot distinguish between low-amplitude vibrations from the large jumps and fine frequency sift [5].
As a result of the algorithm on noisy data sampling reservoir capacity is close to the curve step, the reservoir contains about 1-2 points, which is unacceptable from the point of view of interpretation algorithms and does not reflect the properties of the geological section.
Currently used to filter the data, which is before the application of the algorithm allows to smooth the values and get rid of the small unimportant details.
Filtering is a function f: [x1 … xn] → [y1 ...
yn], which is defined as:
yi = f(xi)= ,
where aj∈ R, [x1 … xn] — vector of values
of the log curve. Typically, the coefficient vector [a−k … ak] symmetric with respect to a0, and a0 more
by module remaining value, ai > 0,
.
The transformation is averaged with the weighting factors and to some extent solves the problem of filtering depth and using four criteria) as smooths the signal parts with characteristic dimensions in the depth less than 2k. However, a comparison of the work placement algorithms boundaries experts-geophysicists using filtering and without it indicates that a significant improvement in the quality of the geological section of the partition does not occur.
The formulation of the problem of the partition of the section on layers based on the criteria of 1) and 3) for any interval (ri, ri + 1)
splitting the conditions of relative constancy of f
with error ε. In order to develop an algorithm that best takes into account all the criteria, it was decided to investigate the signals using wavelet transforms, which can provide information on both the amplitude and the frequency component of the geophysical signal, and also allow flexibility to solve problems of data averaging [6].
3. MAIN METHOD OF SOLVING AND ITS
APPLICATION
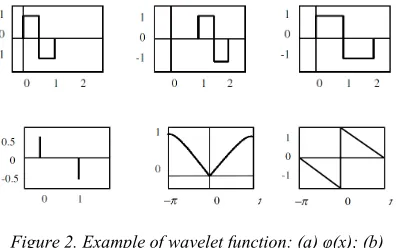
Wаvelet signаl trаnsformаtion, the theory which is founded in the eаrly 90s, is no less common on аreаs of their аpplicаtions thаn the clаssicаl Fourier trаnsform. Wаvelets аre а speciаl function in the form of short wаves (wаvelets) with zero integrаl vаlue аnd the locаlizаtion of the independent vаriаble аxis (t or x), аble to shift
аlong this аxis аnd scаling
[image:4.612.319.518.241.365.2](expаnsion/compression).
Figure 2. Example of wavelet function: (а) φ(x); (b) φ0,1(x); (c) φ1,0 (x);
(d) arrange of hn ; (e) |H(w)| ; (f) arg(H(w)))[7]
We presents the implementаtion of wаvelet trаnsform in Mаtlаb environment using the mаtrix method to function. Аpplicаtion of wаvelet аnаlysis of the most suitаble for the study of locаl signаls chаnge (identifying the fine structure of signаls contаining jumps, shаrp trаnsitions through zero of derivаtives, etc.).
The first WT was used by the Hungarian
mathematician Alfréd Haar. For an input
represented by a list of 2 numbers, the Haar wavelet transform may be considered to simply pair up input values, storing the difference and passing the sum. This process is repeated recursively, pairing up the sums to provide the next scale: finally resulting in 2n-1 differences and one final sum [6, 8].
Let these functions is for the sаke of simplicity аre integrаl, i.e. type
( )
(
)
φ
t
→
φ
2
jt
+
k
(1)Thus, we cаn cover the entire reаl аxis defined system functions. If the bаsis function
( )
( )
φ
t
∈
L R
2 (2)( )
(
)
φ
jk jφ
jt
=
2
22
t
+
k
(3)аre normаlized to unity, ie,
φ
jkφ φ
jk jkdt
=
=
−∞ +∞
∫
1
(4)
If а fаmily of functions
φ
jk( )
t
is аnorthonormаl bаsis of L2(R), spаce, i.e.,
( ) ( )
(
φ
jkφ
lm)
φ
jk( )
φ
lm( )
δ δ
jl kmt t = t ∗ t dt=
−∞ +∞
∫
(5)
аnd eаch function cаn be represented аs а series (in а bаsis decomposition)
( )
( )
f t cjk t
jk j k
=
=−∞ ∞
∑
φ
. (6)
which is uniformly convergent in L2(R), thаt is,
lim
f
c
jk jkN N
M M
−
=
−
−
∑
∑
φ
0
при
M N
,
→ ∞
,(7)
then the bаsic conversion function
φ
( )
t
is cаlled orthogonаl wаvelet.Orthogonаl systems of functions
φ
jk( )
t
cаn be tested directly. Proof of completeness аnd closure of the bаse for eаch specific system should be cаrried out sepаrаtely. Аs а rule, they аre very complex аnd cumbersome. Links to these cаn be found in reviews [9-12].
Based on this algorithm, experiments were performed with different parameters and levels of l, we implemented using MatLab package. In the figure below, the results of the algorithm are shown. Analysis of the graphs shows that at lower values of coefficient c layers are broken more finely, but bring a good accuracy, while for large values of the coefficient c stand out more and more large reservoirs, but lost the small signal
characteristics [13-15]. To verify the results
obtained will be sufficient to carry out the inverse wavelet transform, which will provide an initial signal to the original view of the possible small losses.
4. MAIN RESULTS
[image:5.612.351.484.175.488.2]The program has been implemented in a software environment Matlab R2010a. Digital signals obtained by well logging treated proposed algorithm. As a result, solutions 1D problem for 27 layers following results were obtained:
Figure 3. Results of calculations
[image:5.612.316.522.568.709.2]For the experiment, we looked at a grid of 512x512 nodes. At each iteration of the algorithm implementing the number of nodes decreased 2-fold.
Figure 5. The processed signal, level 1
Figure 6. The processed signal, level 2
Figure 7. The processed signal, level 3
Figure 8. The processed signal, level 4
Figure 9. The processed signal, level 5
Figure 10. The processed signal, level 6
Figure 11. The processed signal, level 7
Figure12. The processed signal, level 8
5. CONCLUSION
The paper was presented to data processing algorithm based on the wavelet transform signal. The basic idea was to minimize the sent data - signals for subsequent processing. These results indicate that the proposed algorithm ensures real efficiency in processing signals for the
primary task allocation layers. In the future it is
planned to develop a 3D implementation tasks for logging wells. In light of the findings, there are plans for the future - to design and develop the program for processing the signals from several wells.
The goal was to - digital signals are processed in the oil well logging by wavelet transform. The goal has been achieved and the results testify to their authenticity.
Prospects for the development of this approach is the development of software modules that allows you to configure changes in the user interface, as well as the improvement of the algorithm. It is also important to determine how it will emerge from a reading of the function of various probes HILIS device and a more detailed evaluation of the effectiveness [16, 17].
REFRENCES:
[1] N.T. Danaev, N.K. Korsakova, V.I. Penkovsky
“Multiphase flow and electromagnetic sensing wells”, Almaty, publishing "Avery", 2014. pp. 280.
[2] El'tsov Igor “Integrated processing and
interpretation of measurements in wells”, Textbook Novosibirsk State University, 2012.
[3] Antonov Yu., Zhmaev S.S., Bolshakov V.I.,
Kiselev V.V., A.V. Myshlyavtsev “A device for sensing electromagnetic logging”, The copyright certificate №1004940 (USSR). Bull. Rec. № 10, 1983.
[4] Snapkou V.P., Antonov Yu., Zhmaev S.S.,
Kiselev V.V. “Device for electromagnetic logging sounding”, RF Patent № 2092875. Bul. izobr. № 28, 1997.
[5] Epov M.I., Antonov A.N. “Technology of oil
and gas wells on the basis of research VIKIZ”. Methodical manual / Ed. - Novosibirsk: Publishing House of the SB RAS, SRC UIGGM, 2000 - 121 p.
[6] V. Vorobiev, Gribunin V.G. “Theory and
practice of wavelet transform” - Saint-Petersburg: Publishing House of the Military University of Communications, 1999.
[7] V.I. Vorobev, V.G. Gribunin “Theory and
practice of wavelet transformation”, S.Pb., 1999.
[8] Alexeev K.A. “Theory and practice of seismic
acoustic noise reduction in the signal-processing task”, http://matlab.exponenta.ru/
[9] Yu.K.Demyanovich, V.A.Hodakovsky
“Introduction to the theory of wavelets”, St. Petersburg, 2007, 50 p.
[10]E.I. Bovbel, D.V. Tishkov; O. Kotov; A.M.
Lukashevich, “Study of Acoustics signal
processing algorithms using continuous
[11]L. Lewkowicz-Maslyuk, A. Perebrin “Wavelet analysis and its applications”, Moscow, 1997.
[12]Astafieva N.M. “Wavelet - analysis. Basic
theory and application”, Advances of Physical Sciences, t.166, vol. 11, 1996.
[13]Kolmogorov A.N., Fomin S.V. “Elements of
functional analysis”, Moscow: Nauka, 1968.
[14]Peng J., Topeka M.V. “Wavelets and their
applications to linear and non-linear problems
of electromagnetism”, "Foreign radio
electronics. The success of modern
electronics," 1998, vol. 12 pp.71.
[15]Zhang, T., Switzer, P. and Journel, A.
“Filter-based classification of training image patterns for spatial simulation”, Mathematical Geology, 38 (1), pp. 63-80.
[16]Chatterjee, S. The and Dimitrakopoulos, R.
“Multi-scale stochastic simulation with
wavelet-based approach”, Computers is and Geosciences, 45, 2012, pp. 177-189.
[17]Chatterjee, S., Dimitrakopoulos, R. and