ISSN: 1992-8645 www.jatit.org E-ISSN: 1817-3195
408
A HIDDEN MARKOV MODEL TO PREDICT HOT SOCKET
ISSUE IN SMART GRID
1
ISMA FARAH SIDDIQUI, 2ASAD ABBAS, 3*SCOTT UK-JIN LEE 1,2,3
Department of Computer Science and Engineering, Hanyang University ERICA, Ansan, South Korea *
Corresponding Author
E-mail: [email protected], [email protected], [email protected]
ABSTRACT
Smart meters collect sensor data at distribution ends of smart grid. The collection process performs non-stop data bundling and results in ‘hot socket’ issue due to high resistance. This results an abnormal generation of dataset and overall severely affect the operational aspects of smart grid. In this paper, we present a model for Smart Meter Abnormal Data Identification (SMADI) over the communication bridge of Smart grid repository and distribution end units, to redirect abnormal samples to HBase error repository using Message propagation strategy. SMADI predicts possible hot socket smart meter node through HMM and generates a sequence of possible hot socket smart meters over time interval. The simulation results show that SMADI precisely collect error samples and reduce complexity of performing data analytics over giant data repository of a smart grid. Our model predicts hot socket smart meter nodes efficiently and prevent computation cost of performing error analytics over smart grid repository.
Keywords: IoT, Smart meter, Smart grid, HBase, Hot Socket.
1. INTRODUCTION
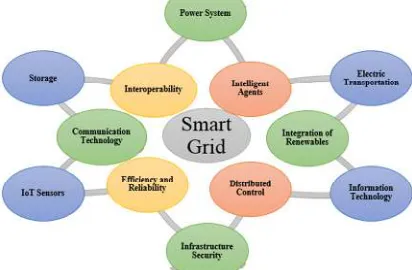
[image:1.612.316.522.402.546.2]The concept of smart grid has enabled many state-of-the-art ideas to prevail in the technological world. It is a giant automated paradigm that enables to deliver efficient electrical operations around a metropolitan hub [1]. The smart grid consists of power system, giant storage, intelligent agents, electric transportations, interoperability, integration of renewables, distributed controls, information technology, efficiency and reliability of system, communication technology, IoT devices and infrastructure security [2] as seen from Figure-1.
[image:1.612.91.297.559.694.2]Figure 1: Smart Grid Paradigm
Figure 2: Architecture Of Smart Grid
ISSN: 1992-8645 www.jatit.org E-ISSN: 1817-3195
409 stored over smart grid repository [10]. The smart grid core performs multiple type of analytics over stored dataset [11] and uses repository to perform functional processing of smart grid [12] as seen from Figure-2.
Smart meters process sensor datasets round the clock [13] and results in decrease of lifespan [14]. As a result, smart meters are affected with ‘hot socket’ problem [15] and generate abnormal temperature and load point dataset. The researcher presented two models to identify temperature and load point faults in previous study. However, related work could not perform abnormality analytics over temperature and load point dataset and prediction of exact status of smart meter through functional dataset. Moreover, we know that, ‘hot socket’ problem is a hardware based issue [16] and smart meter become useless after having it. Therefore, we present an error analytical solution to the said problem.
We propose a software solution to avoid above mentioned ‘hot socket’ problem. The proposed SMADI scheme performs scan of abnormal temperature and load points of smart meter and fetch them to the HBase repository. After that, SMError module fetch error dataset for training the model and predict fault analysis before a smart meter reached over dead end.
The main contributions of the proposed scheme are:
• An enhanced smart meter temperature and load point scanner.
• An efficient data points bundler.
• A column family based storage of error data in the HBase.
• A novel SMError module over message propagation model.
• An efficient data trainer of SMError module.
• A precise prediction model for possible protection of ‘Hot Socket’ problem.
The remaining paper is organized as follows. Section II briefly explains proposed approach SMADI. Section III explains experimental environment and SMADI scheme results. Finally, section IV shows conclusion with significant contributions and future research directions.
2. SMART METER ABNORMAL DATA
IDENTIFICATION (SMADI)
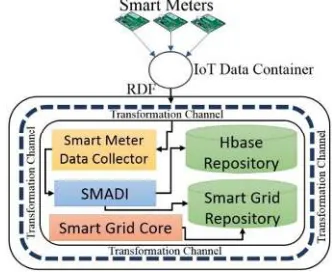
[image:2.612.333.499.240.376.2]The proposed model is categorized in two phases i.e. (i) Error data analytics and (ii) Hot socket prediction. When a smart meter generates a dataset of CSV file format [17], it is transformed into RDF format and stored over Smart meter data collector (SMDC). SMADI collect the data sample and perform scanning to collect error samples in dataset. The resultant collection is bundled in the form of Hadoop Archive (HAR) [18] and stored over Hbase [19] repository. Furthermore, SMADI train HBase dataset and predict hot socket smart meters as seen from Figure-3.
Figure 3: SMADI Enabled Smart Grid
2.1 Error Data Analytics
Error data analytics (EDA) is categorized into three phases i.e. (a) Sample scanner, (ii) Sample Bundler and (iii) HBase storage.
2.1.1 Sample Scanner
The Sample scanner fetches abnormal element from dataset sample having set of load points Lp and temperature points Tp. The collection of smart meter data elements can be represented as,
, (1)
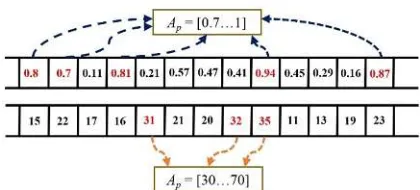
A modified text string algorithm TSPLFC [20] is used to scan abnormal elements over DataSet. There are two changes in current algorithm i.e. (i) Scanning large buffer of data at a time and (ii) Simultaneous identification of dataset elements Lp and Tp.
Suppose we process DataSet= [0…m-1,0…n-1] over an abnormal pattern Ap = [0…s-1]. The modified TSPLFC algorithm compare Tp and
Lp over pattern of Ap and fetch result set in array of
ISSN: 1992-8645 www.jatit.org E-ISSN: 1817-3195
[image:3.612.89.299.125.220.2]410 bundle resultant sample for bundle processing as seen from Figure-4.
Figure 4: Modified TSPLFC Based Sample Scanning
2.1.2 Sample Bundler
The sample bundler (SB) is a paradigm to write Ap dataset over a DFS file. At first, SB collect
Ap result set to SBBuffer. A single sample of buffer collection can be represented as,
, , (2)
The DFS write socket fetch SBBuffer text over a single index SBIndex and textoutputformat [21] write entries over file format SBFile as seen from Figure-5.
Figure 5: Sample Bundler data format
2.1.3 Sample HBase Storage
The Sample HBase Storage (SHS) is a Hadoop [22] repository to store SBFile for error analytics. For this purpose, we created a table
SMErrorTable over SBFile format. The SMErrorTable configuration can be observed through Figure-6.
Figure 6: Hbase Smart Meter Error Repository
2.2 Hot socket prediction
Hot socket prediction is categorized into three phases i.e. (i) SMError Module, (ii) Data trainer and (iii) Hot Socket Prediction.
2.2.1 SMError Module
SMError Module (SMM) is a paradigm to collect SMErrorTable data conditionally for hot socket prediction. SMM is derived through Belief
propagation method [23] that helps to fetch conditional data elements from HBase repository. In order to perform inference on belief propagation, we choose Message propagation model [24] that fetch a message m of variable container i having value ϰi with a belief bi (ϰi) and propagate from source container a to destination container i and presents likeliness of random variable Xi where ϰi ϵ Xi by [25],
→!"ϰ!$ (3)
The information message of Key (k), SMID (S), Location (Lo), ApTp (TP) and time (Tm) to TemperatueColumnFamily (T) can be represented as,
%& →'& ϰ'& (4) & →'& ϰ'& (5) ()& →'& ϰ'& (6) '* & →'& ϰ'& (7) '+& →'& ϰ'& (8)
After receiving container message to
TemperatueColumnFamily container, belief of T container can be represented as,
,! ϰ'&
∝ . %&, &,()&, '* &,'+& → %&,&,()&, '* &,'+& ∈0"' + &$
9
We normalize eq (9) with constant z and the belief of Ti can be represented as,
,! ϰ'& 1
2 3 . %&, &,()&, '* &,'+& → %&, &,()&, '* &,'+& ∈0"'&$
1 0
Similarly, LoadColumnFamily (L) belief with Key (k), SMID (S), Location (Lo), ApLp (LP) and time (Tm) can be obtained,
,! ϰ'& 1
2 3 . %&, &,(&, ()* &,'+& → (& ϰ(& %&, &,()&, (* &,'+& ∈0"(&$
4 11
ISSN: 1992-8645 www.jatit.org E-ISSN: 1817-3195
411
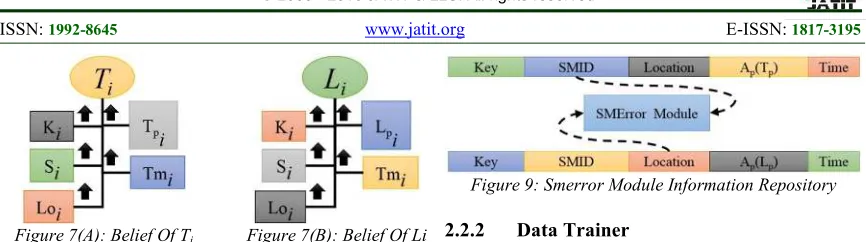
Figure 7(A): Belief Of Ti Figure 7(B): Belief Of Li
In order to forward container messages Ti and Li to SMError module, we calculate joint belief of Ti and Li. The joint belief is represented as a logical container L and can be represented as,
,("ϰ($ ,5"65$ (12)
where 65 7ϰ'&,ϰ(&: !, ! ∈ 9" $ : and ϰ( is the domain space linked with logical container L as seen from Figure-8.
Figure 8: Belief Of Factor A (Logical L)
The domain space ϰ( equals to ; ϰ'&,ϰ(& | =5 ϰ'&,ϰ(& 1, ϰ'& ∈ >'&,?(& ∈ >(&@ and factor fA is bipartite string between joint containers. The joint belief of container L can be obtained as,
,("?($ 12 . "'&,(&$→("?($ "'&,(&$ ∈0"($
(13)
After applying factor fA to SMError, we receive a close form solution as,
"'&,(&$→("?($
=5"65$ . "'&,(&$→("?($ "'&,(&$∈0"($
(14)
Where "'&,(&$→("?($ represents collection of temperature and load messages in SMError module equivalent to factor FA filtered messages over
LoadColumnFamily and TemperatureColumnFamily
.
[image:4.612.91.524.67.188.2]Moreover, Figure-9 shows the collection process of smart meter temperature and load points into SMError Module.
Figure 9: Smerror Module Information Repository
2.2.2 Data Trainer
The Data trainer (DT) train temperature and load points present in SMError module. After that it predict whether a smart meter is tending toward hot socket issue or at a stable position. For this reason, we use Hidden Markov Model (HMM) [26] that provide a self-learning mechanism to train dataset. Therefore, we insert information related to ‘Faulty’ and ‘Not Faulty’ from SMError module. After that, we create a transition matrix that contain the probability of hidden states. By default, HMM have hidden states as 2 ABC, BDE, transition probability at a condition !F 7GHIJC KF|I KFL:, observation state 6 AKC, KD, KM, KNE and emission probability ,!F. After, we apply
HMM to our DT, we observe
[image:4.612.313.531.394.486.2]O A C, D, M, N, 0E over hidden states i.e. Faulty and Not Faulty as seen from figure-10.
Figure 10: HMM Observable And Hidden States
According to the definition, we get,
P "Q, R, S$ (15)
ISSN: 1992-8645 www.jatit.org E-ISSN: 1817-3195
412
Figure 11: Smart Meter Hot Socket Fault Analysis
Finally, DT model is trained with smart meter load and temperature points through SMError module. We train model through Expectation-Maximization (EM) algorithm [27] that find likelihood elements over maximizing parameters with maximum similarities until best fit appear to DT model.
At first, we calculate observable sequence probability (Ot, Ot+1, Ot+2) and uses EM algorithm in two steps. The first step calculates expected likelihood from current estimation and second step calculate parameters maximizing expected fault status likelihood as observed from Algorithm-1.
2.2.3 Hot Socket Prediction
DT model uses Viterbi algorithm [28] to Calculate hidden states of hot socket fault analysis. Initially, the algorithm depicts optimal state sequence and expose hidden states of DT model
λ=(π,A,B) with O A C, D, M, N, 0E and finally calculate sequence of states Sstates= {S1,S2,… Sn} as,
TUVWXYZ[ Z\]YZ^_`"T_WZWa_;c;P$ (16)
where Soptimal reflects the optimal state sequence. Viberti algorithm allow Soptimal to retrieve possible
optimal paths at each step t that end at n states. At
[image:5.612.91.304.73.202.2]t+1, S hold to increase and optimal path for n is updated. At t+2, S comes at maxima job-likelihood and optimal path for n is updated and predicts the hidden state i.e. ‘faulty’ or ‘not faulty’ from collected observations O of smart meters as seen from Figure-12.
Figure 12: Smerror Hot Socket Prediction In Smart Meters
3. EXPERIMENTAL EVALUATION
In this section, we evaluate our proposed model over a configuration of cluster as seen from Table-1.
Table 1: Cluster Configuration.
3.1 Environment
Our cluster consists of Intel Xeon with 8 CPUs, 32GB memory and storage facilities i.e. HDD 1TB disk, 128 GB Samsung SSD. Similarly, we also use Intel core i5 with 4 Core, 16GB memory and storage facilities i.e. HDD 1TB disk, 128 GB Samsung SSD. For virtual environment, we used virtualbox 5.0.16 for installing 5 virtual machines on discussed machine configurations as seen from Table 2.
Table 2: Virtual Machine Configuration Over Hadoop Cluster.
Node CPU Memory Disk Configuration Master
Node
6 16 GB HDD & SSD Intel Xeon
Slave1 2 4GB HDD & SSD Intel Xeon Slave2 2 4GB HDD & SSD Intel Core i5 Slave3 2 4GB HDD & SSD Intel Core i5
Slave4 2 4GB HDD & SSD Intel Core i5
3.2 Experimental Dataset
[image:5.612.89.300.369.572.2]ISSN: 1992-8645 www.jatit.org E-ISSN: 1817-3195
413 3.3 Experimental Results
The experiments conducted to evaluate our scheme are (i) Temperature and load scanner (ii) Data Bundler (iii) Message Response of SMError module (iv) SM hot Socket prediction.
3.3.1 Temperature and load scanner
In order to evaluate the efficiency of Sample scanner, we perform scan analysis over two datasets i.e. Off Block and Peak Block. The off block dataset consists of normal load processing while Peak block dataset includes extreme load processing. We evaluate that off block dataset having 100 smart meters’ data samples scan 1.2% error in temperature and 2.5% error in load points in ‘1890’ and ‘2712’ seconds averagely as seen from Figure-13.
Figure 13: Off Block Temperature And Load Analysis
Moreover, we evaluate that peak block data having 100 smart meters’ data sample scan 1.7% error in temperature and 2.9% error in load points at ‘2090’ and ‘3105’ seconds averagely as seen from Figure-14.
Figure 14: Peak Block Temperature And Load Analysis
3.3.2 Data Bundler
After the error analytics complete fetching tempered temperature and load points, SB_read method store the result set over SB_container. The SB_container is capable to store double primitive
data of temperature and load points with SMID information. After the End_of_File (EOF) method is invoked at file_length limitation, bundler compile the DFS file as SBFile. We evaluate that data bundler in off load dataset write ‘2207’ entries of temperature over ‘2251’ seconds averagely. Furthermore, we evaluate that data bundler write ‘2811’ entries of load over ‘2876’ seconds averagely as seen from Figure-15.
[image:6.612.336.491.267.537.2]Moreover, we evaluate that data bundle in peak load dataset write ‘2417’ entries of temperature over ‘2486’ seconds averagely. Furthermore, we evaluate that data bundler write ‘3105’ entries of load over ‘3148’ seconds averagely as seen from Figure-16.
Figure 15: Off Block DFS File Write
Figure 16: Peak Block DFS File Write
[image:6.612.115.279.315.440.2]ISSN: 1992-8645 www.jatit.org E-ISSN: 1817-3195
414
Figure 17: Hadoop Cluster Bandwidth Utilization
3.3.4 Smart Meter Hot Socket Prediction After training DT model, we run multiple simulations of predictions for possible Hot socket smart meter status i.e. Faulty and Not Faulty. We evaluated proposed scheme for three hours. At first hour of prediction, we predict ‘12’ smart meters could appear possible hot socket issue and ‘88’ smart meters do not present hot socket issue over a data sample of ‘5’ GB dataset. In the second hour of prediction, we predict we predict ‘14’ smart meters could appear possible hot socket issue and ‘86’ smart meters do not present hot socket issue over a data sample of ‘10’ GB dataset. In the last third hour of prediction, we predict we predict ‘18’ smart meters could appear possible hot socket issue and ‘82’ smart meters do not present hot socket issue over a data sample of ‘20’ GB dataset as observed from Figure-18.
Figure 18: Smart Meter Prediction For Hot Socket Issue
4. CONCLUSION
This paper proposes a novel scheme to a state-of-an-art problem ‘hot socket’ in smart meters. The proposed approach scan tempered data samples and store it over a HBase repository. Furthermore, it synchronizes precise data samples over SMError module as a data source and predict
hot socket possibility in smart meters. The experimental evaluation shows that SMADI is an efficient approach that predict hot socket issue before it appears in smart meters and reduce complexity of predicting hot socket problem over smart grid repository. In future, we would focus to work over domain integrated issues of smart meters.
ACKNOWLEDGEMENT
This work was supported by the National Research Foundation of Korea(NRF) grant funded by the Korean government (MSIP) (No. NRF-2016R1C1B2008624)
REFRENCES:
[1] M. L. Tuballa and M. L. Abundo, "A review of the development of smart grid technologies,"
Renewable and Sustainable Energy Reviews, vol. 59, pp. 710–725, Jun. 2016.
[2] S. Bera, S. Misra, and J. J. P. C. Rodrigues, "Cloud computing applications for smart grid: A survey," IEEE Transactions on Parallel and Distributed Systems, vol. 26, no. 5, pp. 1477– 1494, May 2015.
[3] B. L. Risteska Stojkoska and K. V. Trivodaliev, "A review of Internet of things for smart home: Challenges and solutions," Journal of Cleaner Production, Oct. 2016.
[4] S. Chren, B. Rossi, and T. Pitner, "Smart grids deployments within EU projects: The role of smart meters," 2016 Smart Cities Symposium Prague (SCSP), May 2016.
[5] F. Khan, A. u. Rehman, M. Arif, M. Aftab and B. K. Jadoon, "A survey of communication technologies for smart grid connectivity," 2016 International Conference on Computing, Electronic and Electrical Engineering (ICE Cube), Quetta, 2016, pp. 256-261.
[6] D. Niyato and P. Wang, "Cooperative transmission for meter data collection in smart grid," IEEE Communications Magazine, vol. 50, no. 4, pp. 90–97, Apr. 2012.
[7] X. Su, H. Zhang, J. Riekki, A. Keränen, J. K. Nurminen, and L. Du, "Connecting IoT sensors to knowledge-based systems by transforming SenML to RDF," Procedia Computer Science, vol. 32, pp. 215–222, 2014.
[8] V. C. Gungor et al., "Smart grid technologies: Communication technologies and standards,"
ISSN: 1992-8645 www.jatit.org E-ISSN: 1817-3195
415 [9] D. Niyato, L. Xiao, and P. Wang,
"Machine-to-machine communications for home energy management system in smart grid," IEEE Communications Magazine, vol. 49, no. 4, pp. 53–59, Apr. 2011.
[10] A. Pena and Y. K. Penya, "Distributed semantic repositories in smart grids," 2011 9th IEEE International Conference on Industrial Informatics, Jul. 2011.
[11] V. C. Gungor et al., "A survey on smart grid potential applications and communication requirements," IEEE Transactions on Industrial Informatics, vol. 9, no. 1, pp. 28–42, Feb. 2013. [12] H. Farhangi, "The path of the smart grid," IEEE
Power and Energy Magazine, vol. 8, no. 1, pp. 18–28, Jan. 2010.
[13] P. Siano, "Demand response and smart grids— A survey," Renewable and Sustainable Energy Reviews, vol. 30, pp. 461–478, Feb. 2014. [14] N. Phuangpornpitak and S. Tia, "Opportunities
and challenges of integrating renewable energy in smart grid system," Energy Procedia, vol. 34, pp. 282–290, 2013.
[15] Z. Bao and Z. Li, "Identifying hot socket problem in smart meters," 2016 IEEE Power and Energy Society General Meeting (PESGM), Jul. 2016.
[16] D. Alahakoon and X. Yu, "Smart electricity meter data intelligence for future energy systems: A survey," IEEE Transactions on Industrial Informatics, vol. 12, no. 1, pp. 425– 436, Feb. 2016.
[17] D. George and L. G. Swan, "A method for distinguishing appliance, lighting and plug load profiles from electricity ’smart meter’ datasets,"
Energy and Buildings, vol. 134, pp. 212–222, Jan. 2017.
[18] T. A. S. Foundation, "Hadoop archives," 2008.
[Online]. Available:
https://hadoop.apache.org/docs/r1.2.1/hadoop_a rchives.html. Accessed: Nov. 28, 2016.
[19] T. A. S. Foundation, "Apache HBase – Hadoop Cluster," 2007. [Online]. Available: https://hbase.apache.org/. Accessed: Nov. 28, 2016.
[20] M. Zubair, F. Wahab, I. Hussain, and J. Zaffar, "Improved text scanning approach for exact string matching," Proceedings of International Conference on Information and Emerging Technologies, Jun. 2010.
[21] A. S. Foundation, "Text output format API,"
2016. [Online]. Available:
https://hadoop.apache.org/docs/r2.7.2/api/org/ap ache/hadoop/mapreduce/lib/output/TextOutputF ormat.html. Accessed: Nov. 28, 2016.
[22] "Welcome to Apache™ Hadoop®," 2014. [Online]. Available: http://hadoop.apache.org/. Accessed: Nov. 28, 2016.
[23] R. J. McEliece, D. J. C. MacKay, and J.-F. Cheng, "Turbo decoding as an instance of pearl’s ‘belief propagation’ algorithm," IEEE Journal on Selected Areas in Communications, vol. 16, no. 2, pp. 140–152, 1998.
[24] J. S. Yedidia, “Message-passing algorithms for inference and optimization,” Journal of Statistical Physics, vol. 145, no. 4, pp. 860-890, 2011.
[25] N.M.F. Qureshi, and D.R. Shin, "RDP: A storage-tier-aware Robust Data Placement strategy for Hadoop in a Cloud-based Heterogeneous Environment," KSII Transactions on Internet and Information Systems, vol. 10, no. 9, pp. 4063-4086, 2016. [26] Z. Ghahramani, “An introduction to hidden
Markov models and Bayesian networks,”
International Journal of Pattern Recognition and Artificial Intelligence, vol. 15, no. 1, pp. 9-42, 2001.
[27] Ajit Singh, “EM Algorithm”, 2005.
[28] G. D. Forney, “The viterbi algorithm,” in Proceedings of the IEEE, vol. 61, no. 3, pp. 268-278, 1973.
[29] C.-L. N. Revolution, "Smart Meter Dataset," Customer-Led Network Revolution, 2016.
[Online]. Available: