BIROn - Birkbeck Institutional Research Online
Crawford, Ian and Craig, N. and Welsh, B.Y. (1997) The velocity structure
of the local interstellar medium probed by ultra-high-resolution spectroscopy.
Astronomy & Astrophysics 317 (3), pp. 889-897. ISSN 0004-6361.
Downloaded from:
Usage Guidelines:
Please refer to usage guidelines at
or alternatively
AND
ASTROPHYSICS
The velocity structure of the local interstellar medium probed
by ultra-high-resolution spectroscopy
I.A. Crawford1, N. Craig2, and B.Y. Welsh2 1
Department of Physics and Astronomy, University College London, Gower Street, London, WC1E 6BT, UK
2 Space Sciences Laboratory, University of California, Berkeley, CA 94720, USA
Received 25 March 1996 / Accepted 2 May 1996
Abstract. We present ultra-high-resolution (0.35 km s−1 FWHM) observations of the interstellar Ca K line towards eight nearby stars (six of which are closer than 30 pc). The spectral resolution is sufficient to resolve the line profiles fully, thereby enabling us to detect hitherto unresolved velocity components, and to obtain accurate measurements of the velocity dispersions
(b-values). Absorption components due to the Local
Interstel-lar Cloud (LIC) and/or the closely associated ‘G Cloud’ are identified towards all but one star (γOph), but only in one case
(51 Oph) arebothclouds reliably detected towards the same star.
Most of these nearby clouds have velocity dispersions (b ≈2
km s−1) which suggest physical conditions similar to those
in-ferred for the LIC (Tk ≈ 7000 K,vt ≈ 1 km s−1), although
at least three lines of sight (towardsγAqr,βCen andρCen)
also sample cooler and/or less turbulent material. The spectrum of the nearby Vega-excess star 51 Oph is of particular interest, owing to evidence that several of the absorption components arise in the circumstellar environment.
Key words: ISM: clouds – ISM: kinematics and dynamics – ISM: structure – ISM: atoms
1. Introduction
There is now considerable evidence that the Sun lies within a
warm (T ∼7000 K) low-density (nH ∼0.1 cm−3)
interstel-lar cloud, and that this Local Interstelinterstel-lar Cloud (LIC) is itself
located within the hot (T ∼ 106 K) and empty (
nH ∼0.005
cm−3) Local Bubble in the interstellar medium (see Cox &
Reynolds 1987 and Frisch 1995 for reviews). Our knowledge of the Local Bubble has improved greatly in recent years, as a result of observations performed at optical, ultraviolet and X-ray wavelengths. Recent results from the ROSAT wide-field camera (Diamond et al. 1995), EUVE (Vennes et al. 1994), and
Send offprint requests to: I.A. Crawford
ground-based optical spectroscopy (Welsh et al. 1994) all
con-firm the distinct lack of neutral gas within∼50 pc of the Sun.
The evidence that this volume is filled with a high-temperature plasma comes primarily from observations of the soft X-ray background (McCammon et al. 1983, McCammon & Sanders 1990), although it has been pointed out by Breitschwerdt & Schmutzler (1994) and Jelinsky, Vallerga & Edelstein (1995) that if the gas is out of ionisation equilibrium the temperature might be considerably lower than generally assumed.
Our knowledge of the low-density clouds within the Local Bubble has also improved, largely owing to the ability of mod-ern high-resolution spectrographs to detect the weak absorption
lines (equivalent widths of a few m ˚A) which these clouds
pro-duce in the spectra of nearby stars. This work has revealed that, within a few tens of parsecs of the Sun, the Local Bubble con-tains several small clouds with characteristics apparently sim-ilar to those of the LIC (Lallement et al. 1986, 1994; Bertin et al. 1993). Using ground-based and HST-GHRS observations, Lallement et al. (1995) have deduced that the LIC is moving past
the Solar System with a heliocentric velocity of 26±1 km s−1
towardsl= (186±3)◦,b= (−16±3)◦. In addition, they (see also Lallement & Bertin 1992) have drawn attention to another nearby cloud, characterised by a slightly different velocity vec-tor (29 km s−1 towardsl = 184.5◦,b = −20.5◦), which they designate as the ‘G Cloud.’ However, it is still unclear whether the G cloud is separate from the LIC, or is contiguous with it. As reviewed by Frisch (1995), these velocity vectors are consistent with a general outflow from the Scorpio-Centaurus OB
Asso-ciation (l ≈320◦,b ≈+10◦) which appears to dominate the
large scale kinematics of the local interstellar medium (LISM). The temperature of the LIC in the immediate vicinity of the Solar System has been determined from observations of
back-scattered solar Ly-α(8000±1000 K; Bertaux et al. 1985) and
He Iλ584 (7000±2000 K; Chassefiere, Dalaudier & Bertaux
1988). An essentially identical temperature (6700±1500 K)
has been measured directly for interstellar He atoms in the outer
Solar System from the Ulyssesspacecraft (Witte et al. 1993).
890 I.A. Crawford et al.: The velocity structure of the local interstellar medium
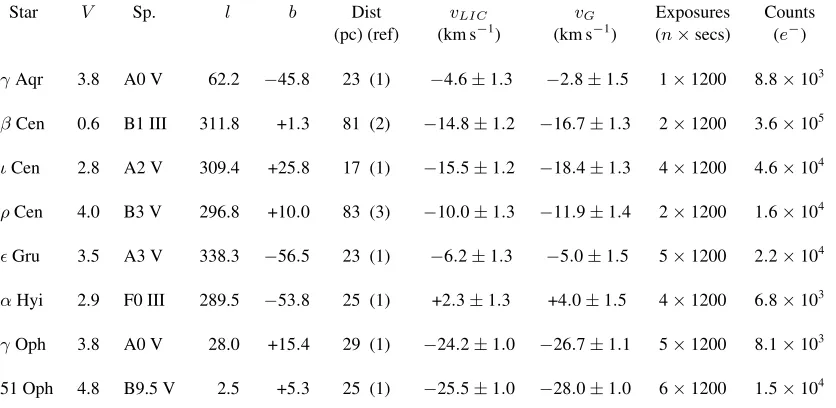
Table 1.List of the nearby stars observed for the interstellar Ca K line using the UHRF.vLICandvGare the projected heliocentric velocities of the Local Interstellar and G clouds towards each of these stars (Lallement et al. 1995). The last column gives the total number of counts (electrons) obtained in the local continuum for each 24-µm spectral element adjacent to the interstellar lines (generally this is formed by the core of the stellar photospheric Ca K line.)
Star V Sp. l b Dist vLIC vG Exposures Counts (pc) (ref) (km s−1) (km s−1) (n×secs) (e−)
γAqr 3.8 A0 V 62.2 −45.8 23 (1) −4.6±1.3 −2.8±1.5 1×1200 8.8×10³
βCen 0.6 B1 III 311.8 +1.3 81 (2) −14.8±1.2 −16.7±1.3 2×1200 3.6×10⁵
ιCen 2.8 A2 V 309.4 +25.8 17 (1) −15.5±1.2 −18.4±1.3 4×1200 4.6×10⁴
ρCen 4.0 B3 V 296.8 +10.0 83 (3) −10.0±1.3 −11.9±1.4 2×1200 1.6×10⁴
Gru 3.5 A3 V 338.3 −56.5 23 (1) −6.2±1.3 −5.0±1.5 5×1200 2.2×10⁴
αHyi 2.9 F0 III 289.5 −53.8 25 (1) +2.3±1.3 +4.0±1.5 4×1200 6.8×10³
γOph 3.8 A0 V 28.0 +15.4 29 (1) −24.2±1.0 −26.7±1.1 5×1200 8.1×10³
51 Oph 4.8 B9.5 V 2.5 +5.3 25 (1) −25.5±1.0 −28.0±1.0 6×1200 1.5×10⁴ References: (1) van Altena et al. (1991); (2) Lesh (1972); (3) de Geus et al. (1989).
Linsky et al. (1993, 1995), who obtained a value of 7000±500
K from HST observations of interstellar D I, Fe II and Mg II
towards Procyon (αCMi;D= 3.5 pc) and Capella (αAur;D=
12.5 pc). More recently, Linsky & Wood (1995) have obtained
a similar, although somewhat lower, temperature of 5400±500
K from interstellar lines towardsαCen A (D=1.3 pc). These
authors have also measured the rms turbulent velocities,vt, for the LIC towards these stars, and found it to be of the order of 1 km s−1(specifically, 1
.13±0.28 km s−1 for Capella and Procyon, and 0.85±0.18 km s−1for
αCen; Linsky et al. 1995,
Linsky & Wood 1995). [Note that in their papers, Linsky et
al. characterise the turbulence by the parameterξ, whereξ =
√
2×vtas used here; cf. Equation 1 below.]
Here we report observations of the interstellar Ca K line towards eight nearby stars obtained with the Ultra-High-Resolution Facility (UHRF) at the Anglo-Australian Telescope. The UHRF is currently the world’s highest resolution astronom-ical spectrograph, and has been described in detail by Diego et
al. (1995). The maximum resolving power isR≡λ/∆λ≈106
(0.3 km s−1FWHM), which is more than an order of magnitude
higher than most other instruments. As discussed by Crawford & Dunkin (1995), use of this very high resolving power has two main advantages for the study of the LISM: (1) it makes possible the resolution of closely-spaced velocity components, and therefore separation of the LIC from other nearby clouds; and (2) it enables us to measure reliable intrinsic line widths (b -values), thereby providing information on the temperature and turbulence within the clouds.
2. Observations
The observations were obtained in July 1995, and details of in-dividual exposures are given in Table 1. The detector was a
Tek-tronix CCD (1024×1024 24-µm pixels). The spectrograph was
used in conjunction with an image-slicer (Diego 1993), and the output was binned by a factor of eight perpendicular to the dis-persion direction in order to reduce the readout noise associated with the broad spectrum which results. At the wavelength of the Ca K line (3933.663 ˚A) the dispersion was 0.086 ˚A mm−1,
giv-ing a spectral coverage of 2.1 ˚A. The resolution, measured with
the aid of a stabilized He-Ne laser, was 0.350±0.004 km s−1
(FWHM), corresponding to a resolving power ofR= 860,000.
The CCD images were divided by a flatfield, and the spec-tra exspec-tracted using the FIGARO data-reduction package (Short-ridge 1988). Background light was measured from the inter-order region and subtracted. Wavelength calibration was per-formed using a Th-Ar comparison lamp. Second-order polyno-mial fits to between 5 and 7 comparison lines yielded typical
rms residuals of 5×10⁻⁴ A (0.04 km s˚ −1); in no case were
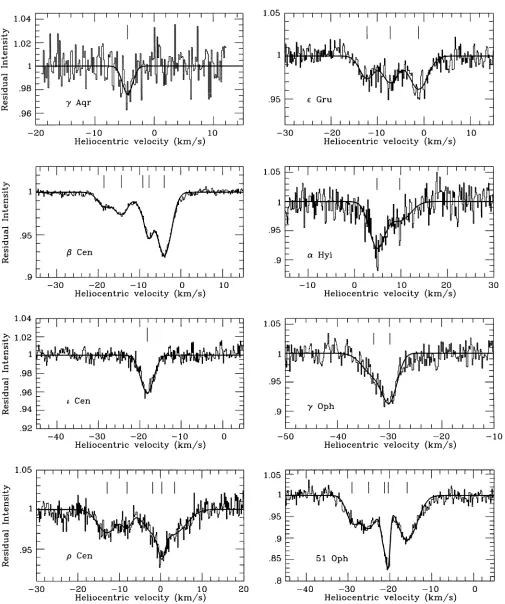
the rms residual s greater than 8×10⁻⁴A (0.06 km s˚ −1). Once wavelength calibrated the spectra were converted to the helio-centric velocity frame, and multiple exposures (Table 1) were co-added. Most of these stars exhibit strong photospheric Ca K lines, the cores of which act as the local continua for the inter-stellar lines. These were fitted by low-order polynomials and divided out, to give the normalised spectra shown in Fig. 1.
3. Results
892 I.A. Crawford et al.: The velocity structure of the local interstellar medium
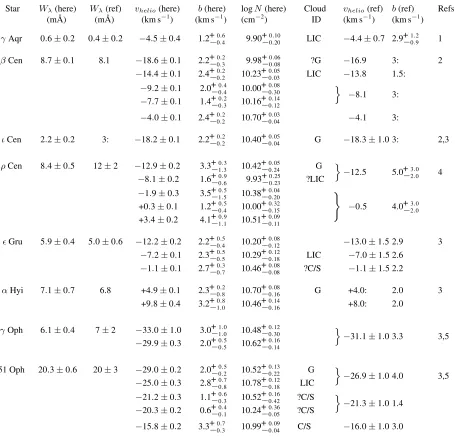
Table 2.Line profile parameters for the interstellar Ca K lines shown in Fig. 1, compared with other published values; a colon indicates that a previously published value is uncertain.Wλis the total equivalent width (i.e. summed over all velocity components; 2σerrors). Column 7 indicates whether a component falls within the velocity range occupied by the LIC or G clouds (Table 1; a question mark indicates that the component falls just outside the errors quoted on the cloud velocities), and also identifies possible circumstellar components (see text).
Star Wλ(here) Wλ(ref) vhelio(here) b(here) logN(here) Cloud vhelio(ref) b(ref) Refs (m ˚A) (m ˚A) (km s−1) (km s−1) (cm−2) ID (km s−1) (km s−1)
γAqr 0.6±0.2 0.4±0.2 −4.5±0.4 1.2+0.6
−0.4 9.90+ 0.10
−0.20 LIC −4.4±0.7 2.9+ 1.2 −0.9 1
βCen 8.7±0.1 8.1 −18.6±0.1 2.2+−00..23 9.98+−00..0806 ?G −16.9 3: 2
−14.4±0.1 2.4+0.2
−0.2 10.23+ 0.05
−0.03 LIC −13.8 1.5: −9.2±0.1 2.0+−00..44 10.00+−00..0830
−7.7±0.1 1.4+−00..32 10.16+−00..1412
o
−8.1 3:
−4.0±0.1 2.4+−00..22 10.70+−00..0304 −4.1 3:
ιCen 2.2±0.2 3: −18.2±0.1 2.2+−00..22 10.40+−00..0504 G −18.3±1.0 3: 2,3
ρCen 8.4±0.5 12±2 −12.9±0.2 3.3+0.3
−1.3 10.42+ 0.05
−0.24 G −8.1±0.2 1.6+−00..69 9.93+−00..2325 ?LIC
o
−12.5 5.0+−32..00 4
−1.9±0.3 3.5+0.5
−1.5 10.38+ 0.04 −0.20
+0.3±0.1 1.2+0.5
−0.4 10.00+ 0.32 −0.15
)
−0.5 4.0+3.0 −2.0
+3.4±0.2 4.1+−01..19 10.51+−00..0911
Gru 5.9±0.4 5.0±0.6 −12.2±0.2 2.2+−00..54 10.20+−00..0812 −13.0±1.5 2.9 3
−7.2±0.1 2.3+−00..55 10.29+−00..1218 LIC −7.0±1.5 2.6
−1.1±0.1 2.7+−00..37 10.46+−00..0808 ?C/S −1.1±1.5 2.2
αHyi 7.1±0.7 6.8 +4.9±0.1 2.3+−00..28 10.70+−00..0816 G +4.0: 2.0 3 +9.8±0.4 3.2+−10..80 10.46+−00..1416 +8.0: 2.0
γOph 6.1±0.4 7±2 −33.0±1.0 3.0+−11..00 10.48+−00..1230
−29.9±0.3 2.0+0.5
−0.5 10.62+ 0.16 −0.14
o
−31.1±1.0 3.3 3,5
51 Oph 20.3±0.6 20±3 −29.0±0.2 2.0+−00..25 10.52+−00..1322 G
−25.0±0.3 2.8+−00..87 10.78+−00..1218 LIC o
−26.9±1.0 4.0 3,5
−21.2±0.3 1.1+−00..36 10.52+−00..1642 ?C/S
−20.3±0.2 0.6+−00..14 10.24+−00..3605 ?C/S o
−21.3±1.0 1.4
−15.8±0.2 3.3+−00..73 10.99+−00..0904 C/S −16.0±1.0 3.0
References: (1) Vallerga et al. (1993); (2) Lallement et al. (1986); (3) Bertin et al. (1993); (4) Crawford (1991); (5) Lagrange-Henri et al. (1990)
ponent by means of a Marquardt least-squares fitting program (described in more detail by Vallerga et al. 1993), and these are given in Table 2. The errors quoted on these values were obtained by an interactive estimation of the range of each pa-rameter about the least-square value which is consistent with an acceptable overall fit. Although somewhat subjective, these er-ror estimates are at least conservative (in most cases they are two
to three times the formal 1σerrors obtained by the least-square
fitting program which, in order to reduce the computation time
to a manageable level, made the simplifying assumption that the errors on each component can be treated independently).
3.1. Equivalent widths
The equivalent widths were measured using the DIPSO spectral analysis program (Howarth, Murray & Mills 1993), and gener-ally agree well with previously published values. This is reas-suring because it indicates that the present observations have not been significantly affected by uncorrected scattered light, which would have caused our measurements to underestimate the actual values. This problem was noted in the earliest obser-vations obtained with the UHRF, but it appears that the steps taken to correct it (discussed in Sect. 7.3 of Diego et al. 1995) have been successful.
3.2. Velocity structure
In Table 2 we use curly brackets to group together velocity com-ponents which we have resolved, but which lie within what appeared to be single components when observed at lower reso-lution. Six such cases were identified, towards four of the eight stars:
(i)βCen.
The −8.1 km s−1 component observed by Lallement et al.
(1986) with a resolution of 3 km s−1 is here resolved into two
components, at−9.2 and−7.7 km s−1. (ii)ρCen.
Earlier observations, obtained with a resolution of 3.6 km s−1
(Crawford 1991), identified two velocity components towards this star, whereas the present observations reveal five. The com-ponent previously identified at−12.5 km s−1is here split into two (−12.9 and−8.1 km s−1), which may plausibly be iden-tified with the G and LIC clouds (see Sect. 4.1). In addition, the earlier−0.5 km s−1component is here resolved into three
discrete components (at−1.9, +0.3, and +3.4 km s−1). Also,
the unusually largeb-value obtained for the +3.4 km s−1
com-ponent (4.1+0.9
−1.1km s−
1; Table 2) may indicate the presence of
additional unresolved velocity structure.
(iii)γOph.
The single component observed at−31.1 km s−1by
Lagrange-Henri et al. (1990) is here resolved into components at−33.0
and−29.9 km s−1. This structure will be discussed more fully in Sect. 4.2.
(iv) 51 Oph.
The Ca K line towards 51 Oph was observed at 3 km s−1
reso-lution by Lagrange-Henri et al. (1990), who identified three dis-crete velocity components (cf. their fig. 5). However, the higher-resolution observations presented here show that at least two of these are actually double, making a minimum of five
compo-nents in all (Table 2). Lagrange-Henri et al.’s −26.9 km s−1
component is resolved into two (at−29.0 and−25.2 km s−1), which correspond to the velocities expected for the G and LIC clouds (see Sect. 4.1). In addition, the narrow central compo-nent (at−21.3 km s−1) is found to be double, and this will be discussed in Sect. 4.2.
3.3. Velocity dispersions
The velocity dispersions (b-values) found here are generally
consistent with other published values (Table 2), when al-lowance is made for the lower resolution of earlier work and the previously unresolved blends discussed above. However, it is important to stress that the values measured here are much more accurately determined, owing to the order-of-magnitude higher resolution employed. As the observed line profiles are given by a convolution of the intrinsic profiles with the instru-mental resolution, line profile modelling is insensitive to in-trinsic velocity dispersions much smaller than the instrumental
b–value (binst). The previously published measurements
ref-erenced in Table 2 were all performed withbinst >∼1.8 km s−1 (R∼<105). This is comparable to the intrinsic widths of the lines being studied, and renders the resulting measurements some-what uncertain. In contrast, the observations presented here were obtained withbinst= 0.21 km s−1, with the result that all the ve-locity components have been fully resolved and therefore have well-determined velocity dispersions.
4. Discussion
In this section we elaborate on three specific aspects of these results: the nature of the LIC and G clouds; the nature and distri-bution of other nearby clouds; and the complicated interstellar and circumstellar spectrum of 51 Oph.
4.1. The LIC and G clouds
As discussed in Sect. 1, one of the unsolved questions concern-ing the structure of the local interstellar medium is the rela-tionship between the Local Interstellar Cloud itself, and the G cloud identified by Lallement & Bertin (1992). As discussed by Lallement et al. (1995; their Sect. 1.3), the main difficulty is the small projected velocity difference between the LIC and
G cloud velocity vectors. As this is always less than 3 km s−1
(Sect. 1), lower-resolution studies have found it difficult to to
determine whetherbothclouds are present towards any given
star. Detection of both components would argue strongly for the LIC and G clouds being separate entities, while detection of only one or the other would argue for a velocity gradient within a single cloud.
With this in mind, Table 1 lists the velocities of the LIC and G clouds, projected towards the stars observed here, and Table 2 identifies those components which fall within the uncertainties on the projected cloud velocities. It will be seen that compo-nents at the LIC and/or G cloud velocities are detected towards
seven of the eight stars (the exception beingγ Oph, which is
discussed further in Sect. 4.2), but only in one case (51 Oph) are absorption components found which lie within the
veloc-ity ranges expected forbothclouds. Since a single exception
894 I.A. Crawford et al.: The velocity structure of the local interstellar medium
predicted range by∼<0.5 km s−1(these components are identi-fied by question marks in Table 2); and (2) Crawford & Dunkin (1995) plausibly identified both components in the line of sight toαOph (l= 35.9◦,b= +22.6◦,D= 15 pc).
In spite of these uncertainties, some trends are suggested by the present data. In particular, there is a tendency for the LIC to be observed either on its own or not at all at high negative latitudes (−60◦∼<b∼ −< 40◦: i.e. towardsγAqr,Gru,αGru; cf. Crawford & Dunkin 1995 for the latter star), whereas the stars which may plausibly be interpreted as exhibiting
compo-nents due to both clouds (β Cen,ρCen, 51 Oph,αOph) lie at
low positive latitudes 0◦∼<b∼< + 25◦). However, the fact that a component at the G cloud velocity is detected without the LIC towards stars as well-separated in latitude asιCen (b= +25.8)
andαHyi (b = −53.8), and that neither cloud was detected
towardsγOph orαEri (Crawford & Dunkin 1995), means that
a simple picture in which lines of sight towards stars at low positive latitudes pass through both the LIC and the G clouds is probably untenable (unless both clouds are very inhomoge-neous). Only by obtaining many more observations of nearby stars, performed with sufficient spectral resolution to discrimi-nate between the LIC and G cloud velocities, will it be possible to shed further light on the spatial extent of these two clouds, and we hope to obtain such observations in the near future.
Regardless of the spatial distribution of the LIC and G Cloud velocity components, the present observations are able to provide new information on the physical conditions prevail-ing within this material. For Ca ions, the velocity dispersion is related to the kinetic temperature,Tk, and the line-of-sight rms turbulent velocity,vt, by
b=
r
0.413
T
k
1000K
+ 2v2
t kms−1. (1)
The five components identified with the LIC in Table 2 have well-definedb-values in the range 1.2 to 2.4 km s−1. Allowing for the errors, all but one of these values is consistent with other indications of the physical conditions prevailing in the LIC (cf. Sect. 1). Specifically, Equation 1 givesb= 2.2 km s−1
for Tk = 7000 K andvt = 1.0 km s−1, and this falls within
the errors on the observedb-values for every LIC component
except that towardsγAqr. We may also note that these values
of temperature and turbulence are consistent with theb-values
obtained for velocity components identified with the G cloud, underscoring the fact that, if the two cloudsarephysically sepa-rate, they nevertheless have similar internal physical conditions.
The single absorption component observed towardsγAqr
is exceptional because, while the velocity is essentially identi-cal to that expected for the LIC, itsb-value (1.2+0.6
−0.4 km s− 1)
implies an upper limit to the temperature (3500+4400
−1900K) which
is lower than that obtained for other LIC sightlines. It is true that temperatures at the upper end of this range are consistent with the canonical LIC value of 7000 K, but Equation 1 shows that such a temperature is only possible ifvt <∼0.4 km s−1. Thus it
seems that the region of the LIC present towardsγAqr is cooler
and/or less turbulent than elsewhere. Observations of additional
stars, close toγAqr on the sky, will be required to determine
the physical extent of this cooler/less turbulent region.
4.2. Other nearby clouds
The present observations reveal the presence of 14 velocity com-ponents (towards six of the eight stars) in addition to the ten al-ready tentatively identified with the LIC and G clouds (Table 2). Excluding the three towards 51 Oph, which are probably cir-cumstellar in origin (and which are discussed in Sect. 4.3), and
one possibly circumstellar component towardsGru (Bertin et
al. 1993), this leaves ten components which arise in additional low density clouds within the Local Bubble. As discussed in Sect. 3.2, many of these components have here been resolved for the first time, and, as might be expected, the two most distant
stars (βCen andρCen, both at about 80 pc) exhibit the largest
number of components (cf. Table 2).
Most of these components have velocity dispersions which suggest physical conditions similar to those deduced for the LIC
and G clouds. Specifically, all but three haveb-values that are
consistent withTk ∼7000 K andvt≈1 km s−1(i.e.
b ≈2.2
km s−1, allowing for the errors). The +3.4 km s−1 component
towardsρCen (b = 4.1+0.9
−1.1 km s−
1) is broader than might be
expected, but, as noted in Sect. 3.2, this probably results from the presence of an additional unresolved velocity component.
Of greater interest are the two components (i.e. those at−7.7
km s−1towards
βCen, and +0.3 km s−1towards
ρCen) which
haveb-values (1.4+−00..23and 1.2+−00..54km s−1, respectively) which are lower than expected, and similar to that of the anomalously
narrow LIC component identified towardsγAqr. Indeed, these
two clouds must be rather cooler and/or less turbulent than that
towardsγAqr as theb-value upper limits are lower – implying
rigorous temperature upper limits ofTk 6200 K forβCen, and
Tk 7000 K forρCen. Conversely, by assuming Tk = 0, we
obtain rigorous upper limits to vt of 1.1 and 1.2 km s−1 for
these components. Since, in reality, there will be some trade-off
betweenTk andvt, the actual values of both must lie below
these limits.
The line of sight towardsγOph deserves special comment,
because of what it tells us about the complicated state of the
LISM in the direction of Ophiuchus. As noted in Sect. 4.1,γ
Oph is the only star in the present sample which does not exhibit
clear evidence for an absorption component ateitherof the LIC
or G cloud velocities. This is all the more remarkable when one
considers thatγOph is bracketed on the sky byαOph and 51
Oph (with angular separations of 10.4◦and 27.0◦, respectively),
and that both of these neighbouring starsdohave components
at the G and LIC velocities (forαOph, see Crawford & Dunkin
1995). It is true that the spectrum ofγOph shown in Fig. 1 does
comparable to the LIC column density deduced forγAqr, but is approximately an order of magnitude lower than those found for
αOph and 51 Oph. Thus, while the present non-detection is still
consistent with the LIC being present towardsγOph (as it would
have to be if it truly surrounds the Sun), the upper limit implies order-of-magnitude spatial and/or density inhomogeneities on a scale of∼<0.2 pc (based on the angular separation ofγOph and
αOph, and an assumed LIC extent of∼<1 pc in this direction; cf. Lallement et al. 1994).
The two stronger, more blue-shifted, components whichare
observed towardsγOph must be due to other, probably more
dis-tant, clouds. Indeed, components with similar velocities (−32.0 and−28.4 km s−1), and similar column densities and
b-values,
were observed towardsαOph by Crawford & Dunkin (1995),
so it appears likely that the same two clouds have also been sampled by this line of sight. At the distance of the nearer of the
two stars (αOph,D= 15 pc) the lines of sight are separated by
2.7 pc, which is consistent with other estimates of the sizes of clouds within the local bubble. However, we note that Barlow et al. (1995) detected a weak (logN = 10.20 cm−2) Ca II com-ponent at−31.8 km s−1towardsζOph (l = 6.3◦,b= +23.6◦,
D = 230 pc), which may imply that this line of sight has also
passed through the material responsible for the most negative
velocity component present towardsγOph. As the separation
of these two lines of sight at the distance ofαOph is 6 pc, and
as this is rather larger than previous estimates for the sizes of the local clouds, this cloud may actually be quite a lot closer
thanαOph.
The strongest absorption component towardsα Oph (i.e.
that at−26.2 km s−1) is not observed towards
γOph, and this
is consistent with the view of Frisch, York & Fowler (1987) that
αOph lies behind a ‘wisp’ of H I emission which they
iden-tified in the 21-cm maps of Colomb, P¨oppel & Heiles (1980). However, it will be necessary to observe the interstellar spectra of many more nearby stars in Ophiuchus, and these at a range of distances, before we can be certain that the 21-cm structures observed in this direction by Colomb et al. are really as close (i.e. within 15 pc of the Sun) as this argument would imply.
4.3. The spectrum of 51 Oph
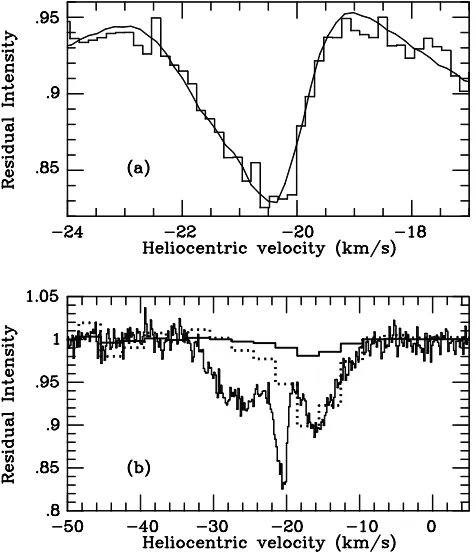
The spectrum of 51 Oph is interesting for a variety of reasons. In addition to the two components tentatively identified with the LIC and G clouds (Sect. 4.1), three other absorption compo-nents are present towards this star. Perhaps of greatest interest is the fact that the narrow central (−21.3 km s−1) component identified by Lagrange-Henri et al. (1990) is asymmetric, which implies the presence of additional velocity structure. Fig. 2a shows this component plotted on an expanded scale, which emphasises the asymmetry of the profile, and also shows our two-component fit (Table 2). Both of these components are ex-tremely narrow, and the velocity dispersion of the−20.3 km s−1 component (b= 0.6+0.4
−0.1km s−
1) implies an upper limit to the
ki-netic temperature (obtained by assumingvt= 0 in Equation 1)
of 870+−2701550 K, which is much lower than that expected for
[image:8.612.306.544.45.321.2]clouds within the Local Bubble (Sect. 1). It is true that several
Fig. 2. a An expanded view of the central narrow (−21.3 km s−1)
component towards 51 Oph, showing the asymmetry of the line pro-file. The theoretical two-component model profile (Table 2) is also shown.bComparison of the UHRF Ca K spectrum of 51 Oph with a lower resolution observation of the line due to excited Fe II (Dunkin et al. 1996). The solid line shows the normalised Fe II spectrum, while the dotted line shows the same line scaled to the depth of the−15.8 km s−1
Ca II component. Clearly the Fe II is mostly associated with this particular Ca II component; see text for discussion.
comparably narrow Ca II components were detected in UHRF
observations ofζOph by Barlow et al. (1995), but these were
found to be associated with the complex of components
cen-tered at about−14 km s−1, and which are known to be
associ-ated with more distant cold molecular clouds. Thus, either the line-of-sight to 51 Oph has passed through an unusually cool cloud within 25pc of the Sun (which is not observed towards other nearby stars in Ophiuchus), or these narrow components arise in the circumstellar environment.
As 51 Oph is a well known Vega-excess star (i.e. a main-sequence star exhibiting an infrared excess due to circumstellar dust; Cot´e & Waters 1987, Waters, Cot´e & Geballe 1988), it is quite likely that some of the absorption components have a circumstellar origin (Lagrange-Henri et al. 1990). Indeed, quite convincing evidence that at least the−15.8 km s−1 com-ponent, and possibly the narrow central components also, are
circumstellar comes from the detection of the 4583.837 ˚A line
896 I.A. Crawford et al.: The velocity structure of the local interstellar medium
suggests excitation in the circumstellar environment, a point al-ready made by Grady & Silvis (1993) in connection with their detection of UV lines from excited levels of Fe II towards this
star. Fig. 2b shows the Fe II line observed atR= 44000 (S.K.
Dunkin, personal communication) superimposed on the UHRF spectrum of the Ca K line. Even allowing for the lower resolu-tion of the Fe II spectrum, it is clear that this line is centered
at the velocity of the −15.8 km s−1 Ca II component (this is
especially obvious if the Fe II line is scaled to the same depth as the Ca II component; dotted line in Fig. 2b). Inspection of Fig. 2b also shows that the Fe II line is asymmetric, indicative of additional Fe II absorption blueward of−15.8 km s−1. This is the velocity range occupied by the narrow central components, and may suggest that these are also circumstellar. Only UHRF observations of the Fe II line itself will be able to determine unambiguously whether or not this is the case.
Given these arguments for a circumstellar origin, it is of particular interest to determine whether or not these lines ex-hibit line-profile variations similar to those found for the
well-studiedβ Pictoris system (e.g. Ferlet, Hobbs & Vidal-Madjar
1987, Lagrange-Henri et al. 1992, Crawford et al. 1994). This is especially important as Grady & Silvis (1993) have found clear
evidence for in-falling gas (with velocities up to 100 km s−1)
from time-variable, redshifted UV absorption lines in 51 Oph which are very similar to those found forβPic. In order to check for such variations in the Ca K line, we degraded our UHRF
spectrum to an effective resolution ofR= 105, and compared it
with that obtained by Lagrange-Henri et al. (1990). This com-parison revealed no evidence for spectral changes, either in the velocities or in the relative intensities of the absorption compo-nents. Thus, while further ultra-high-resolution monitoring of the line profile will be needed before a definite conclusion can
be reached, the present observations show no evidence forβ
Pic-type variability in the circumstellar Ca II line of 51 Oph. As a final point, we note that the constancy in velocity of the (presumed) circumstellar line profiles (Table 2) is doubly surprising given that Buscombe (1963) found 51 Oph to have a variable velocity. If this star really is a spectroscopic binary,
and if, as seems almost certain, the−15.8 km s−1 component
arises in the circumstellar environment, it would appear that the circumstellar material must surround both stars. On the other hand, it may be that the assignation of a variable stellar velocity is spurious. Clearly it would be desirable to obtain more accurate measurements of the stellar radial velocity in order to settle this question.
5. Conclusions
We have used the Ultra-High-Resolution Facility (UHRF) at the Anglo-Australian Telescope to study interstellar Ca K lines to-wards eight nearby stars. The spectral resolution (0.35 km s−1, FWHM) was sufficient for us to fully resolve the intrinsic line profiles. This has enabled us to detect hitherto unresolved veloc-ity structure in the LISM, and to obtain accurate measurements
of the velocity dispersions (b-values) of the local clouds. Our
principal conclusions are as follows:
(1) Absorption components at the velocities expected for the LIC and/or the G cloud (Lallement et al. 1995) have been
de-tected towards all but one star (γ Oph). The column density
upper limits deduced forγOph (logN(Ca II)∼<9.90 cm−2) are consistent with the LIC and/or G cloud being present towards this star, but only by assuming order-of-magnitude spatial and/or density inhomogeneities on sub-parsec scales. Only in the case
of one star (51 Oph) is there a fairly secure detection ofboth
the LIC and G clouds.
(2) The velocity dispersions deduced for the LIC/G cloud com-ponents are generally consistent with other determinations of
the physical conditions prevailing in the LIC (Tk ≈ 7000 K,
vt ≈ 1 km s−1). However, the weak LIC component towards
γAqr is narrower than expected (b= 1.2+−00..46), suggesting that the LIC in this direction is cooler and/or less turbulent than
elsewhere. Observations of other nearby stars, close toγAqr on
the sky, are needed to determine the extent of this apparently anomalous region.
(3) The velocity dispersions of the other (i.e. non-LIC/G cloud) velocity components suggest temperature/turbulence regimes similar to that of the LIC. However, the two most distant stars
in the present sample (β Cen andρCen) also exhibit narrower
components which must arise in a somewhat cooler and/or less turbulent environment.
(4) Five absorption components were identified towards the nearby Vega-excess star 51 Oph. Two were identified with the LIC and G clouds (Table 2). Of the others, that at−15.8 km s−1 is almost certainly circumstellar, owing to its association with an excited metastable state of Fe II (Fig. 2b; Dunkin et al. 1996).
The two remaining components (at−21.2 and−20.3 km s−1,
which are here resolved for the first time; cf. Fig. 2a) are very narrow by LISM standards, and may also arise in the circum-stellar environment (Sect. 4.3). However, allowing for the dif-ferences in spectral resolution, we found no evidence for any change in the Ca K line profile between the observations re-ported here and those obtained by Lagrange-Henri et al. (1990).
Acknowledgements. We are thank S.K. Dunkin for providing the Fe II spectrum of 51 Oph, and PATT for the award of telescope time. IAC is grateful to PPARC for the award of a post-doctoral research fellowship and to M.J. Barlow for support and encouragement.
References
Barlow, M.J., Crawford, I.A., Diego, F., Dryburgh, M., Fish, A.C., Howarth, I.D., Spyromilio, J., Walker, D.D., 1995, MNRAS, 272, 333
Bertaux, J.L., Lallement, R., Kurt, V.G., Mironova, E.N., 1985, A&A, 150, 1
Bertin, P., Lallement, R., Ferlet, R., Vidal-Madjar, A., 1993, A&A, 278, 549
Breitschwerdt, D., Schmutzler, T., 1994, Nature, 371, 774 Buscombe, W., 1963, MNRAS, 126, 29
Cox, D.P., Reynolds, R.J., 1987, ARA&A, 25, 303 Crawford, I.A., 1991, A&A, 247, 183
Crawford. I.A., Dunkin, S.K., 1995, MNRAS, 273, 219
Crawford, I.A., Spyromilio, J., Barlow, M.J., Diego, F., Lagrange, A.M., 1994, MNRAS, 266, L65
de Geus, E.J., de Zeeuw, P.T., Lub, J., 1989, A&A, 216, 44 Diamond, C.J., Jewell, S.J., Ponman, T.J., MNRAS, 274, 589, 1995 Diego, F., 1993, Appl. Opt., 32, 6284
Diego, F., et al., 1995, MNRAS, 272, 323
Dunkin, S.K., Barlow, M.J., Ryan, S.G., MNRAS, in preparation Ferlet, R., Hobbs, L.M., Vidal-Madjar, A., 1987, A&A, 185, 267 Frisch, P.C., 1995, Space Sci. Rev., 72, 499
Frisch, P.C., York, D.G., Fowler, J.R., 1987, ApJ, 320, 842 Grady, C.A., Silvis, J.M.S., 1993, ApJ, 402, L61
Howarth, I.D., Murray, J., Mills, D., 1993, Starlink User Note, No. 50 Jelinsky, P., Vallerga, J.V., Edelstein, J., 1995, ApJ, 442, 653 Lagrange-Henri, A.M., Ferlet, R., Vidal-Madjar, A., Beust, H., Gry,
C., Lallement, R., 1990, A&AS, 85, 1089
Lagrange-Henri, A.M., Gosset, E., Beust, H., Ferlet, R., Vidal-Madjar, A., 1992, A&A, 264, 637
Lallement, R., Bertin, P., 1992, A&A, 266, 479
Lallement, R., Vidal-Madjar, A., Ferlet, R., 1986, A&A, 168, 225 Lallement, R., Bertin, P., Ferlet, R., Vidal-Madjar, A., Bertaux, J.L.,
1994, A&A, 286, 898
Lallement, R., Ferlet, R., Lagrange, A.M., Lemoine, M., Vidal-Madjar, A., 1995, A&A, 304, 461
Lesh, J.R., 1972, A&AS, 5, 129 Linsky, J.L., et al., 1993, ApJ, 402, 694
Linsky, J.L., Diplas, A., Wood, B.E., Brown, A., Ayres, T.R., Savage, B.D., 1995, ApJ, 451, 335
Linsky, J.L., Wood, B.E., 1996, ApJ, in press
McCammon, D., Burrows, D.N., Sanders, W.T., Kraushaar, W.L., 1983, ApJ, 269, 107
McCammon, D., Sanders, W.T., 1990, ARA&A, 28, 657 Shortridge, K., 1988, Starlink User Note, No. 86
Vallerga, J.V., Vedder, P.W., Craig, N., Welsh, B.Y., 1993, ApJ, 411, 729
van Altena, W.F., Lee, J., Hoffleit, D., 1991, New Yale General Cata-logue of Trigonometric Stellar Parallaxes, Yale University Obser-vatory, New Haven
Vennes, S., et al., 1994, ApJ, 421, L35
Waters, L.B.F.M., Cot´e, J., Geballe, T.R., 1988, A&A, 203, 348 Welsh, B.Y., Craig, N., Vedder, P.W., Vallerga, J.V., 1994, ApJ, 437,
638
Witte, M., Rosenbauer, H., Banaszkiewicz, M., Fahr, H., 1993, Adv. Space Res., 13, (6), 121