Geosciences Theses Department of Geosciences
Fall 12-14-2016
Biodegradation of Petroleum Hydrocarbons in
Contaminated Coastal Environments, Nigeria
SAMSON ONIBIYO
Follow this and additional works at:https://scholarworks.gsu.edu/geosciences_theses
This Thesis is brought to you for free and open access by the Department of Geosciences at ScholarWorks @ Georgia State University. It has been accepted for inclusion in Geosciences Theses by an authorized administrator of ScholarWorks @ Georgia State University. For more information, please [email protected].
Recommended Citation
ONIBIYO, SAMSON, "Biodegradation of Petroleum Hydrocarbons in Contaminated Coastal Environments, Nigeria." Thesis, Georgia State University, 2016.
COASTAL ENVIRONMENTS, NIGERIA by
SAMSON ONIBIYO
Under the Direction of Daniel Deocampo, PhD
ABSTRACT
To compare the degree of biodegradation of petroleum hydrocarbons in sediments from Ikarama and Okwori in the Niger delta, Nigeria, concentrations of n-alkanes and polycyclic aromatic hydrocarbons in the sediments were measured. Analysis was conducted with gas chromatography using mass spectrometry detector. While the decrease in concentrations of n-alkanes and polycyclic aromatic hydrocarbons confirmed the process of biodegradation in the sediments it was not solely fit to substantiate the degree of biodegradation in the sediments. Hence the percentage proportion of n-alkanes and polycyclic aromatic hydrocarbons was used. The degree of biodegradation of n-alkanes in both Okwori and Ikarama was almost similar. However, it was observed polycyclic aromatic hydrocarbons were biodegraded in Okwori sediments than Ikarama sediments and this indicates the degree of biodegradation of petroleum hydrocarbons impacted sediments in Okwori is greater than that of Ikarama.
COASTAL ENVIRONMENTS, NIGERIA
by
SAMSON ONIBIYO
A Thesis Submitted in Partial Fulfillment of the Requirements for the Degree of Master of Science
In the College of Arts and Sciences Georgia State University
Copyright by Samson Deji Onibiyo
COASTAL ENVIRONMENTS, NIGERIA
by
SAMSON ONIBIYO
Committee Chair: Daniel Deocampo
Committee: Brian Meyer Nadine Kabengi
Electronic Version Approved:
DEDICATION
ACKNOWLEDGEMENTS
TABLE OF CONTENTS
ACKNOWLEDGEMENTS ... v
LIST OF TABLES ... vii
LIST OF FIGURES ... viii
1 INTRODUCTION ... 1
1.1 Factors Affecting Rate of Biodegradation ... 2
1.2 Background: Oil and Gas Exploration in the Niger Delta, Nigeria ... 7
1.2.1 Aerobic Versus Anaerobic Biodegradation of Petroleum Hydrocarbons ... 9
1.3 Purpose of Study ... 10
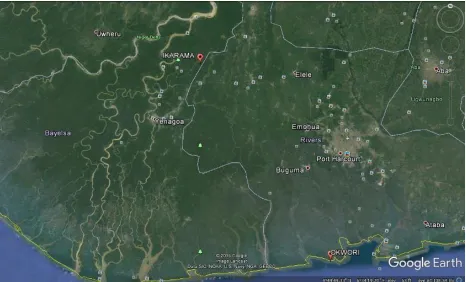
1.3.1 Study Areas ... 10
2 MATERIALS AND METHODS ... 14
2.1 Gas Chromatography-Mass Spectrometry (GC-MS) ... 14
3 Results and Discussion ... 18
3.1 N-Alkanes Series Hydrocarbons Components ... 18
3.2 Polycyclic Aromatic Hydrocarbons Components ... 24
4 CONCLUSIONS ... 32
LIST OF TABLES
Table 1: Concentration of aliphatic hydrocarbon components in the samples sediments in the first measurement ... 18 Table 2: Concentration of aliphatic hydrocarbon components in the samples sediments in the second measurement ... 20 Table 3: Percentage proportion of n-alkanes components in all the samples sediments from the first and second measurements ... 21 Table 4: Modified Percentage proportion of n-alkanes components in all the samples sediments to calculate molecular weight index ... 22 Table 5: Concentration of polycyclic aromatic hydrocarbon components in the samples
sediments in the first measurement ... 24 Table 6: Concentration of polycyclic aromatic hydrocarbon components in the samples
sediments in the second measurement ... 25 Table 7: Percentage proportion of polycyclic aromatic hydrocarbon components in all the
LIST OF FIGURES
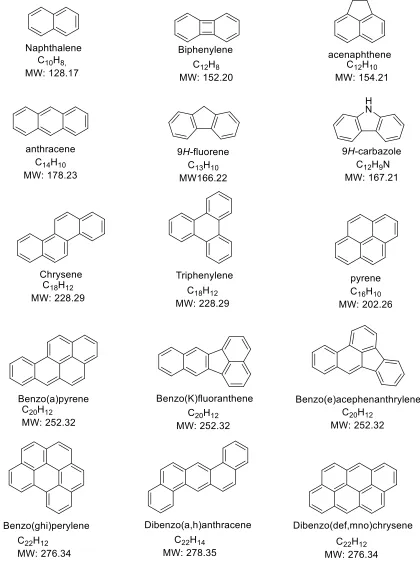
Figure 1: Study Areas Map ... 12 Figure 2: Analyzed PAHs' Chemical Structures, Chemical Formulas and Molecular Weights...12 Figure 3: Gas Chromatography- Mass Spectrometry Equipment ... 17 Figure 4: Plots showing the percentage proportion of n-alkanes present in all the samples
LIST OF ABBREVIATION
EPA: Environmental Protection Agency FME: Federal Ministry of Environment
GC-MS: Gas Chromatography-Mass Spectrometry HMW: High Molecular Weight
HP: Hewlett Packard IK: Ikarama
LMW: Low Molecular Weight
NOSDRA: National Oil Spill Detection and Response Agency OK: Okwori
PAHs: Polycyclic Aromatic Hydrocarbons PCB: Polychlorinated Biphenyl
PTFE: Polytetraflouroethylene
1 INTRODUCTION
Accidental oil spills have accounted for 10-15% of all oil that entered the world oceans, and the primary source of anthropogenic marine pollution is the land-based discharges (European Environmental Agency, 2013). Oil spills as a result of maritime accidents or oil and gas platforms and facilities failures, pose enormous environmental and economic threats to local communities, when resulting in release of crude oil into the sea (Palinkas et al., 1993; Arata et al.; Gill et al.,2012; Sammarco et al.,2013). Petroleum based products are the primary sources of energy for industry and daily life activities. In the course of exploration, production, refining, transport and storage of petroleum and petroleum products, the frequent occurrence of leaks and accidental spills is inevitable (Kven volden and Cooper, 2003). Most global petroleum hydrocarbon products can be degraded or otherwise changed by microorganisms: Microorganisms possess the ability to degrade the majority of natural hydrocarbons components, essentially the first saturated and unsaturated alkanes, monoaromatics and low molecular weight polycyclic hydrocarbons (PAHs) (Tippee, 1994; Oolman et al., 1992; Prince, 1993; Singh and Dasai, 1986; Van Hamme and Ward, 2001).The high molecular weight PAHs, resins, and asphaltenes are more resistant to biodegradation. Hydrocarbon-degrading microbes must maintain a constant contact with hydrocarbons using their substrate in order for hydrocarbons uptake to occur (Tippee, 1994; Oolman et al., 1992; Prince, 1993; Singh and Dasai, 1986; Van Hamme and Ward, 2001), and the nature of most insoluble petroleum hydrocarbons inhibit this contact (Bird and Ward, 1996b).
petroleum-derived aromatic hydrocarbon in marine sediments by Anthrocebacter, Burkholderia, Mycobacterium, Pseudomonas, Sphingomonas and Rhodococcus and subsequent degradation of n-alkanes profile of the crude oil was detected in the same marine sediments. Adebusoye et al., 2007 also reported microbial degradation of petroleum hydrocarbons in a polluted tropical stream in Lagos, Nigeria, where nine bacteria strains namely, Pseudomonas fluorescents,
P.aeruginosa, Bacillus subtilis, Bacillus sp., Alcaligenes sp., Acinetobacter lwoffi,
Flavobacterium sp. Micrococcus roseus, and Corynebacterium sp. were isolated from the stream.
Essentially, bacteria, yeast, and fungi biodegrade hydrocarbons, and their biodegradation’s efficiency varies from 6% (Jones et al., 1970) to 82% (Pinholt et al., 1979) for
fungi, 0.13% (Jones et al., 1970) to 50% (Pinholt et al., 1979) for soil bacteria , and 0.003% (Holloway et al., 1980) to 100% ( Mulkinesetal, 1974) for marine bacteria. Bacteria are the most active agents in petroleum hydrocarbon biodegradation and they act as the pioneering degraders of oil spills in polluted environments (Rahman et al., 2003; Brooijmans et al., 2009). Several bacteria are renowned for feeding solely on hydrocarbons as a means of life sustenance (Yakimov et al., 2007). Due to a wide range of molecular structures present in crude oil in soil, freshwater and marine environments, many scientists prescribed the use of mixed microorganism populations, capable of rapidly degrading crude oil in the biotransformation of these complex hazardous environmental contaminants (Bartha and Bossert, 1984; Cooney, 1984 Atlas, 1985; Floodgate, 1984).
1.1 Factors Affecting Rate of Biodegradation
weight aromatics > cyclic alkanes (Perry, 1984). As mentioned earlier the saturates have been recorded to have the highest rate of biodegradation, followed by the light molecular weight aromatics while high molecular weight aromatics and polar compounds have extremely low rates of degradation (Fusey and Oudot, 1984; Jobson et.al, 1972; Walker et al., 1976). However, these patterns are not globally uniform and conventional; greater degradation of naphthalene than hexadecane in water-sediment mixtures from a freshwater lake, alkyl aromatics in preferential order to detectable changes in the n-alkanes profile in marine sediments contaminated with crude oil. Also quicker attack on aromatic hydrocarbons during the biodegradation of crude oil by marine microbial strains from a pristine and a commercial harbor has been recorded (Cooney et al., 1985; Jones et al., 1983; Fedorak and Westlake, 1981). Although, resins and ashphaltenes have been formerly considered to be recalcitrant to biodegradation, they were observed to have been degraded appreciably by using a continuous culture fermentation and a mixed culture of marine bacteria, and co-oxidation process in which non-growth hydrocarbons which are oxidized in the presence of hydrocarbons which can act as growth substrates (Horowitz and Atlas, 1977; Bertrand et al., 1983; Walker et al., 1975; Perry, 1979; Rontani et al., 1985).
Nutrients like nitrogen, phosphorus, sometimes iron are the essential precursors in biodegradation of hydrocarbon contaminants (Cooney, 1984). Some of these nutrients could become the controlling factor invariably influencing biodegradation processes. A significant increase of carbon in freshwater and marine water when a large oil spill occurred rendered the available quantities of nitrogen and phosphorus the limiting factors in the oil degradation process (Cooney, 1984). Due to low levels of nitrogen and phosphorus in sea water, their limiting effect is more excruciating in marine environments than freshwater environments. Freshwater wetlands are known for lack of nutrients due to high demands of nutrients by the plants within the environments (Atlas, 1985; Floodgate, 1984; Mitsch and Gosselink, 1993). Hence, nutrients supplements were imperative to improve the biodegradation of oil contaminants (Choi et al., 2002; Kim et al., 2005). Conversely, excessive nutrients availability can prevent the process of biodegradation (Chaillan et al., 2006). Several adverse impacts of high level of Nitrogen-Phosphorus-Potassium (NPK) on the biodegradation of hydrocarbons have been recorded, in which there was no increase in biodegradation rate or an increase only after several months delay (Oudot et al., 1998; Chaineau et al., 2005) and commonly on aromatics (Carmichael and Pfaender, 1997).
decrease in the rate of hydrocarbons metabolism within the increasing salinity range of 3.3 -28.4 psu has been registered as a result of an overall reduction in microbial metabolism in the environment.
The pH of an environment has an effect on the biodegradability of hydrocarbons pollutants in it. Dissimilar to most aquatic environments, pH of the soil is highly variable over a wide range: mine spoil of pH unit 2.5 through 11 in alkaline deserts (Bossert and Bertha, 1984). Most optimal microbial activity is enhanced by a pH close to neutrality, with fungi being more tolerant than bacteria in acidic condition (Atlas, 1988). The rate of biodegradation of gasoline was found to be doubled when its soil pH changed from 4.5 to 7.4. However a significant decrease in the rate was recorded when the pH was further increased to 8.5 (Verstraete et al., 1976).
high extent of growth and enzymatic activity in the environment, competitiveness with indigenous microorganism, non-pathogenicity and inability to produce toxic metabolites.
The role of oxidation in biodegradation of hydrocarbons cannot be overemphasized. The priority steps in the catabolism of aliphatic, cyclic and aromatics hydrocarbons by microbial activities require the oxidation of the substrate by oxygenase. Hence, a need for molecular oxygen is required inevitably (Cerniglia, 1984; Perry, 1984; Singer et al., 1985). Oxygen as a limiting condition is not applicable to the upper levels of the water columns in marine and freshwater environments. However, aquatic sediments are considered anoxic except the layers at the sediments surfaces (Cooney, 1984; Floodgate, 1984; Hambrick, 1980). The presence of oxygen in soil depends on rates of microbial oxygen consumption, soil type, soil moisture content and availability of utilizable substrates which can promote oxygen depletion (Bossert and Bartha, 1984). The concentration of oxygen has been observed as the rate-controlling variable in the biodegradation of petroleum hydrocarbons in soil and groundwater (Jamison et al., 1975; Von Wedel et al., 1988). However, several recent studies have shown that monoaromatic hydrocarbons such as benzene, toluene, xylene, and hexadecane and some low molecular weight polycyclic aromatic hydrocarbons can be broken down anaerobically, using nitrate, ferric and sulfate ions as terminal electron acceptors in oxidizing the hydrocarbon pollutants to water and carbon dioxide (Beller et al., 1992; Coates et al., 1996; Lovely et al., 1994; Rabus and Widdel, 1995; Reuter et al., 1994)
biodegradation. Temperature also influences the solubility of hydrocarbons (Foght et al., 1996). Although a decrease in temperature reduces the rate of biodegradation, the process takes place over a broad range of temperature. The decreasing order of degradation rates occur in the ranges 30-40 0C, 20-30 0C and 15-20 0C in soil, freshwater and marine environments respectively (Bartha and Bossert, 1984; Cooney, 1984). Venosa and Zhu, 2003, recorded the effects of ambient temperature on both the properties of spilled oil and the microbial activity. Biodegradation of petroleum hydrocarbons has occurred even in psychrophilic environments in temperate areas (Pelletier et al., 2004; Delille et al., 2004)
1.2 Background: Oil and Gas Exploration in the Niger Delta, Nigeria
Nigeria is one of the largest oil producing countries in the world. The economy of Nigeria solely depends on the oil and gas industries which carry out most of their exploration and production activities in the Niger Delta (Ijah, 1998). The Niger Delta is a great wetland and marine ecosystems. However, the region has been rendered one of the five world’s severely
hydrocarbons devastated environments due to unsustainable oil exploration activities (FME, 2006). The oil spill is a regular event in the Nigeria, causes by corrosion of pipelines and tanks, sabotage and vandalization of pipelines, accidents, mishandling of facility and oil production operations (Nwilo and Badejo, 2005). Crude oil spills have devastated both terrestrial and aquatic environments in the Niger Delta for more than 50 years of crude oil exploration and production (Adati, 2012).
water throughout the creeks. Bayelsa State is one the most prolific oil and gas states in the Niger Delta. However, it is confronted with the worst environmental despoliation caused by oil and gas exploration and exploitation activities ever recorded in the country. The National Oil Spill Detection and Response Agency (NOSDRA) revealed that Bayelsa State experienced about 40 oil spills in a month. The rate of crude oil spills in Bayelsa State is more destructive than that of the globally reported Ogoni land (NOSDRA, 2014).
The final destinations of the spilled oil vary from one part of the globe to the other, due to many remediations and recovery approaches. In Europe, it has been legislated that as soon as an accidental oil spill occurs, a monitoring program responsible for quantifying the environmental impacts of the spill usually sets up. The assessment of the environmental impact is vital for the decision-making procedures in the choice and execution of an appropriate response and restoration plans (Kirby and Law, 2010). The oil and gas sector in Nigeria by practice and perception has fallen short of its expectation to combat the incessant life threatening environmental pollution in the Niger Delta region. Pollution as a result of activities of oil companies in Nigeria has made life miserable for their host communities; aquatic life is wiped out, agriculture activities are disrupted, and hazardous gasses are released into the atmosphere (Mitchell et al., 2001; Collier and Hoefler, 2005).
polluted sites the oil companies claimed to have cleaned up, the nature of remediation and recovery procedures were not adequately documented (UNEP,2011).
The fate of hydrocarbon contaminants in an environment is determined by their chemical nature and the presence of the degradative microbial community. If the polluted area has favorable environmental factors for microbial activities and metabolisms, there is a tendency for the growth of the active and viable community of hydrocarbon utilizing microorganisms (Chikere et al., 2011, 2012b). Considering a massive amount of oil pollution in the Niger Delta region mainly on farmland and rivers, the need to clean up the environment is sacrosanct (Vincent et al., 2011). Conventional methods of physical removal of oil are the first response which is not always virile enough to achieve a complete clean-up process. Likewise, mechanical methods maximally recover 10-15% of crude oil after a major oil spill and the rest of the crude oil is left to worsen the conditions of the contaminated environment (Abu and Dike, 2008)
1.2.1 Aerobic Versus Anaerobic Biodegradation of Petroleum Hydrocarbons
microorganisms that can mineralize hydrocarbons under anaerobic conditions: the facultative anaerobes which use nitrate, iron and manganese as their electron acceptor and the strict anaerobes which use sulfate as their electron acceptor. Many studies have shown the anaerobic oxidation of hydrocarbons by pure bacterial cultures which involve sulfate, nitrate, iron or manganese reducing conditions (Coates et al., 1997; Fries et al., 1994).
1.3 Purpose of Study
Numerous studies on the environmental pollution in the Niger Delta have been carried out (Kakulu and Osibanjo, 1992; Daniel and Braide, 2002; Iwegbue et al., 2006; Chikere and Ekwuabu, 2014; Asuquo and Ewa-Oboho, 2004; Nkpaa et al., 2013; Umeh, 2009). Nevertheless, most previous studies have been restricted to small areas and usually done on surface water, groundwater, vegetation, microbial community and fishes. Limited data are available on the occurrence of PAHs and n-alkanes compounds in the soil and sediments of the region. The main objectives of this study are to investigate the level of hydrocarbon contamination in two communities in the Niger Delta and also to compare the biodegradation rates in those communities. The hypothesis is that the rate of biodegradation is faster under aerobic conditions than anaerobic conditions; a marine environment is considered to be more aerobic than a freshwater environment (Bertrand et al., 1989; Coates et al., 1997).
1.3.1 Study Areas
sea level. The main soil types in Ikarama are young, shallow, poorly drained (clayey) and acid sulfate soils with texture ranging from medium to fine grains (Wizor and Agbabou,2014)
Okwori is located River state, on latitude 4022’00” N and longitude 6057’ 00”E. It is a typical marine setting in the Niger Delta region; consist of marine sediments which are mainly supplied by the Benue-Niger drainage system and the Cross rivers system which supplied sediments to the eastern delta area of which the south eastern offshore is a prominent portion. The sediments are mainly sand and few pebbles with texture ranging from fine to coarse grains*
*www.offshore-mag.com
MW=Molecular Weight
2 MATERIALS AND METHODS
Sediments and water samples were collected at five different points in both Ikarama and Okwori, Niger Delta; 3 sediments samples from Ikarama and 2 sediment samples from Okwori. These sites were selected due to their similarity in the nature of crude oil pollution and difference in their oxidation potentials. Okwori being close to a beach, a marine water environment considered to be more oxidizing than Ikarama, a swampy-freshwater environment. The samples were
collected by scooping petroleum hydrocarbons contaminated sediments from the surface landscape randomly from the study areas and stored in colorless borosilicate glass containers with polytetrafluoroethylene (PTFE) lined caps. Ikarama samples were labeled IK1-IK3 and Okwori samples, OK1-OK2. The samples were stored in the refrigerator at 4 0C before they were taken to the laboratory for analysis.
2.1 Gas Chromatography-Mass Spectrometry (GC-MS) *
The sample is injected into the inlet where it is volatilized and an appreciable portion is taken onto the column aided by the carrier gas (N2 or He). Differential partitioning then separated the sample components into stationary and mobile phases. The separated sample components are removed from the column into the detector where their physicochemical property is detected and a signal is generated. The signal is then amplified and sent to the data system where the chromatograph is electronically constructed.
transferred to the required parts of the instrument. Control is always maintained on the incoming gas and the gas supply to the various parts of the instrument.
Injector: Here the sample is volatilized and the resulting gas is moved into the carrier stream entering the GC column.
Column: In GC, retention of analyte molecules is as a result of stronger interactions with stationary phase and mobile phase. The interactions could be dispersive, dipole or hydrogen bonding. The sample is separated into its different components in the column. Columns differ in length and internal diameter based on the application type and can either be packed or capillary. Packed columns are packed with a solid support coated with immobilized liquid stationary phase material. Capillary columns are long hollow silica tubes with their inside walls coated with immobilized liquid stationary phase material of various film thickness.
Column oven: Temperature in GC is controlled through a heated oven. The oven heats effectively to give excellent thermal control. The oven is cooled using a fan and vent set-up usually at the back of the oven. A hanger or cage is always attached to support the GC column and prevents it from touching the oven walls because this could damage the column. The injector and detector connections are also cased in the GC oven. During isothermal operation, the GC is held at a steady temperature while in temperature programmed GC, the oven temperature is raised based on the analysis temperature program.
Detector: The detector responds to a physicochemical property of the analyte, the response is amplified and an electronic signal is generated for the data system to produce a chromatogram, where the quantitative mass spectrometry of the analytes is taken.
To measure the n-alkanes and PAHs hydrocarbons components in the samples, Hewlett Packard 6890 Gas Chromatography oven supplied with an HP 5973 Mass Selective Detector (MSD) and HP 6890 auto-injection unit was used at the University of Georgia, Athens. The analyses were performed by Dr. Sayed M. Hassan in the Laboratory for Environmental Analysis, Center for Applied Isotopes Studies.
Soil samples were extracted with a mixture of equal volumes of acetone and dichloromethane in an ultrasonic bath for three times. The extracts were evaporated to dryness using a stream of nitrogen gas passing over them, and they are then dissolved in toluene for Gas Chromatography-Mass Spectrometer by adapting to Environmental Protection Agency (EPA) method 8275A except thermal extract part of it.
The Gas Chromatography oven program for PAHs and n-alkanes is as follows: Column type – HP 19091J-433.HP-5, 30m X 250μm X 0.25μm film thickness, silicone coated fused silica
capillary column kept at the constant pressure of 8.99 psi. The inlet temperature was 250 0C, pressure 8.99 psi and split ratio was 50:1.
Oven – initial temperature 50 0
3 RESULTS AND DISCUSSION
[image:30.612.103.509.157.555.2]3.1 N-Alkanes Series Hydrocarbons Components
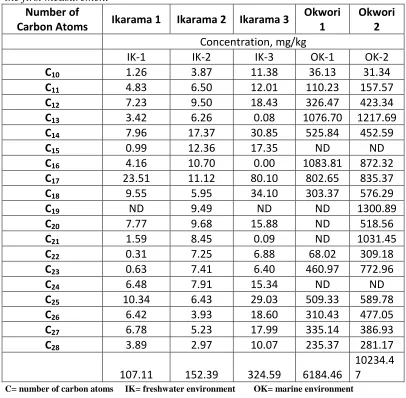
Table 1: Concentration of aliphatic hydrocarbon components in the samples sediments in the first measurement
C= number of carbon atoms IK= freshwater environment OK= marine environment
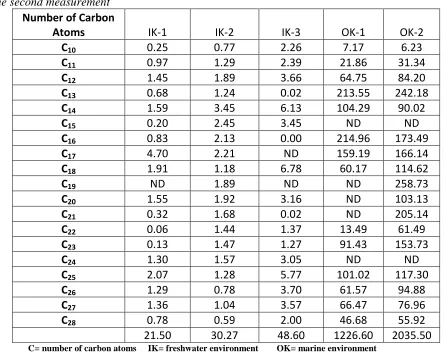
Table 1 shows the concentrations and the sum of concentrations of aliphatic hydrocarbons contents in the samples sediments from Ikarama (IK) and Okwori (OK) which were measured the first day the samples got to the laboratory. Table 2 shows the concentrations and the sum of concentrations of aliphatic hydrocarbons contents in the same samples measured two days later after they got to the laboratory (not kept in a degradation amenable condition).
Number of
Carbon Atoms Ikarama 1 Ikarama 2 Ikarama 3
Okwori 1
Okwori 2
Concentration, mg/kg
IK-1 IK-2 IK-3 OK-1 OK-2
C10 1.26 3.87 11.38 36.13 31.34
C11 4.83 6.50 12.01 110.23 157.57
C12 7.23 9.50 18.43 326.47 423.34
C13 3.42 6.26 0.08 1076.70 1217.69
C14 7.96 17.37 30.85 525.84 452.59
C15 0.99 12.36 17.35 ND ND
C16 4.16 10.70 0.00 1083.81 872.32
C17 23.51 11.12 80.10 802.65 835.37
C18 9.55 5.95 34.10 303.37 576.29
C19 ND 9.49 ND ND 1300.89
C20 7.77 9.68 15.88 ND 518.56
C21 1.59 8.45 0.09 ND 1031.45
C22 0.31 7.25 6.88 68.02 309.18
C23 0.63 7.41 6.40 460.97 772.96
C24 6.48 7.91 15.34 ND ND
C25 10.34 6.43 29.03 509.33 589.78
C26 6.42 3.93 18.60 310.43 477.05
C27 6.78 5.23 17.99 335.14 386.93
C28 3.89 2.97 10.07 235.37 281.17
107.11 152.39 324.59 6184.46
[image:30.612.104.510.160.549.2]Table 2: Concentration of aliphatic hydrocarbon components in the samples sediments in the second measurement
Number of Carbon
Atoms IK-1 IK-2 IK-3 OK-1 OK-2
C10 0.25 0.77 2.26 7.17 6.23
C11 0.97 1.29 2.39 21.86 31.34
C12 1.45 1.89 3.66 64.75 84.20
C13 0.68 1.24 0.02 213.55 242.18
C14 1.59 3.45 6.13 104.29 90.02
C15 0.20 2.45 3.45 ND ND
C16 0.83 2.13 0.00 214.96 173.49
C17 4.70 2.21 ND 159.19 166.14
C18 1.91 1.18 6.78 60.17 114.62
C19 ND 1.89 ND ND 258.73
C20 1.55 1.92 3.16 ND 103.13
C21 0.32 1.68 0.02 ND 205.14
C22 0.06 1.44 1.37 13.49 61.49
C23 0.13 1.47 1.27 91.43 153.73
C24 1.30 1.57 3.05 ND ND
C25 2.07 1.28 5.77 101.02 117.30
C26 1.29 0.78 3.70 61.57 94.88
C27 1.36 1.04 3.57 66.47 76.96
C28 0.78 0.59 2.00 46.68 55.92
21.50 30.27 48.60 1226.60 2035.50
C= number of carbon atoms IK= freshwater environment OK= marine environment
n-alkanes components in all the samples sediments were calculated from Table 1 and Table 2 to produce Table 3. Using the mathematical relation as below;
𝒑𝒆𝒓𝒄𝒆𝒏𝒕𝒂𝒈𝒆 𝒑𝒓𝒐𝒑𝒐𝒓𝒕𝒊𝒐𝒏 =
(𝒄𝒐𝒏𝒄𝒆𝒏𝒕𝒓𝒂𝒕𝒊𝒐𝒏 𝒐𝒇 𝒂 𝒄𝒐𝒎𝒑𝒐𝒏𝒆𝒏𝒕/𝒕𝒐𝒕𝒂𝒍 𝒄𝒐𝒏𝒄𝒆𝒏𝒕𝒓𝒂𝒕𝒊𝒐𝒏 𝒐𝒇 𝒂𝒍𝒍 𝒄𝒐𝒎𝒑𝒐𝒏𝒆𝒏𝒕𝒔 ) ∗
[image:33.612.100.512.237.677.2]𝟏𝟎𝟎 %
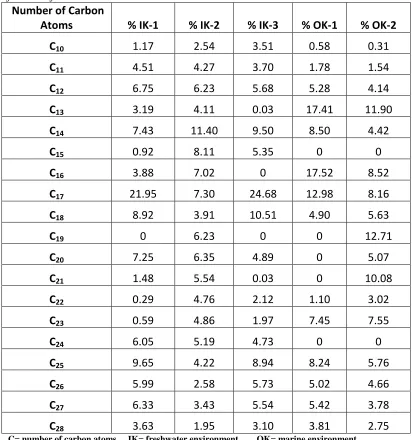
Table 3: Percentage proportion of n-alkanes components in all the samples sediments from the first and second measurements
Number of Carbon
Atoms % IK-1 % IK-2 % IK-3 % OK-1 % OK-2
C10 1.17 2.54 3.51 0.58 0.31
C11 4.51 4.27 3.70 1.78 1.54
C12 6.75 6.23 5.68 5.28 4.14
C13 3.19 4.11 0.03 17.41 11.90
C14 7.43 11.40 9.50 8.50 4.42
C15 0.92 8.11 5.35 0 0
C16 3.88 7.02 0 17.52 8.52
C17 21.95 7.30 24.68 12.98 8.16
C18 8.92 3.91 10.51 4.90 5.63
C19 0 6.23 0 0 12.71
C20 7.25 6.35 4.89 0 5.07
C21 1.48 5.54 0.03 0 10.08
C22 0.29 4.76 2.12 1.10 3.02
C23 0.59 4.86 1.97 7.45 7.55
C24 6.05 5.19 4.73 0 0
C25 9.65 4.22 8.94 8.24 5.76
C26 5.99 2.58 5.73 5.02 4.66
C27 6.33 3.43 5.54 5.42 3.78
C28 3.63 1.95 3.10 3.81 2.75
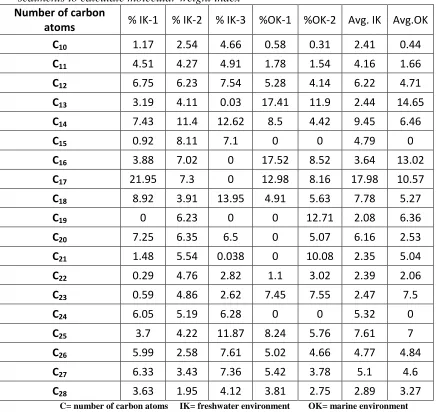
Table 4: Modified Percentage proportion of n-alkanes components in all the samples sediments to calculate molecular weight index
Number of carbon
atoms % IK-1 % IK-2 % IK-3 %OK-1 %OK-2 Avg. IK Avg.OK
C10 1.17 2.54 4.66 0.58 0.31 2.41 0.44
C11 4.51 4.27 4.91 1.78 1.54 4.16 1.66
C12 6.75 6.23 7.54 5.28 4.14 6.22 4.71
C13 3.19 4.11 0.03 17.41 11.9 2.44 14.65
C14 7.43 11.4 12.62 8.5 4.42 9.45 6.46
C15 0.92 8.11 7.1 0 0 4.79 0
C16 3.88 7.02 0 17.52 8.52 3.64 13.02
C17 21.95 7.3 0 12.98 8.16 17.98 10.57
C18 8.92 3.91 13.95 4.91 5.63 7.78 5.27
C19 0 6.23 0 0 12.71 2.08 6.36
C20 7.25 6.35 6.5 0 5.07 6.16 2.53
C21 1.48 5.54 0.038 0 10.08 2.35 5.04
C22 0.29 4.76 2.82 1.1 3.02 2.39 2.06
C23 0.59 4.86 2.62 7.45 7.55 2.47 7.5
C24 6.05 5.19 6.28 0 0 5.32 0
C25 3.7 4.22 11.87 8.24 5.76 7.61 7
C26 5.99 2.58 7.61 5.02 4.66 4.77 4.84
C27 6.33 3.43 7.36 5.42 3.78 5.1 4.6
C28 3.63 1.95 4.12 3.81 2.75 2.89 3.27
C= number of carbon atoms IK= freshwater environment OK= marine environment
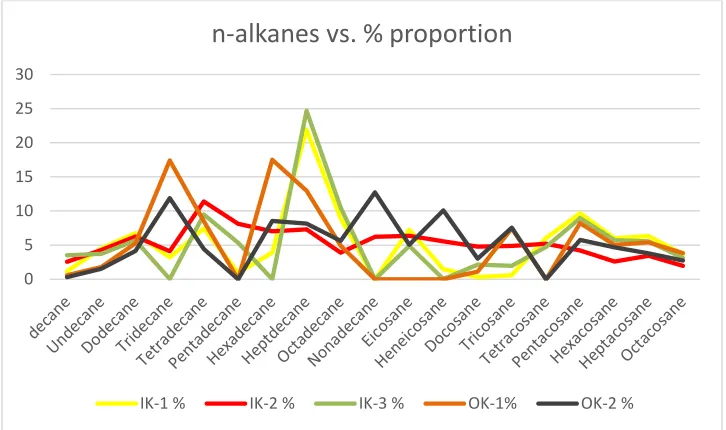
Docosane, Tetracosane, Pentacosane, Hexacosane, Heptacosane and Octacosane are more degraded in Okwori sediments due to their lower percentage proportion values than the Ikarama sediments which have higher percentage proportions. Tridecane, Hexadecane, Nonadecane, Heneicosane and Tricosane are more biodegraded in Ikarama than Okwori. Obviously, the degree of biodegradation in Okwori, a marine environment is more than that of Ikarama, a freshwater environment. The extent of biodegradation of n-alkanes in the two environments can be seen in Figure 4 below.
Figure 4: Plots showing the percentage proportion of n-alkanes present in all the samples sediments
Also, the molecular weight index of the alkanes is calculated as ratio of sum of lower carbons
atoms to sum of higher carbon atoms as follows 𝑀𝑊𝐼𝑎𝑙𝑘𝑎𝑛𝑒𝑠 =Σ(𝐶10− 𝐶19) Σ(𝐶
20− 𝐶28)
⁄ .
From table 4 above, the molecular weight index of Ikarama is approximately 1.6 and that of Okwori is approximately 1.7. This is not a significant difference, so with regard to preferential degradation of short versus long chain alkanes, the two localities are very similar.
0 5 10 15 20 25 30
n-alkanes vs. % proportion
3.2 Polycyclic Aromatic Hydrocarbons Components
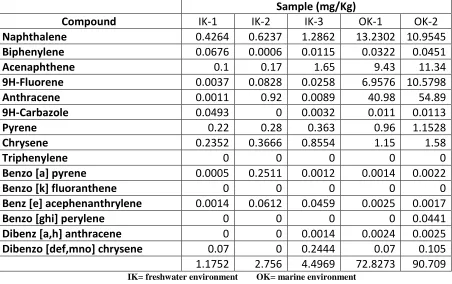
Table 5: Concentration of polycyclic aromatic hydrocarbon components in the samples sediments in the first measurement
Sample (mg/Kg)
Compound IK-1 IK-2 IK-3 OK-1 OK-2
Naphthalene 0.4264 0.6237 1.2862 13.2302 10.9545
Biphenylene 0.0676 0.0006 0.0115 0.0322 0.0451
Acenaphthene 0.1 0.17 1.65 9.43 11.34
9H-Fluorene 0.0037 0.0828 0.0258 6.9576 10.5798
Anthracene 0.0011 0.92 0.0089 40.98 54.89
9H-Carbazole 0.0493 0 0.0032 0.011 0.0113
Pyrene 0.22 0.28 0.363 0.96 1.1528
Chrysene 0.2352 0.3666 0.8554 1.15 1.58
Triphenylene 0 0 0 0 0
Benzo [a] pyrene 0.0005 0.2511 0.0012 0.0014 0.0022
Benzo [k] fluoranthene 0 0 0 0 0
Benz [e] acephenanthrylene 0.0014 0.0612 0.0459 0.0025 0.0017
Benzo [ghi] perylene 0 0 0 0 0.0441
Dibenz [a,h] anthracene 0 0 0.0014 0.0024 0.0025
Dibenzo [def,mno] chrysene 0.07 0 0.2444 0.07 0.105
1.1752 2.756 4.4969 72.8273 90.709
IK= freshwater environment OK= marine environment
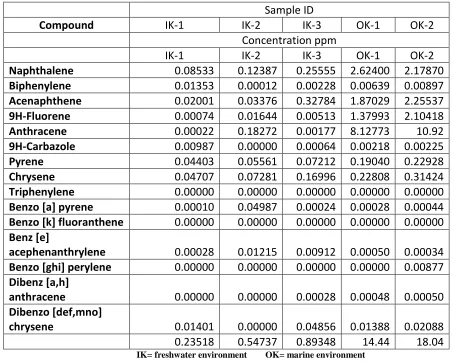
sediments, 0-0.32784 mg/Kg in IK-3 sediments, 0-8.12773 mg/Kg in OK-1 sediments, 0-10.92 mg/Kg in OK-2 sediments. The sum of concentrations of PAHs components in all the samples are 1.1752 mg/Kg, 2.756 mg/Kg, 4.4969 mg/Kg, 72.8273 mg/Kg and 90.709 mg/Kg for IK-1, IK-2, IK-3, OK-1 and OK-2 respectively as shown in Table 5 while the sum of concentrations of the PAHs components in all the samples for IK-1, IK-2, IK-3, OK-1 and OK-2 are 0.23518 mg/Kg, 0.54737 mg/Kg, 0.89348 mg/Kg,14.14 mg/Kg and 18.04 mg/Kg respectively as shown in Table 6.
Table 6: Concentration of polycyclic aromatic hydrocarbon components in the samples sediments in the second measurement
Sample ID
Compound IK-1 IK-2 IK-3 OK-1 OK-2
Concentration ppm
IK-1 IK-2 IK-3 OK-1 OK-2
Naphthalene 0.08533 0.12387 0.25555 2.62400 2.17870
Biphenylene 0.01353 0.00012 0.00228 0.00639 0.00897
Acenaphthene 0.02001 0.03376 0.32784 1.87029 2.25537
9H-Fluorene 0.00074 0.01644 0.00513 1.37993 2.10418
Anthracene 0.00022 0.18272 0.00177 8.12773 10.92
9H-Carbazole 0.00987 0.00000 0.00064 0.00218 0.00225
Pyrene 0.04403 0.05561 0.07212 0.19040 0.22928
Chrysene 0.04707 0.07281 0.16996 0.22808 0.31424
Triphenylene 0.00000 0.00000 0.00000 0.00000 0.00000
Benzo [a] pyrene 0.00010 0.04987 0.00024 0.00028 0.00044
Benzo [k] fluoranthene 0.00000 0.00000 0.00000 0.00000 0.00000
Benz [e]
acephenanthrylene 0.00028 0.01215 0.00912 0.00050 0.00034
Benzo [ghi] perylene 0.00000 0.00000 0.00000 0.00000 0.00877
Dibenz [a,h]
anthracene 0.00000 0.00000 0.00028 0.00048 0.00050
Dibenzo [def,mno]
chrysene 0.01401 0.00000 0.04856 0.01388 0.02088
0.23518 0.54737 0.89348 14.44 18.04
IK= freshwater environment OK= marine environment
photo-oxidation, air oxidation and volatilization have taken place in the sediments as a means of natural attenuation of the hydrocarbons components.
[image:38.612.83.525.352.665.2]The higher proportion of low molecular weight-PAHS such as naphthalene, acenaphthene, flourene and anthracene than the high molecular weight-PAHs such as pyrene and chrysene confirms the sources of the hydrocarbons in all the sediments to be petrogenic, according to Rocher et al., (2004). Like in the case of n-alkanes components in all the samples sediments, the rate of decrease in the concentrations of PAHs in the sediments is also the same. Hence, the use of percentage proportions of the PAHs is employed to establish the degree of biodegradation that has occurred in the sample sediment as shown in Table 7 and Table 8.
Table 7: Percentage proportion of polycyclic aromatic hydrocarbon components in all the samples sediments from the first and second measurements
Compounds % IK-1 % IK-2 % IK-3 % OK-1 % OK-2
Naphthalene 36.28 22.63 28.60 18.17 12.10
Biphenylene 5.75 0.02 0.26 0.04 0.05
Acenaphthene 8.51 6.17 36.69 12.95 12.50
9H-Flourene 0.31 3.00 0.57 9.55 11.66
Anthracene 0.09 33.38 0.20 56.27 60.51
9H-Carbazole 4.20 0 0.07 0.02 0.01
Pyrene 18.72 10.16 8.07 1.32 1.27
Chrysene 20.01 13.30 19.02 1.58 1.74
Triphenylene 0 0 0 0 0
Benzo [a] pyrene 0.04 9.11 0.027 0.002 0.002
Benzo [k] fluoranthene 0 0 0 0 0
Benz [e] acephenanthrylene 0.20 2.22 1.02 0.003 0.002
Benzo [ghi] perylene 0 0 0 0 0.05
Dibenz [a,h] anthracene 0 0 0.03 0.003 0.003
Dibenzo [def,mno] chrysene 5.96 0 5.43 0.10 0.12
100 100 100 100 100
Table 8: Modified percentage proportion of polycyclic aromatic hydrocarbon components in selected samples sediments to calculate average molecular weight.
Compounds % IK-1 % IK-2 % IK-3 % OK-1 % OK-2 Avg.% IK Avg. % OK (Avg. % IK)* MW (Avg. % OK)* MW Naphthalene 36.28 22.63 28.6 18.17 12.1 29.17 15.14 3738.72 1940.49
Acenaphthene 8.51 6.17 36.69 12.95 12.5 17.12 12.73 2640.08 1963.09
9H-flourene 0.31 3 0.57 9.55 11.66 1.29 10.61 214.42 1763.59
Anthracene 0.09 33.38 0.2 56.27 60.51 11.22 58.39 1999.74 10406.85
Pyrene 18.72 10.16 8.07 1.32 1.27 12.32 1.30 2491.72 262.93
Chrysene 20.01 13.3 19.02 1.58 1.74 17.44 1.66 3981.38 378.96
15066.06 16715.91
IK= freshwater environment OK= marine environment MW= Molecular Weight
From table 8 above, the sum of the average molecular weight of selected PAHs is calculated
using the mathematical relation below 𝑀𝑊𝑃𝐴𝐻= ∑ 𝐴𝑣𝑒𝑟𝑎𝑔𝑒 %𝑃𝐴𝐻 ∗ 𝑖𝑡𝑠 𝑀𝑜𝑙𝑒𝑐𝑢𝑙𝑎𝑟 𝑊𝑒𝑖𝑔ℎ𝑡 . The sum of average molecular weight of Okwori sediment samples is approximately 167 which is higher than that of Ikarama, 151. Based on these values, the Okwori PAHs are somewhat heavier than that of Ikarama - this indicates lighter PAHs have been degraded more at Okwori
[image:39.612.89.521.507.707.2]than Ikarama.
Table 9: Percentage proportion of the selected few polycyclic aromatic hydrocarbon components in all the samples sediments from the second measurement
Compounds IK-1 % IK-2 % IK-3% OK-1% OK-2%
Naphthalene 36.28 22.63 28.60 18.17 12.10
Acenaphthene 8.51 6.17 36.69 12.95 12.50
9H-flourene 0.31 3.00 0.57 9.55 11.66
Anthracene 0.09 33.38 0.20 56.27 60.51
Pyrene 18.72 10.16 8.07 1.32 1.27
Chrysene 20.01 13.30 19.02 1.58 1.74
Due to ease in biodegradability and low molecular weight of 2, 3 and 4-benzene rings PAHs through natural attenuation process; Naphthalene, Acenaphthene, Flourene, Anthracene, Pyrene and Chrysene are preferably selected. Table 9 above displays the percentage proportions of the few selected PAHs components due their relative abundant concentrations values which cut across all the samples sediments.
Figure 5: Bar charts showing the percentage proportions of PAHs in the samples sediments from Okwori
Figure 6: Bar charts showing the percentage proportions of PAHs in the samples sediments from Ikarama
0 10 20 30 40 50 60 70
Naphthalene Acenaphthene 9H-flourine Anthracene Pyrene Chrysene
PAHs Vs. % proportion in Okwori
OK-1% OK-2%
0 5 10 15 20 25 30 35 40 45 50
Naphthalene Acenaphthene 9H-flourine Anthracene Pyrene Chrysene
PAHs Vs. % proportion in Ikarama
[image:41.612.126.487.360.573.2]The sum of concentrations of PAHs in the study areas are on the high side as compared to other oil spill occurrences. The Sum of concentrations of PAHs in the study areas ranged from 1.175 – 90.709 mg/Kg as compared to the sum of PAHs in the contaminated sediments of study
[image:42.612.142.503.289.508.2]areas conducted by Olajire et al., 2004, in Delta state, Niger Delta region of Nigeria which ranged from 0.0207-0.0721 mg/Kg. Also in a study conducted by Sammarco et al., 2013, the sum of concentrations of PAHs in contaminated sediments associated with BP/Deepwater Horizon oil spill ranged from 0.003- 4.780.960 mg/Kg.
Figure 7: Maximum Sum of PAHs Recorded in Different Three Oil Spills
However, the oil spills in the study areas have similarities to that of the Deepwater Horizon oil spill in terms of source and nature of contaminants; emanated from oil well infrastructural failure and typical light crude oil was discharged into the environment. A typical light crude oil like that of DWH oil spill contains 55-90% n-alkanes as saturates, 10-35% PAHs and their alkylated homologues, 0-10% resins and 0-10% asphalthenes, with more than 50% low molecular weight
0 1000 2000 3000 4000 5000 6000
Deepwater Horizon
Warri, Delta State
Study Areas
Maximum Sum of PAHs Concentration Recorded (mg/Kg
)
hydrocarbon constituents (Boehm,2006; Ryerson et al., 2011). Buzzards Bay oil spill in which type 2 fuel oil was discharged into the environment from bunker vessel is different from the study areas spills which released crude oil as the contaminant from failed oil wells.
The concentration levels of some selected PAHs are above the allowable limits according to the EPA standards. These rendered the study areas highly contaminated and appropriate cleanup process should be ensued.
Table 10: Sediment Quality Criteria versus Recorded Concentrations in Study Areas
PAHs
Sediment Concentration Criteria (mg/Kg)
Okwori Sediment Conc. Range
(mg/Kg)
Ikarama Sediment Conc. Range (mg/Kg)
Naphthalene 0.01 2.17-10.95 0.085-1.29
Flourene 0.2 1.38-10.57 0.00074-0.026
Anthracene 0.06 8.12-54.89 0.00022-0.92
Pyrene 0.2 0.19-1.15 0.044-0.36
4 CONCLUSIONS
It is a herculean task to understand the complexity of biodegradation of hydrocarbons process in an environment. The quantitative and qualitative analyzes of the biodegradation process are affected by the nature and amount of hydrocarbons present, surrounding and seasonal environmental conditions and the presence of autochthonous microbial population.
This study shows that microbial mineralization of n-alkanes and PAHs has taken place in the samples sediments from both Ikarama and Okwori. It has been established that the degree of microbial degradation of petroleum hydrocarbons in the aerobic Okwori setting is higher than that of the anaerobic Ikarama setting based on the percentage proportions of the concentrations of hydrocarbons components in all the samples sediments. The observation could be due to the presence of more efficient hydrocarbons degrading microorganisms, photo-oxidation, air oxidation and evaporation of petroleum hydrocarbons in marine environment than in the freshwater environment. As earlier mentioned in the reviewed pieces of literature, bacteria are the most active microorganisms in the biotransformation of hydrocarbons and their biodegradation efficiency is higher in marine environment than in the freshwater environment. Consequently, the degree of biodegradation of petroleum hydrocarbons in Okwori is higher than it is in Ikarama. The presence of efficient petroleum hydrocarbons degrading bacteria community in a marine environment is larger than the one in a freshwater environment due to the encouraging factors as stated earlier in the reviewed literatures.
the bioavailability and solubility of the petroleum hydrocarbons in Okwori samples sediments to microbial mineralization while that of Ikarama petroleum hydrocarbons tend to sorb to the sandy clay sediments which require greater effort for the microbial community to access the hydrocarbons.
The rate of metabolic activities in the marine environment is higher than the ones in the freshwater environment. Hence, the oxidation processes are higher in Okwori than Ikarama. This makes Okwori more aerobic than Ikarama and more energy is released in Okwori than Ikarama, aiding the greater degree of microbial degradation of petroleum hydrocarbons in Okwori compared to Ikarama.
The Niger Delta has an average annual temperature of approximately 28 0C, a range of 24 0C- 36 0C *. The optimal performance level of biodegradation of petroleum hydrocarbons in the marine environment and freshwater environment is reached in the range of 15 0C - 20 0C and 20 0C - 30 0C respectively. The temperature value favors the higher degree of biodegradation of petroleum hydrocarbons in Okwori contaminated sediments which has optimally taken place than in the Ikarama sample sediments. Okwori being an open marine environment is affected by the effect of temperature than Ikarama, a freshwater wetland surrounded by swamp forest to shield the direct impact of sunlight on the contaminated sediments. Consequently, the degree of biodegradation of petroleum hydrocarbons in Ikarama is limited.
*www.eoearth.org/view/article/15483
This study also confirms this effect, as a result of Okwori being a marine environment which is more saline than Ikarama, a freshwater environment. Thus, the degree of biodegradation of petroleum hydrocarbons in Okwori is greater than that in Ikarama.
Okwori, a marine environment has a higher energy than the more quiescent Ikarama, a freshwater environment. The constant water wave actions on the contaminated sediments in Okwori enhance the solubility, emulsification, and bioavailability of petroleum hydrocarbons in the sediments and thereby make it easier for the microbial population to access the contaminants.
The biodegradation of petroleum hydrocarbons in aquatic environments is affected mainly by nutrients like nitrogen and phosphorus. Unlike Ikarama, a freshwater environment full of vegetation competing for the absorption of nitrogen and phosphorus as growth nutrients, Okwori environment does not have vegetation to compete with microorganisms in the consumption of the readily available nitrogen and phosphorus.
Therefore, based on this study, it may be concluded that the degree of biodegradation of hydrocarbon contaminants in the marine environment is higher than it is in a freshwater environment. This study also shows high level of contamination in the hydrocarbon impacted areas. Most of the concentrations of PAHs in the contaminated sediment are found to be present in the environments beyond the recommended limits.
REFERENCES
Abu, G.O. and Dike, P.O. (2008). A study of natural attenuation process involved in a microcosm model of a crude oil-impacted wetland sediment in the Niger delta. Biol. Technol. 4761-4767
Adati, A.K., (2012). Oil exploration and spillage in Niger delta of Nigeria. Civil. Environ. Res., 2, pp. 2222-2863
Adebusoye, S.A., Ilori, M.O., Amund, O.O., Teniola, O.D., and Olatope, S.O. (2007). Microbial degradation of petroleum hydrocarbons in a polluted tropical stream. World Journal of Microbiology and Biotechnology, 23, 8, pp. 1149-1159
Amund, O.O. and Nwokoye, N. (1993). Hydrocarbon potentials of yeast isolates from a polluted Lagoon. Journal of Scientific Research and Development, 1, pp. 65-68
Arata, C.M., Picou, J.S., Johnson, G.D. and McNally, T.S. (2000) coping with technological disaster: an application of the conservation of resources model to the Exxon Valdez oil spill. J. Trauma. Stress, 13, pp. 23-39
Asuquo, F.E. and Ewa-Oboho, I. (2004) Fish species used as biomarker for heavy metal and hydrocarbon contamination in Cross Rivers, Nigeria. …….. 24, pp.29-37
Atlas, R.M. (1975). Effects of temperature and crude oil composition on petroleum biodegradation. Journal of Applied Microbiology, 30, 3, pp. 396-403
Atlas, R.M. (1985). Effects of hydrocarbons on microorganisms and biodegradation in Arctic ecosystems, in Petroleum Effects in the Arctic Environments, F.R. Engellhardt, Ed., pp. 63-99, Elsevier, London, UK
Atlas, R.M. (1988). Microbiology- fundamentals and applications, 2nd ed., pp.352-353. Macmillan, New York, NY, USA
Atlas, R.M. (1992) Petroleum microbiology, in encyclopedia of microbiology, pp. 363-369 Bartha, R. and Bossert, I. (1984). The treatment and disposal of petroleum wastes, in Petroleum
Microbiology, R.M. Atlas, Ed., pp. 553-578, Macmillan, New York, NY, USA Beller, H.R., Grbic-Galic, D. and Reinhard, M. (1992) Microbial degradation toluene under
sulfate-reducing conditions and the influence of iron on the process. Applied Environmental Microbiology, 58, 786-793
Bertrand, J.C., Rambeloarisoa, E., Rontani, J.F., Giusti, G. and Mattei, G. (1983). Microbial degradation of crude oil in sea water in continuous culture. Biotechnology Letter, 5, pp. 567-572
Boehm, P.D. (2006). Polycyclic aromatic hydrocarbons (PAHs) In Environmental forensics: Contaminants Specific Guide. Chapter 15, pp. 314-337, Morrison, R.D. and Murphy B.L., Ed. San Diego, CA, Academic Press.
Bossert, I. and Bertha, R. (1984). The fate of petroleum in soil ecosystems, pp. 434-476 in R.M. Atlas (ed.), Petroleum Microbiology. Macmillan, New York, NY, USA
Brooijmans, R.J.W, Pastink, M.I. and Siezen, R.J. (2009). Hydrocarbon degrading bacteria: the oil-spill clean-up crew. Microbial Biotechnology, 2, 6, pp. 587-594
Brusseau, M.L. (1998). The impact of physical, chemical and biological factors on
Remediation: Scientific Bases and Practical Applications, R. Serra, Ed., pp. 81-98, C.I.P.A., S.R.I., Milan, Italy
Burd, H. and Ward, O.P. (1996). Bacterial degradation of polycyclic aromatic hydrocarbons on agar plate: the role of biosurfactants. Biotechnol. Tech, 10, 371-374
Carmichael, L.M. and Pfaender, F.K. (1997). The effect of inorganic and organic supplements on the microbial degradation phenanthrene and pyrene in soils. Biodegradation, 8, 1, pp. 1-13
Cerniglia, C.E. (1984). Microbial transformation of aromatic hydrocarbons, pp. 99-128, in R.M. Atlas Ed., Petroleum Microbiology, Macmillan, New York , NY, USA
Cerniglia, C.E. (1992) Biodegradation of polycyclic aromatic hydrocarbons. Biodegradation, 3, pp. 351-368
Choi, S.C., Kwon, K.K., Sohn, J.H., and Kim, S.J. (2002). Evaluation of fertilizer additions to stimulate oil biodegrdation in sand sea shore mesocosms. Journal of Microbiology and Biotechnology, 2, 3, pp. 431-436
Chaillan, F., Chaineau, C.H., Point, V., Saliot, A., and Oudot, J. (2006). Factors inhibiting bioremediation of soil contaminated with weathered oils and drill cuttings.
Environmental Pollution, 144, 1, pp. 255-265
Chaineau, C.H., Rougeux, G., Yepremian, C. and Oudot, J. (2005). Effects of nutrient
concentration on the biodegradation of crude oil and associated microbial population in the soil. Soil Biology and Biochemistry, 37, 8, pp.1490-1497
Chikere, C.B. and Ekwuabu, C.B. (2014) Molecular characterization of autochthonous
Chikere, C.B., Okpokwasili, G.C. and Chikere, B.O. (2011). Monitoring of microbial hydrocarbon remediation in the soil. Biotech. 3, pp117-138
Chikere, C.B. Surridge, K., Okpokwasili, G.C. and Cloete, T.E. (2012). Dynamics of indigenous and bacterial communities associated with crude oil degradation in soil microcosm during nutrient enhanced bioremediation. Waste Manag. Res., 30, pp. 225-236
Coates, J.D., Anderson, R.T. and Lovley, D.R. (1996) anaerobic oxidation of polycyclic aromatic hydrocarbons under sulfate-reducing conditions. Applied Environmental Microbiology, 62, pp. 1099-1101
Collier, P., and Hoefler, A. (2005) Resource rents, governance and conflict. Journal of Conflict Resolution, Volume 49, 4, pp. 625-633
Cooney, J.J. (1984). The fate of petroleum pollutants in freshwater ecosystems, in Petroleum Microbiology, R.M. Atlas, Ed., pp. 399-434, Macmillan, New York , NY, USA
Cooney, J.J., Silver, S.A., and Beck, E.A. (1985). Factors influencing hydrocarbon degradation in three freshwater lakes. Microbial Ecology, 11, 2, pp. 413-416
Daniel, L.A. and Braide, S.A. (2002) the impact of accidental oil spill on cultivated and natural vegetation in a wetland area of Niger delta, Nigeria. J. Hum. Environ. 31, pp. 441-442 Delille, D., Coulon, F. and Pelletier, E. (2004). Effects of temperature warming during a
bioremediation study of natural and nutrient-amended hydrocarbon-contaminated sub-Antarctic soils. Cold Regions Science and Technology, 40, 1-2, pp. 61-70
EPA Method 8275A (Semi-volatile Organic Compounds PAHs and Polychlorinated biphenyl (PCBs) in Soils/Sludge and Solid Wastes Using Thermal Extraction/Gas Chromatography/Mass Spectrometry).
Fagbote E.O. and Olanipekun E.O. (2010) Levels of polycyclic aromatic hydrocarbons and polychlorinated biphenyls in sediment of bitumen deposit impacted area. Int. J. Environ.Sci Tech., 7(3), 561-570
Federal Ministry of Environment, Abuja. (2006). Nigerian Conservation Foundation Lagos, WWF UK and CEESP-IUCN
Fedorak, P.M. and Westlake, D.W.S. (1981). Microbial degradation of aromatics and saturates in Prudhoe Bay crude oil as determined by glass capillary gas chromatography. Canadian Journal of Microbiology, 27, pp.432-443
Floodgate, G. (1984). The fate of petroleum in marine ecosystem, in Petroleum Microbiology, R.M. Atlas, Ed., pp. 355-398, Macmillan, New York , NY, USA
Foght, J.M., Westlake, D.W.S., Johnson, W.M. and Ridgway, H.F. (1996). Environmental gasoline-utilizing isolates of Pseudomonia aeruginosa are taxonomically
indistinguishable by chemotaxonomic and molecular techniques. Microbiology, 142, 9, pp. 2333-2340
Fusey, P. and Oudot, J. (1984). Relative influence of physical removal and biodegradation in the depuration of petroleum contaminated seashore sediments. Marine Pollution Bulletin, 15, pp. 136-141
Hambrick, G.A., III, DeLaune, R.D., and Patrick, Jr., W.H. (1980). Effect of estuarine sediments pH and oxidation on microbial hydrocarbon degradation. Applied Environmental
Microbiology, 40, pp. 365-369
Holloway, S.L., Faw, G.M., and Sizemore, R.K. (1980). The bacterial community decomposition of an active oil field in the Gulf of Mexico. Marine Pollution Bulletin, 11, 6, pp. 153-156 Horowitz, A. and Atlas, R.M. (1977). Continuous open flow through system as a model for
degradation in the Arctic Ocean. Applied Environmental Microbiology, 33, pp. 647-653 Howard, K., Horsfall, M., Spiff, I.A. and Tene, S.C. (2006) Heavy metal levels in surface waters
and sediments in an oil field in the Niger delta. Global J. Pure Appl. Sci., 12, pp. 79 Jobson, A., Cook, F.D., and Westlake, W.S. (1972). Microbial Utilization of crude oil. Applied
Microbiology, 23, pp.1082-1089
Jamison, V.M., Raymond, R.L. and Hudson, Jr., J.O. (1975). Biodegradation of high-octane gasoline in groundwater. Dev. Ind. Microbiol. , 16, pp. 305-312
Jones, D.M., Douglas, A.G., Parkes, R.J., Taylor, J., Giger, W. and Schaffner, C. (1983). The recognition of biodegraded petroleum-derived aromatic hydrocarbons in recent marine sediments. Marine Pollution Bulletin, 14, 3, pp. 103-108
Jones, J., Knight, M. and Bryon, J.A. (1970). Effect of gross population by kerosene hydrocarbons on the microflora of a moorland soil. Nature, 227, pp. 1166, 1170
Ijah, U.J.J. (1998) Studies on relative compatibility of bacteria and yeast isolated from tropical soil in degrading crude oil. Waste Management, 18, pp. 293-299
Kakulu, S.E. and Osibanjo, O. (1992) pollution studies of Nigerian rivers: trace metal levels of surface waters in the Niger delta area. Int. J. Environ. Stud., 41, pp. 287-292
Kerr, R.P. and Capone, D.G. (1988). The effect of salinity on the microbial mineralization of two polycyclic aromatic hydrocarbons in estuarine sediments. Marine Environmental
Research, 26, pp181-198
Kim, S.J., Choi, H.D., Sim, D.S., and Oh, Y.S. (2005). Evaluation of bioremediation effectiveness on crude oil-contaminated sand. Chemosphere, 59, 6, pp. 845-852
Kirby, M.F. and Law, R.J. (2010) Accidental spills at sea- Risk, impact, mitigation and the need for coordinated post incident monitoring. Marine Pollution Bulletin, 60, pp. 797-803 Kvenvolden, K.A. and Cooper, C.K. (2003). Natural seepage of crude oil into marine
environment. Geo-Marine Letters, 23, 3-4, pp. 140-146, 2003.
Lal, B. and Khanna, S. (1996). Degradation of crude oil by Acinetobacter calcoaceticus and Alcaligenes odorans. Journal of Bacteriology, 81, 4, pp. 355-362
Leah, J.G. and Colwell, R.R. (1990). Microbial degradation of hydrocarbons in the environment. Microbiol. Rev., 146, pp.305-315
Lovley, D.R., Woodward, J.C., and Chapelle, F.H. (1994) stimulated anoxic biodegradation of aromatic hydrocarbons using Fe (III) ligands. Nature, 370, pp. 128-131
Mitchell, J., Morita, K., Selley, N., and Stern, J. (2001) the new economy of oil: impacts on business, geopolitics and society. Royal Institute of International Affairs/Earthscan, London
Mulkins, G.J., Philips, and Stewart, J.E. (1974). Distribution of hydrocarbon utilizing bacterial in Nortwestren Atlantic waters and coastal sediments. Canadian Journal of Microbiology, 20, 7, pp. 955-962
National Academy of Sciences. (1985). Oil in the sea- input, fates, and effects. National Academy Press, Washington, D.C.
Nkpaa, K.W. Wegwu, M.O. and Essien, E.B. (2013) Assessment of polycyclic aromatic
hydrocarbons levels in two commercially important fish species from crude oil polluted waters of Ogoniland and their carcinogenic health risk. Journal of Environment and Earth science, 3, vol.8, pp. 128-137
Nwilo, P.C. and Badejo, O.T. (2005) oil spill problems and management in the Niger delta. International Oil Spill Conference, Miami, Florida, U.S.A.
Oolman, T., Casttaldi, F.J., Behrens, G.P. and Owen, M.L. (1992). Biotreatment oily refinery waste. Hydrocarbon Process August: 67-69
Oudot, J., Merlin, F.X., and Pinvidic, P. (1998). Weathering rates of oil components in a bioremediation experiment in estuarine sediments. Marine Environmental Research, 45, 2, pp. 113-125,
Palinkas, L.A., Petterson, J.S., Russell, J. and Downs, M.A. (1993) Community pattern of psychiatric disorders after the Exxon Valdez oil spill. Hum. Organ. , 52, pp. 1-13 Pelletier, E., Delille, D., and Delille, B. (2004). Crude oil bioremediation in sub-Antarctic
intertidal sediments: chemistry and toxicity of oiled residues. Marine Environmental Research, 57, 4, pp. 311-327
Perry, J.J. (1984). Microbial metabolism of cyclic alkanes, in Petroleum Microbiology, R.M. Atlas, Ed., pp.61-98, Macmillan, New York, NY, USA
Pinholt, Y., Struwe, S. and Kjoller, A. (1979). Microbial changes during oil decomposition in soil. Holarctic Ecology, 2, pp. 195-200
Prince, R.C. (1993). Petroleum spill bioremediation in marine environments. Crit. Rev. Microbiol., 19, pp. 217-242
Rabus, R and Widdel, F. (1995) anaerobic degradation of ethylbenzene and other aromatic hydrocarbons y new denitrifying bacteria. Arch. Microbiol., 163, pp.96-103
Rahman, K.S.M., Rahman, T.J., Kourkoutas, Y, Petsas, I., Marchant, R. and Banat, M. (2003). Enhanced bioremediation of n-alkane in petroleum sludge using bacterial consortium amended with rhamnolipid and micronutrients. Bioresource Technology, 90, 2, pp. 159-168
Rocher, V., Azimi, S., Moileron, R and Chebbo, G. (2004). Hydrocarbon and heavy metals in the different sewer deposits in the “Le Marais” catchment, Paris, France: Stocks,
distributions and origins. Sci. Total Environ., 323, pp. 107-122
Rontani, J.F., Bosser-julak, F., Rambeloarisoa, E., Bertrand, J.C., Giusti, G. and Faure, R. (1985). Analytical study of Asthart crude oil asphaltenes biodegradation. Chemosphere, 14, pp. 1413-1422
Rueter, P., Rabus, R., Wilkes, H., Auckersberg, F., Rainey, F.A., Jannasch, H.W. and Widdel, F. (1994) anaerobic oxidation of hydrocarbons in crude oil by new types of sulfate-reducing bacteria. Nature, 372, 455-458
Sammarco, P.W., Kolian, S.R., Warby, R.A.F., Bouldin, J.L., Subra, W.A. and Porter, S.A. (2013) Distribution and concentrations of petroleum hydrocarbons associated with the BP/Deepwater Horizon oil spill, Gulf of Mexico. Mar. Pollut. Bull., 73, pp. 129-143 Shiaris, M.P. (1989). Seasonal biotransformation of naphthalene, phenanthrenes and
benzo(a)pyrene in surficial estuarine sediments. Applied Environmental Microbiology, 55, pp. 1391-1399
Singer, M.E and Finnerty, W.R. (1984). Microbial metabolism of straight-chain and branched alkanes, pp.1-60, in R.M. Atlas (ed.), Petroleum Microbiology. Macmillan, New York, NY, USA
Singh, M. and Dasai, J.D. (1986). Uptake of water insoluble substrates by microorganisms. J. Sci. Ind. Res. 45, pp413-417
Tippee, B. (1999). International petroleum encyclopedia. Penn-Well, Tulsa, Oklahoma.
United Nations Environment Program (2011) Environmental assessment of Ogoniland. Available http://www.unep.org Accessed Nov. 24, 2014
National Oil Spill Detection and Response Agency (NOSDRA) statements in Nigerian Vanguard Newspaper, 04/02/2014. http://www.vanguard.com/2014/04/bayelsa-experiences-40-oil-spills-monthly.
Umeh, G.I. (2009) Impacts of petroleum hydrocarbons on fish communities of river Areba, Niger delta, southern Nigeria. Tropical Freshwater Biology, 18, vol. 1, pp.79-91
Venosa, A.D. and Zhu, X. (2003). Biodegradation of crude oil contaminating marine shorelines and freshwater wetlands. Spill Science and Technology Bulletin, 8, 2, pp. 163-178
Verstaete, W., Vanloocke, R., DeBorger, R. and Verlind, A. (1976). Modelling of the breakdown and the mobilization of hydrocarbons in unsaturated soil layres, pp.99-112 in J.M.
Sharpley and A.M. Kaplan (ed.), Proceedings of the 3rd International Biodegradation Symposium. Applied Science Publishers Ltd., London
Vincent, A.O., Felix, E., Weltimore, M.O., Ise-Iyamu, O.K., Daniel, E.E. (2011). Microbial degradation and its kinetics on crude oil polluted soil. Res. J. Chem. Sci., 1, 8-14 Von Wedel, R.J., Mosquera, J.F., Goldsmith, C.D., Hater, G.R., Wong, A., Fox, T.A., Hunt,
W.T., Paules, M.S., Quiros, J.M., and Wiegand, J.W. (1988). Bacterial biodegradation of petroleum hydrocarbons in groungwater: in situ augmented bioreclamation with
enrichment isolates in California. Water Sci. Technol., 20, pp. 501-503
Walker, J.D., Colwell, R.R., Vaituzis, Z. and Meyer, S.A. (1975). Petroleum degrading achlorophyllous alga Prototheca zopfii. Nature, 254, 5499, pp. 423-424
Ward, D.M. and Brock, T.D. (1978). Hydrocarbons biodegradation in hypersaline environments. Applied Environmental Microbiology, 35, pp. 353-359
www.eoearth.org/view/article/15483
Appendix First Measurement Compounds Conc. In Ikarama Water Sample mg/Kg
decane 0.01
Undecane 0.02
Dodecane ND
Tridecane 0.32
Tetradecane 2.58 Pentadecane 1.98
Hexadecane 3.00
Heptdecane 7.40
Octadecane 3.80
Nonadecane ND
Eicosane 1.57
Heneicosane 1.04
Docosane 1.14
Tricosane 1.55
Tetracosane 2.39 Pentacosane 2.12
Hexacosane 1.38
Heptacosane 1.48
Octacosane 1.14
Second Measurement
Decane 0.655
Undecane 1.429
Dodecane ND
Tridecane 19.024
Tetradecane 153.649 Pentadecane 118.071 Hexadecane 178.601 Heptdecane 440.607 Octadecane 225.964 Nonadecane ND
Eicosane 93.196
Heneicosane 61.667
Docosane 68.095
Tricosane 92.000
Tetracosane 142.262 Pentacosane 126.190
Hexacosane 82.143
Heptacosane 88.095