Analysis and Accuracy Level Comparison Between
Capital Asset Pricing Model (CAPM) and Arbitrage
Pricing Theory (APT) In Determining the Expected
Return
Irni Yunita
Faculty of Economy and Business, Telkom University, Padjadjaran University
DOI: 10.29322/IJSRP.8.5.2018.p7761
http://dx.doi.org/10.29322/IJSRP.8.5.2018.p7761
Abstract- The objectives of this study are to determine the eligible stocks to be selected based on the CAPM and APT methods, to determine the accuracy level of expected return of the stock using Mean Absolut Deviation (MAD), and to compare the accuracy level of CAPM and APT methods. Based on the CAPM method, there are 18 eligible stocks to choose : AKRA, ADRO, BPRT, CTRA, ICBP, INCO, KLBF, LPPF, LSIP, MYRX, PTBA, PTPP, PWON, TPIA, UNTR, UNVR, WSKT, TLKM. Based on APT method, there are 16 selected stocks: AKRA, ADRO, BPRT, CTRA, ICBP, INCO, LPPF, MYRX, PTBA, PTPP, PWON, TPIA, UNTR, UNVR, WSKT TLKM. MAD APT method is more accurate than MAD CAPM in determining the expected return. The comparative result shows that there is no significant difference between the accuracy of CAPM and APT methods in estimating the stock return of the company in Jakarta Islamic Index.
Index Terms- Capital Asset Pricing Model, Arbitrage Pricing Theory,Mean absolut Deviation, Jakarta Islamic Index
I. INTRODUCTION
nvestments can be made both on real and financial assets. One of investment types in financial assets is investing in stocks. Stock is a form of the company ownership. Investment is related to the return and risk of an asset. The investor requires the capability to estimate the rate of return to assist in stock selection. In determining the expected rate of return, there are two estimation models that can be used: Capital Asset Pricing Model (CAPM) and Arbitrage Pricing Model (APT).
CAPM was firstly introduced by William Sharpe, John Litner and Jan Mossin in 1964 [1]. This method determines the expected rate of return based on the systematic risk of stocks i.e. beta stock. Meanwhile, APT was firstly introduced by Stephen A. Ross in 1976 [1]. This method determines the expected rate of return based on a lot of factors other than market.
In determining the accuracy level of stock return prediction using CAPM and APT, there are several measurements that can be used; one of them is Mean Absolut Deviation (MAD). MAD is a sum of prediction errors regardless of the algebraic marks divided by the number of observed data [2]. Some researches use
MAD method in determining the accuracy of CAPM and APT in predicting stock returns. [3] show that there is a small difference between MAD CAPM and APT and the results show that there is no significant difference between estimation results using CAPM and APT methods. The results have also shown that MAD APT is smaller than MAD CAPM; in other words, it is more accurate in predicting stock returns. In the contrary, [4] shows that CAPM is the most accurate method in predicting stock returns because it has a smaller MAD value compared to MAD APT.
The differences found in the result of these studies became the basis of this research to test the accuracy of CAPM and APT models in predicting stock returns in the Jakarta Islamic Index (JII). The Jakarta Islamic Index is an index at the Indonesia Stock Exchange which consists of stocks that meet the sharia criteria. One of the criteria of Islamic stock is that the shares are issued by the companies whose business activities are engaged in halal fields [5].
II. LITERATUREREVIEW
2.1 Capital Asset Pricing Model (CAPM)
Capital Asset Pricing Model (CAPM) is a model of the relationship between the rate of return and risk of an asset based on the systematic risk i.e. beta that cannot be diversified. [6] states that investors will focus more on undiversifiable risk in an effort to
Where:
minimize the risk at a certain rate of return. For individual stocks, the model of the relationship between rate of return and risk is indicated by Securities Market Line (SML) [7]. SML shows the relationship between covariance and expected return [8]. The equation of CAPM model is shown in the following model [7]:
E(Ri) = Rf+ βi [(E (Rm ) - Rf)] Where:
E(Ri) = Expected Return Saham Rf = Risk Free Return E(Rm) = Market Expected Return
β1 = stock return’s sensitivity of stock–i to market return
2.2 Arbitrage Pricing Theory (APT)
Arbitrage Pricing Theory (APT) was introduced by Stephen A. Ross in 1976. The Arbitrage Approach states that the expected return of an asset is not determined by one single variable (market mean and variance) but it is determined by various macroeconomic factors and the change sensitivity of each factor [1]. [9] states that in Arbitrage Pricing Theory, the expected return of a securities is determined by multifactor/index from other sources of risk. APT model can provide a more accurate expected return value and will not lead to arbitrate [1]. Equation of APT model is indicated by linear function against the following factors [1]:
Ri = Rf+ β1 (R1-Rf) + β2 (R2-Rf) + … + βn (Rn-Rf)
Ri = Expected Return of Stock
Rf = Risk Free Return
Ri-n = Expected Return of factors that affecting stocks
βin = Return sensitivity of stock I to stock n to the factors that influence it.
2.3 Mean Absolute Deviation (MAD)
Mean Absolute Deviation is a measure of overall forecasting errors for a model [10]. The MAD value is calculated by taking the sum of the absolute values of each forecasting error divided by the number of data periods (n) [10]:
MAD =
III. METHODOLOGY
The population of this research are all stocks listed in the Indonesia Stock Exchange. Meanwhile, the research samples are stocks registered in Jakarta Islamic Index year 2018 which have the completeness of the data in March 2014 to March 2018. This research is using secondary data that obtained through the website www.yahoofinance.com and www.bi.go.id. The data period used is monthly data for the last 4 years i.e. from March 2014 to March 2018: Adaro Energy Tbk (ADRO), AKR Corporindo Tbk (AKRA), Aneka Tambang (Persero) Tbk (ANTM), Astra International Tbk (ASII), Barito Pacific Tbk
(BRTP), Bumi Serpong Damai Tbk (BSDE), Ciputra Development Tbk (CTRA), XL Axiata Tbk (EXCL), Indofood CBP Sukses Makmur Tbk (ICBP), Vale Indonesia Tbk (INCO), Indofood Sukses Makmur Tbk (INDF), Kalbe Farma Tbk (KLBF), Lippo Karawaci Tbk (LPKR), Matahari Department Store Tbk (LPPF), PP London Sumatra Indonesia Tbk (LSIP), Hanson International Tbk (MYRX), Perusahaan Gas Negara (Persero) Tbk (PGAS), Tambang Batubara Bukit Asam (Persero) Tbk (PTBA), PP (Persero) Tbk (PTPP), Pakuwon Jati Tbk (PWON), Surya Citra Media Tbk (SCMA), Semen Indonesia (Persero) Tbk (SMGR), Summarecon Agung Tbk (SMRA), Telekomunikasi Indonesia (Persero) Tbk (TLKM), Chandra Asri Petrochemical Tbk (TPIA), United Tractors Tbk (UNTR), Unilever Indonesia Tbk (UNVR), Wijaya Karya (Persero) Tbk (WIKA) dan Waskita Karya (Persero) Tbk (WSKT). The factors that is used in APT Model is Inflation, Exchange Rate, Composite Stock Exchange Price Index and BI Rate.
3.1 Research Steps
A. Calculating Stock Expected Return by using CAPM model: E(Ri) = Rf + βi [(E (Rm ) - Rf)]
B. Calculating Stock Expected Return by using APT model: Ri = Rf + β1 (R1-Rf) + β2 (R2-Rf) + … + βn (Rn-Rf) C. Calculating Mean Absolute Deviation (MAD) :
MAD =
D. Calculating the difference between CAPM and APT by using Independent Sample t-Test
The objective of this testing is to determine whether there are differences in average (mean) between two populations to see the average of two samples [11].
The hypotheses of this research are as follows [11]:
H0 = The average of expected return in CAPM and APT is the same.
H1 = The average of expected return in CAPM and APT is different.
The basis for decision making is as follows: • If the probability is > 0.05, H0 is accepted If the probability is < 0.05, H0 is rejected
[image:2.612.74.537.627.733.2]IV. RESULTSANDDISCUSSION
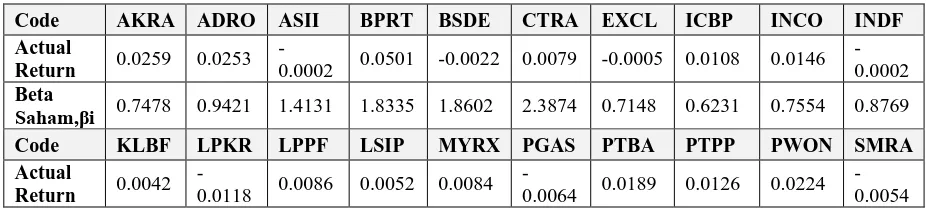
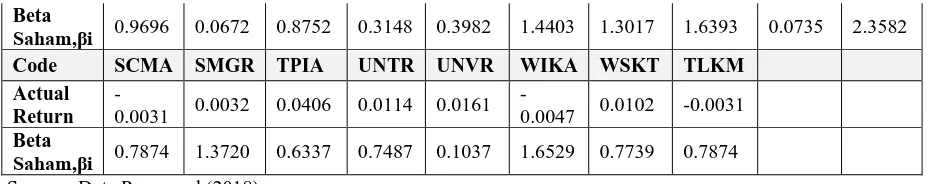
Table 4.1 Actual Return and Stock Beta
Code AKRA ADRO ASII BPRT BSDE CTRA EXCL ICBP INCO INDF Actual
Return 0.0259 0.0253
-0.0002 0.0501 -0.0022 0.0079 -0.0005 0.0108 0.0146 -0.0002 Beta
Saham,βi 0.7478 0.9421 1.4131 1.8335 1.8602 2.3874 0.7148 0.6231 0.7554 0.8769
Code KLBF LPKR LPPF LSIP MYRX PGAS PTBA PTPP PWON SMRA Actual
Return 0.0042
-0.0118 0.0086 0.0052 0.0084
Beta
Saham,βi 0.9696 0.0672 0.8752 0.3148 0.3982 1.4403 1.3017 1.6393 0.0735 2.3582
Code SCMA SMGR TPIA UNTR UNVR WIKA WSKT TLKM Actual
Return
-0.0031 0.0032 0.0406 0.0114 0.0161
-0.0047 0.0102 -0.0031 Beta
Saham,βi 0.7874 1.3720 0.6337 0.7487 0.1037 1.6529 0.7739 0.7874
Source : Data Processed (2018)
Table 4.1 shows the actual return value i.e. between -0.0118 up to 0.0501. The highest actual return value is BPRT stock while the lowest actual return is LPKR stock. The beta company stocks are between 0.0672 and 2.387. The greater the
[image:3.612.75.543.56.148.2]value of the beta stock, the more sensitive the stock is to market changes. The lowest beta value is LPKR stock while the highest beta value is CTRA stock.
Table 4.2 Expected Return Capital Asset Pricing Model (CAPM)
No. Code Actual return αi βi E(Rm) Rf
(RBIrate) E(Ri) CAPM
1 AKRA 0.0259 0.02 0.7478 0.0041 0.0065 0.0047
2 ADRO 0.0253 0.02 0.9421 0.0041 0.0065 0.0042
3 ASII -0.0002 -0.01 1.4131 0.0041 0.0065 0.0031
4 BPRT 0.0501 0.04 1.8335 0.0041 0.0065 0.0020
5 BSDE -0.0022 -0.01 1.8602 0.0041 0.0065 0.0020
6 CTRA 0.0079 0.00 2.3874 0.0041 0.0065 0.0007
7 EXCL -0.0005 0.00 0.7148 0.0041 0.0065 0.0048
8 ICBP 0.0108 0.01 0.6231 0.0041 0.0065 0.0050
9 INCO 0.0146 0.01 0.7554 0.0041 0.0065 0.0047
10 INDF -0.0002 0.00 0.8769 0.0041 0.0065 0.0044
11 KLBF 0.0042 0.00 0.9696 0.0041 0.0065 0.0041
12 LPKR -0.0118 -0.01 0.0672 0.0041 0.0065 0.0063
13 LPPF 0.0086 0.00 0.8752 0.0041 0.0065 0.0044
14 LSIP 0.0052 0.00 0.3148 0.0041 0.0065 0.0057
15 MYRX 0.0084 0.01 0.3982 0.0041 0.0065 0.0055
16 PGAS -0.0064 -0.01 1.4403 0.0041 0.0065 0.0030
17 PTBA 0.0189 0.01 1.3017 0.0041 0.0065 0.0033
18 PTPP 0.0126 0.01 1.6393 0.0041 0.0065 0.0025
19 PWON 0.0224 0.02 0.0735 0.0041 0.0065 0.0063
20 SMRA -0.0054 -0.02 2.3582 0.0041 0.0065 0.0008
21 SCMA -0.0031 -0.01 0.7874 0.0041 0.0065 0.0046
22 SMGR 0.0032 0.00 1.3720 0.0041 0.0065 0.0032
23 TPIA 0.0406 0.04 0.6337 0.0041 0.0065 0.0050
24 UNTR 0.0114 0.01 0.7487 0.0041 0.0065 0.0047
25 UNVR 0.0161 0.02 0.1037 0.0041 0.0065 0.0062
26 WIKA -0.0047 -0.01 1.6529 0.0041 0.0065 0.0025
27 WSKT 0.0208 0.01 2.0249 0.0041 0.0065 0.0016
28 TLKM 0.0102 0.01 0.7739 0.0041 0.0065 0.0046
Table 4.2 shows that Rm and Rf values are derived from the average return value of Composite Stock Exchange Price Index and BI rate during the study period. The expected return value based on CAPM calculation is between 0.0007 and 0.0063. The highest expected return value of CAPM is PWON stock while the lowest expected return value is CTRA stock. There are 18 stocks that have the actual return value > expected return
[image:4.612.24.590.172.724.2]CAPM i.e. AKRA, ADRO, BPRT, CTRA, ICBP, INCO, KLBF, LPPF, LSIP, MYRX, PTBA, PTPP, PWON, TPIA, UNTR, UNVR, WSKT, TLKM. These stocks are eligible stocks to be purchased under the CAPM method as the actual return value of the stock is greater than the expected return value under the CAPM.
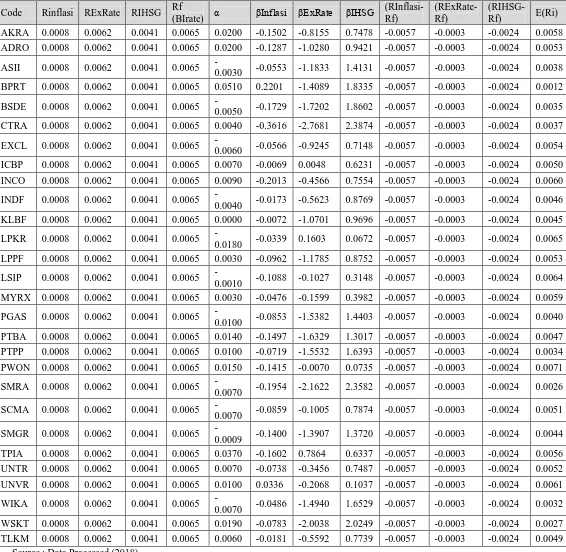
Table 4.3 Expected Return Arbitrage Pricing Theory (APT)
Code Rinflasi RExRate RIHSG Rf
(BIrate) α βInflasi βExRate βIHSG
(RInflasi-Rf)
(RExRate-Rf)
(RIHSG-Rf) E(Ri)
AKRA 0.0008 0.0062 0.0041 0.0065 0.0200 -0.1502 -0.8155 0.7478 -0.0057 -0.0003 -0.0024 0.0058 ADRO 0.0008 0.0062 0.0041 0.0065 0.0200 -0.1287 -1.0280 0.9421 -0.0057 -0.0003 -0.0024 0.0053
ASII 0.0008 0.0062 0.0041 0.0065
-0.0030 -0.0553 -1.1833 1.4131 -0.0057 -0.0003 -0.0024 0.0038
BPRT 0.0008 0.0062 0.0041 0.0065 0.0510 0.2201 -1.4089 1.8335 -0.0057 -0.0003 -0.0024 0.0012
BSDE 0.0008 0.0062 0.0041 0.0065
-0.0050 -0.1729 -1.7202 1.8602 -0.0057 -0.0003 -0.0024 0.0035 CTRA 0.0008 0.0062 0.0041 0.0065 0.0040 -0.3616 -2.7681 2.3874 -0.0057 -0.0003 -0.0024 0.0037
EXCL 0.0008 0.0062 0.0041 0.0065
-0.0060 -0.0566 -0.9245 0.7148 -0.0057 -0.0003 -0.0024 0.0054
ICBP 0.0008 0.0062 0.0041 0.0065 0.0070 -0.0069 0.0048 0.6231 -0.0057 -0.0003 -0.0024 0.0050
INCO 0.0008 0.0062 0.0041 0.0065 0.0090 -0.2013 -0.4566 0.7554 -0.0057 -0.0003 -0.0024 0.0060
INDF 0.0008 0.0062 0.0041 0.0065
-0.0040 -0.0173 -0.5623 0.8769 -0.0057 -0.0003 -0.0024 0.0046 KLBF 0.0008 0.0062 0.0041 0.0065 0.0000 -0.0072 -1.0701 0.9696 -0.0057 -0.0003 -0.0024 0.0045
LPKR 0.0008 0.0062 0.0041 0.0065
-0.0180 -0.0339 0.1603 0.0672 -0.0057 -0.0003 -0.0024 0.0065 LPPF 0.0008 0.0062 0.0041 0.0065 0.0030 -0.0962 -1.1785 0.8752 -0.0057 -0.0003 -0.0024 0.0053
LSIP 0.0008 0.0062 0.0041 0.0065
-0.0010 -0.1088 -0.1027 0.3148 -0.0057 -0.0003 -0.0024 0.0064 MYRX 0.0008 0.0062 0.0041 0.0065 0.0030 -0.0476 -0.1599 0.3982 -0.0057 -0.0003 -0.0024 0.0059
PGAS 0.0008 0.0062 0.0041 0.0065
-0.0100 -0.0853 -1.5382 1.4403 -0.0057 -0.0003 -0.0024 0.0040 PTBA 0.0008 0.0062 0.0041 0.0065 0.0140 -0.1497 -1.6329 1.3017 -0.0057 -0.0003 -0.0024 0.0047 PTPP 0.0008 0.0062 0.0041 0.0065 0.0100 -0.0719 -1.5532 1.6393 -0.0057 -0.0003 -0.0024 0.0034
PWON 0.0008 0.0062 0.0041 0.0065 0.0150 -0.1415 -0.0070 0.0735 -0.0057 -0.0003 -0.0024 0.0071
SMRA 0.0008 0.0062 0.0041 0.0065
-0.0070 -0.1954 -2.1622 2.3582 -0.0057 -0.0003 -0.0024 0.0026
SCMA 0.0008 0.0062 0.0041 0.0065
-0.0070 -0.0859 -0.1005 0.7874 -0.0057 -0.0003 -0.0024 0.0051
SMGR 0.0008 0.0062 0.0041 0.0065
-0.0009 -0.1400 -1.3907 1.3720 -0.0057 -0.0003 -0.0024 0.0044
TPIA 0.0008 0.0062 0.0041 0.0065 0.0370 -0.1602 0.7864 0.6337 -0.0057 -0.0003 -0.0024 0.0056
UNTR 0.0008 0.0062 0.0041 0.0065 0.0070 -0.0738 -0.3456 0.7487 -0.0057 -0.0003 -0.0024 0.0052
UNVR 0.0008 0.0062 0.0041 0.0065 0.0100 0.0336 -0.2068 0.1037 -0.0057 -0.0003 -0.0024 0.0061
WIKA 0.0008 0.0062 0.0041 0.0065
-0.0070 -0.0486 -1.4940 1.6529 -0.0057 -0.0003 -0.0024 0.0032 WSKT 0.0008 0.0062 0.0041 0.0065 0.0190 -0.0783 -2.0038 2.0249 -0.0057 -0.0003 -0.0024 0.0027 TLKM 0.0008 0.0062 0.0041 0.0065 0.0060 -0.0181 -0.5592 0.7739 -0.0057 -0.0003 -0.0024 0.0049
From Table 4.3, Ri (Inflation, exchange rate, Composite Stock Exchange Price Index and BI Rate) values were obtained from the average returns of each factor during the study period. The expected return value based on APT calculation is between 0.001245 and 0.007131. The highest expected return value in APT is PWON while the lowest expected return value in APT is BPRT. There are 16 stocks that have actual return value > expected returnin APT : AKRA, ADRO, BPRT, CTRA, ICBP, INCO, LPPF, MYRX, PTBA, PTPP, PWON, TPIA, UNTR,
UNVR, WSKT and TLKM. These stocks are eligible stocks to be purchased in APT method because the actual return value of the stocks is greater than the expected value in APT.
[image:5.612.89.527.190.667.2]From the calculation of expected return in CAPM and APT, there are 16 eligible stocks to be selected either based on CAPM and APT methods such as: AKRA, ADRO, BPRT, CTRA, ICBP, INCO, LPPF, MYRX, PTBA, PTPP, PWON, TPIA, UNTR, UNVR, WSKT TLKM. While KLBF and LSIP are chosen only based on APT method.
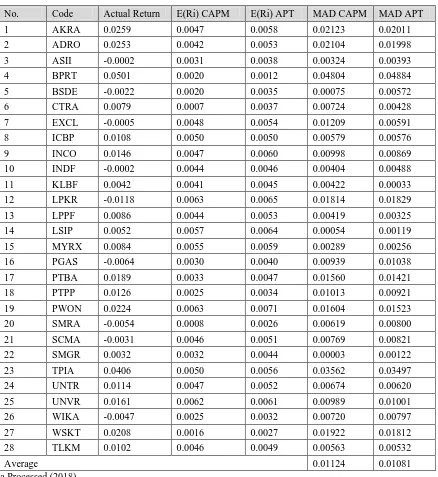
Table 4.4 Mean Absolut Deviation (MAD) CAPM and APT
No. Code Actual Return E(Ri) CAPM E(Ri) APT MAD CAPM MAD APT
1 AKRA 0.0259 0.0047 0.0058 0.02123 0.02011
2 ADRO 0.0253 0.0042 0.0053 0.02104 0.01998
3 ASII -0.0002 0.0031 0.0038 0.00324 0.00393
4 BPRT 0.0501 0.0020 0.0012 0.04804 0.04884
5 BSDE -0.0022 0.0020 0.0035 0.00075 0.00572
6 CTRA 0.0079 0.0007 0.0037 0.00724 0.00428
7 EXCL -0.0005 0.0048 0.0054 0.01209 0.00591
8 ICBP 0.0108 0.0050 0.0050 0.00579 0.00576
9 INCO 0.0146 0.0047 0.0060 0.00998 0.00869
10 INDF -0.0002 0.0044 0.0046 0.00404 0.00488
11 KLBF 0.0042 0.0041 0.0045 0.00422 0.00033
12 LPKR -0.0118 0.0063 0.0065 0.01814 0.01829
13 LPPF 0.0086 0.0044 0.0053 0.00419 0.00325
14 LSIP 0.0052 0.0057 0.0064 0.00054 0.00119
15 MYRX 0.0084 0.0055 0.0059 0.00289 0.00256
16 PGAS -0.0064 0.0030 0.0040 0.00939 0.01038
17 PTBA 0.0189 0.0033 0.0047 0.01560 0.01421
18 PTPP 0.0126 0.0025 0.0034 0.01013 0.00921
19 PWON 0.0224 0.0063 0.0071 0.01604 0.01523
20 SMRA -0.0054 0.0008 0.0026 0.00619 0.00800
21 SCMA -0.0031 0.0046 0.0051 0.00769 0.00821
22 SMGR 0.0032 0.0032 0.0044 0.00003 0.00122
23 TPIA 0.0406 0.0050 0.0056 0.03562 0.03497
24 UNTR 0.0114 0.0047 0.0052 0.00674 0.00620
25 UNVR 0.0161 0.0062 0.0061 0.00989 0.01001
26 WIKA -0.0047 0.0025 0.0032 0.00720 0.00797
27 WSKT 0.0208 0.0016 0.0027 0.01922 0.01812
28 TLKM 0.0102 0.0046 0.0049 0.00563 0.00532
Average 0.01124 0.01081
Sumber : Data Processed (2018)
From Table 4.4, MAD value based on the CAPM calculation is between 0.00003 and 0.04804. The highest MAD value in CAPM is BPRT stock while the lowest MAD value in CAPM is SMGR stock. MAD value based on APT calculation is between 0.00033 and 0.04884. The highest MAD value in APT
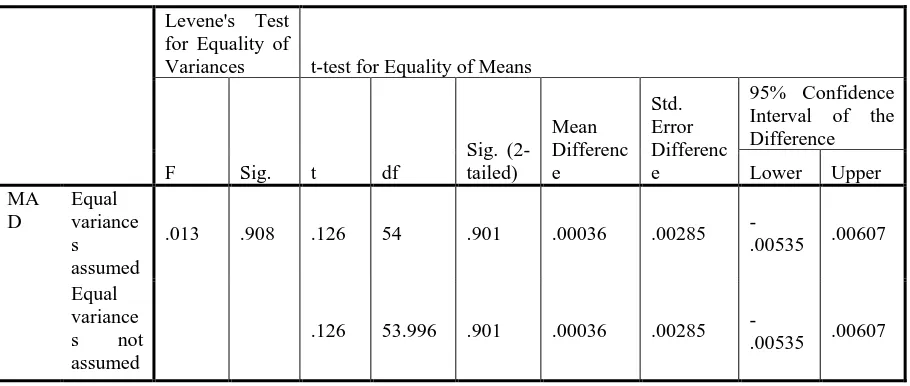
Table 4.5 Independen t-test result of MAD CAPM and MAD APT
Levene's Test for Equality of
Variances t-test for Equality of Means
F Sig. t df
Sig. (2-tailed)
Mean Differenc e
Std. Error Differenc e
95% Confidence Interval of the Difference
Lower Upper MA
D
Equal variance s assumed
.013 .908 .126 54 .901 .00036 .00285
-.00535 .00607
Equal variance s not assumed
.126 53.996 .901 .00036 .00285
-.00535 .00607
Source : Data Processed (2018)
From Table 4.5, it can be seen that the significance value (Sig. 2 tailed) is 0.901. This value is greater than P-Value (5%). Therefore, Ho is accepted and it can be concluded that there is no significant difference between the CAPM and APT models in estimating the expected return of stocks listed in the Jakarta Islamic Index.
V. CONCLUTIONANDRECOMENDATION
Based on the expected return value using CAPM method, there are 18 eligible stocks to be included in the investment portfolio : AKRA, ADRO, BPRT, CTRA, ICBP, INCO, KLBF, LPPF, LSIP, MYRX, PTBA, PTPP, PWON, TPIA, UNTR, UNVR, WSKT, TLKM. Based on APT Methode, there are 16 stocks to be included in the investment portfolio : AKRA, ADRO, BPRT, CTRA, ICBP, INCO, LPPF, MYRX, PTBA, PTPP, PWON, TPIA, UNTR, UNVR, WSKT TLKM.
The research result on the comparative test shows that there is no significant difference between the accuracy of CAPM and APT methods in estimating the stock return of the company in Jakarta Islamic Index for the March 2014-March 2018 period. Investors can estimate stock return using both CAPM and APT methods. However, the more accurate method referring to this research is APT method because it has higher accuracy rate than CAPM.
REFERENCES
[1] Zubir, Zalmi. 2011. Manajemen Portofolio:Penerapannya dalam Investasi Saham. Jakarta: Salemba Empat.
[2] Herjanto, Eddy. 1999. Manajemen Produksi dan Operasi. Edisi Kedua. Jakarta : PT. Gramedia Widiasarana Indonesia.
Ibrahim, M.Irfan, Titaley, Jullia and Manurung K. Tohap. 2017. Analsiis Keakuratan Capital Asset Pricing Model (CAPM) dan Arbitrase Pricing Theory (APT) dalam memprediksi Expected Saham pada LQ45. JdC, Vol 6. No.1. Maret 2017.
[3] Aqli, M. Irsyadul. 2015. Analisis Perbandingan Keakuratan Metode Capital Asset Pricing Model (CAPM) dan Arbitrase Pricing Theory (APT) dalam memprediksi return saham. Skripsi. Semarang. Universitas Islam Negeri Walisongo.
[4] Susanto, Burhanuddin. 2009. Pasar Modal Syariah (Tinjauan Hukum). Yogyakarta : UII Press Yogyakarta.
[5] Ahmad, Kamaruddin. 2004. Dasar-Dasar Manajemen Investasi dan Portofolio. Jakarta : PT. Rineka Cipta.
[6] Jogiyanto. Hartono. 2016. Teori Portofolio dan Analisis Investasi. Edisi kesepuluh. Yogyakarta: BPFE-Yogyakarta.
[7] Sharpe, William F., Alexander, Gordon J., Bailey, Jeffery V. 2005. Investasi. Edisi ke enam. Jilid 1. PT. Indeks Kelompok Gramedia.
[8] Tandelilin, Eduardus. 2017. Pasar Modal : Manajemen Portofolio & Investasi. Yogyakarta : PT. kanisius.
[9] Heizer, Rey dan ReinderBarry. 2009. Manajemen Operasi. Edisi Ke-9. Jakarta : Salemba Empat.
[10] Santoso, Singgih. 2017. Menguasai Statistik dengan SPSS 24. Jakarta: PT. ELex Media Komputindo.
AUTHORS