seismic attributes. That is why, the introduction to term, Poisson Impedance (PI), could be an effective way to cope with this issue. PI attributes which were used as an indicator, needing Acoustic Impedance (AI) and Shear Impedance (SI) as well as c factor (rotation optimization factor). The optimum c factor was obtained through TCCA method (Target Correlation Coefficient Analysis). In this study, it had been conducted a sensitivity test in term of separating lithology and fluid at three wells in ‘WA’ Field, South Sumatra Basin. Moreover, PI attributes modeling was done using simultaneous AVO inversion to extract AI and SI. The modeling result showed that gas saturated sandstone would be well separated from brine in low FI value, below -1000 ft/s*g/cc (-3.05*105 kg/m2s). Low FI anomaly at all modeling wells proved that all wells reviewed were gas wells distributed towards south-east. Fluid impedance was then used to image gas distribution.. On the other hand, AVO analysis was conducted in order to know the sensitivity of the existing seismic data on the presence of anomaly.
Keywords: poisson impedance, fluid impedance, TCCA, simultaneous AVO inversion.
INTRODUCTION
The Characterization of reservoir is a process to describe the qualitative and quantitative character of the reservoir use all the data measurement (sukmono, 2002). For characterization a reservoir we need a method to image the physical parameters of rocks which can gives the effect of that is caused the difference of lithology and fluid.The very important parameters to differentiate characteristic of fluid contained in medium is poisson ratio. One of this pparameter is elastic parameters of rocks to represent the physical characteristic that is the quantitative of kompressibilitas. Call as the Poisson Ratio of material.Poisson Ratio is the ratio of strain transverse to strain longitudinal. In addition, poisson ratio (𝜎) can also be expressed as a function of P wave velocity (vp) and S wave velocity (vs). Low value of the density andPoisson ratio on a sand stone reservoir usually indicated there is an anomaly (hydrocarbon). So both of this parameter could combined into single attribute namely poisson impedance attribute. This Attribute is one of physical parameters of rock that can be applied in practice to predict a reservoir and detect the existence of hydrocarbon. Poisson impedance is a solution to answer the difficulty in separate
Figure-1. Picture stratigrapher basin south Sumatra (ginger and fielding play, 2005).
MATERIALS AND METHODS
The research area was located at basin jambi, sub basin of south Sumatera. The Basin was a result of converge tectonic plates from subduction between indo-australia( plate ocean) with the Eurasian plates ( plate the continent ) .The subduction process caused the ocean plates infiltrate under the continental plates. If the infiltrate velocity of ocean plates bigger than the continent plate, part of continent can be experience the strain forces (tensional stress). The strain force along the subduction zone will be produce the normal fault as a graben series alongSumatraand Java islands, including the basin of south sumatera (Fitrianto, 2011). The stratigrafi of south sumatera shown in Figure-1. The history of the south sumatera basin can be divided into three tectonic megasequences (Ginger and Fielding, 2005.) as: 1. Syn-rift megasequence (40-29) million years ago. 2. Post Syn-rift megasequence (29 - 5) million years ago. 3. Syn-orogenic / inversion megasequence (5 million years ago -- now). Syn-rif is a sedimentary process the precipitate goes before or at the same time as the rifting (cracks). The Large objective extensional from the eocene to the initial oligocen were the crust of the continent in the west; sumatera as produce of subduction along the west sumatera trench. The events extension is leading to opening a number of half-grabens in this orientation and geometry that influenced by heterogeneity the bedrock. Rifting stoped about 29 million years ago. The sedimentation process which happened after cessation of rifting called post rift megasequence. At the basin, as sub-busin central Palembang, megasequence will reach thickness more than 13,000 ft. The velocity of subsidence and mean sea level advance relatively high result in prolonged transgresi on the basin reach the about 16
million to 5 millions ago call as regression The regression events the down level of sea water that can be uplift of the ground ~.
Figure-2. Map tectonics basin south Sumatra (http: / / en.wikibooks.org / wiki / file: Sumatra _ map.jpg).
This research used data seismic 3D with full stack volume and partial angle, mid stack and far stack. Full stack data was only used as input of the inversion process. In this research used 3wells data as the object of this research. This kind of data wereWA6 well, WA3and WA1well. While 6 another wells namely, WA2, WA4, WA5, WA7, WA11 AND WA13 Used as controller in inversion process.
The elasticity parameter of rocks
where:
tp = travel time in the rocks pore tf = travel time in fluida tm = travel time in matriks 𝜙 = porositasy
𝑣𝑃 = velocity of wave in the rocks pore 𝑣𝑓 = velocity of wave in fluida 𝑣𝑚 = velocity of in matriks
Furthermore, the density of a rock overall formed by a value the density of components authors’ rock that can be expressed in the equation as follow:
ρsat= ρm (1-ϕ) + ρw Swϕ+ ρhc (1-Sw)ϕ (3)
where
ρhc = density of hydrocarbon Sw =water saturation
ϕ = Porosity
When a rock saturate by water, then the third part of the equation ignored. And otherwise if rocks perfect saturate by hydrocarbon (oil or gas), then the second part of the equation ignored. While for rocks with small porosity, the value of density of rocks only depend on the density of the rock matrix (Fritz, 2008).
Poisson impedance
Poisson impedance is the seismic attribute obtained from the combination value of P impedance( AI) and S-impedansi (SI) and is an important indicator for identification the existence of good hydrocarbon. Poisson impedance derived from a log impedance P and impedance S or the volume of seismic attributes by using the simultaneous inversion poisson impedance volume is constructing as follow equation (Gerlitz, 2006)
PI = AI – cSI (4)
Where,
c = the optimal rotation parameter AI = Aqustic impedance (Vpx ρ) SI = Shear impedance (Vsx ρ) PI = Poisson impedance
toward recipients (receiver). Avo of pre-stack cdp gather data can be providing the basic information of lithology and fluid contained in the rocks. AVO appear as a consequence due the partition energy on the reflectors where some of energy was reflected and others was transmitted.When the wave propagate to the limits of the layers with angel not zero then the P waves convert to S wave. Amplitude of reflected and transmitted energy depend on the physical properties of the reflectors .As a consequence , the reflection coefficient as the functions of P waves velocity (vp), S waves velocity (vs), density 𝜌) and incidence angle of the seismic wave at the each stratum. The classifications of AVO depend on the response of top reservoir and contrast of acoustic impedance at the boundary of layer and the effect of interference. Avo classifications (amplitude versus offset) initiated by Rutherford and Williams. They classified AVO in three parts. 1. Sandstonesaturated by gas with high impedance (relative to rock flakes covering it up) The sandstone saturate with gas having high impedance (relative with the shale stone cover), 2. The rock with the very low contrasted impedance. 3. Sandstone gas saturate with low impedance. Seismic Inversion is defined as techniques geology modeling under surface of the ground using seismic data seismicas input and well log data as a controller. In this research using 3D seismic data full stack and partial data angle stack that is near angle, mid stack and far stack. Also used 3 wellsdata as the main object of research namely WA1, WA3 AND WA6 wells. While 6 another well namely WA2L, WA4, WA5, WA7, WA11 AND WA13 wells be used as inversion control. ~
RESULT AND DISCUSSIONS
Logs poisson impedance
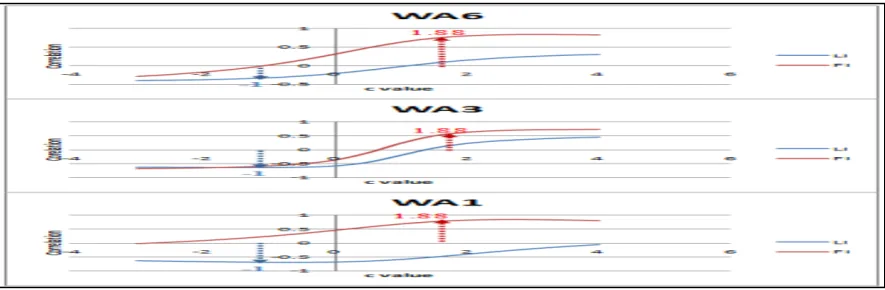
Figure-3. A curve correlation LI-GR and FI-PR at the wa6, wa3, and wa1 well.
Crossplot analysis for the separation of lithology The data used as input in the crossplot analysis is logs data in the form of LI logs (lithology impedance) and log target. Logs the target was defined as logs are sensitive
[image:4.595.92.507.325.445.2]to the separation of lithology, namely a log GR (Gamma Ray). Figure-3 show crossplot between LI and GR. The left side of the figure show results crossplot while the right side of show cross section.
Figure-4. Crossplot li-gr wa6 wells.
The Figure-4 indicated that the separation of the quite clear between sand ( zone yellow with flakes ( zone grays) on an axis LI.This is also shown in well other model r. Figure-2 is the correlation curve of LI-GR and figure in well wa6, wa3, and wa1, Figure-4 crossplot LI-GR wa6 well. But, in all three well research show scattered data and not included withzones lithology sand or flakes so as to cause ambiguity in separation lithology. Hence LI not processed further.
Crossplot analysis for the separation fluid ~
[image:4.595.88.511.587.702.2]Logs its input in order to crossplot separation fluid is an attribute PI ( impedance poisson ) in form of FI (fluid impedance) and log the target in the form of logs poisson ratio. Logs target chosen were logs are sensitive to fluid.
Figure-5. Crossplot fi-pr (brine-gas ) on wells wa6.
In Figure-4, indicated that zone red numbers zone sand tersaturasi gas (gas sands), zone blue show zone sand. While scale color shows the poisson ratio .Value cut off (dividing line) to log fi are -- 1000 ft / s * g / cc (-3.05
.
Figure-6.a . AVO at well WA6.
Figure-6.b. AVO at well W1.
Figure-6.c. AVO at well W3.
Simultaneous inversion and poisson impedance transformation (Pi)
Figure-6 and Figure-7 shows the results of seismic data inversion simultaneous in the form of a cross section AI and the SI. Both cross sections were put in making cross section fluid impedance (FI). The cut off on the outcome of inversion equal to cut off value data on the
Figure-7. Cross section of seismic ai.
Figure-8. Cross section of seismic si
Figure-9 shows the volume of Fluid Impedance is the result of the transformation of AI and SI using equation FI = AI- 1.88 * SI. Cross-section FI provides clearer color degradation. Green color to yellow shows the FI indicate low anomaly (gas sand). While red indicates as brine sand. The impermeable Rocks (flakes) indicated by the blue color to purple indicate the high value of FI. The value of cut off on the outcome of output inversion equal to the value of cut off of the wells data.
Figure-10. Cross section arbitrary line well WA1, WA 3 dan WA6.
The Figure-9, indicated that the hidrocarbon migration path of hidrocarbon (gas) follow with continuity of green color. In the figure also shown clearly alternating between sandstones and shale proving that in the experienced transgresi process. This is also shown on the output of slicing at every 5 ms of horizon UTAF.
The spread of gas at the research area
The Figure-10 shows the map of the spread of hydrocarbon (gas) at WA area. The color of the map showed the FI value. Figure-11 low FI. This result is consistent with data analysis of crossover anticlinedensitas-neutron and can become as a trap hydrocarbon...
Figure-11. The results of slicing average at the area of negative WA ~.
Figure-12. The map of the spreading gas at WAarea.
Figure-12 describe the map of the hydrocarbon spreadatWA area.The low value of FI at the map shows that the spread pattern of gas leads to south east (southeast) atWA area. This is in accordance with data analysis of welllog (crossover density of neutron) and supported by the presence of antiklin and the geological fault that can be trap the hydrocarbon.
CONCLUSIONS
a) The most sensitive Parameters for the separation of lithology and fluid is the poisson impedance (PI) attribute consist of fluid impedance (FI) and lithology impedance (LI). The optimum separation of fluid shown in attribute FI (fluid impedance) with the value of c = 1.88. While the optimum separation of lithology shown in attribute LI (Lithology Impedance) with the value of c = -1.LI cannot be processed further because there are many scattering data (spread) and inconsistent for all well log model.
b) Based on the results of slicing and the zone of spreading map of gas, show that for the low value of FI - equal or less than - 1000 ft / s * g / cc indicates the existence of gas anomaly sepread at all wells model andtheir distribution in the southeast direction .
REFERENCES
Bacon M., Simm R., Redshaw T. 2003. 3-D Seismic Interpretation. United Kingdom: Cambridge University Press.
Fitrianto Teguh. 2001. Pemodelan Rock Physicsdalam Karakterisasi Reservoar Menggunakan Impedansi Elastik untuk Memetakan Sebaran Reservoar dan Minyak pada Formasi Gumai di Lapangan Jura. Thesis. Universitas Indonesia: Depok.
Sukmono Sigit. 2009. Advance Seismic Methods for Field Explorationand Development. Jurusan Teknik Geofisika. Institut Teknologi Bandung.
Wibisono Erlangga. 2009. Analisis dan Inversi AVO Simultaneous UntukMengekstrak Sifat Fisika Batuan: Studi Kasus Batupasir Formasi Gumai pada Sub Cekungan Jambi. Skripsi.Universitas Indonesia: Jakarta.
Hanif. 2013. Karakterisasi Struktur Sesar Dan Rekahan Untuk Kompartementalisasi Reservoir Menggunakan Atribut Struktur 3D Di Lapangan ‘D’ Cekungan Sumatera Tengah, Skripsi S-1 Program Studi Teknik Geofisika Fakultas Teknik Pertambangan dan Perminyakan Institut Teknologi Bandung, Bandung.
Pireno G. E. 2008. Potensi Formasi Sirga Sebagai Batuan Induk Di Cekungan Salawati Papua, Skripsi S-1 Program Studi Teknik Geofisika Fakultas Teknik Pertambangan dan Perminyakan Institut Teknologi Bandung, Bandung.