0095-1137/08/$08.00
⫹
0
doi:10.1128/JCM.00081-08
Copyright © 2008, American Society for Microbiology. All Rights Reserved.
Multiplex PCR and Oligonucleotide Microarray for Detection of
Single-Nucleotide Polymorphisms Associated with
Plasmodium falciparum
Drug Resistance
䌤
†
Guo Qing Zhang,
1Ya Yi Guan,
1Hai Hui Sheng,
2Bin Zheng,
1Song Wu,
1Hua Sheng Xiao,
2and Lin Hua Tang
1*
National Institute of Parasitic Diseases, Chinese Center for Disease Control and Prevention, WHO Collaborating Center for
Malaria, Schistosomiasis, and Filariasis, 207 Rui Jin Er Road, Shanghai 200025, China,
1and
National Engineering Center for Biochip at Shanghai, 151 Li Bing Road,
Pudong, Shanghai 201203, China
2Received 31 December 2007/Returned for modification 14 March 2008/Accepted 17 April 2008
Drug resistance in
Plasmodium falciparum
is a serious public health threat in the countries where this
organism is endemic. Since resistance has been associated with specific single-nucleotide polymorphisms
(SNPs) in parasite genes, molecular markers are becoming useful surrogates for monitoring the emergence and
dispersion of drug resistance. In this study, a multiplex PCR (mPCR) and oligonucleotide microarray method
was developed for the detection of these SNPs in genes encoding chloroquine resistance transporter (Pf
crt
),
multidrug resistance 1 (Pf
mdr1
), dihydrofolate reductase (Pf
dhfr
), dihydropteroate synthetase (Pf
dhps
), and
ATPase 6 (Pf
ATPase6
) of
P. falciparum
. The results show that DNA microarray technology, combined with
mPCR, is a promising and time-saving tool that supports conventional detection methods, allowing sensitive,
accurate, simultaneous analysis of the SNPs associated with drug resistance in
P. falciparum
.
Malaria is still one of the most serious public health
prob-lems in the world; more than one million people worldwide die
from it every year (35). This trouble is largely caused by the
resistance of
Plasmodium falciparum
to most antimalarial
drugs currently used, including chloroquine (CQ),
sulfadoxine-pyrimethamine (SP), mefloquine (MQ), amodiaquine (AQ),
and lumefantrine (LUM); furthermore, reduced susceptibility
of
P. falciparum
to artemisinin and its derivatives has been also
reported (15, 16, 34).
Antimalarial drug resistance has been associated with
single-nucleotide polymorphisms (SNPs), in particular
P. falciparum
genes. The
P. falciparum
CQ resistance transporter (Pf
crt
)
gene K76T mutation has been linked to CQ and possibly AQ
resistance (6, 17, 20); the
P. falciparum
multidrug resistance 1
(Pf
mdr1
) gene N86Y mutation has been associated with the
response of the parasite to amino quinolines such as MQ (9,
25, 27) and LUM (26); mutations N51I, C59R, S108N/T, and
I164L in the
P. falciparum
dihydrofolate reductase (Pf
dhfr
)
gene have been associated with resistance to pyrimethamine
(13, 14, 19, 21, 22); mutations S436A, A437G, K540E,
A581G, and A613 S/T in the
P. falciparum
dihydropteroate
synthetase (Pf
dhps
) gene have been shown to confer
resis-tance to sulfadoxine (13, 14, 21, 22); and
P. falciparum
ATPase-6 (Pf
ATPase6
) S769N mutation has been associated
with increased 50% inhibitory concentrations of artemether
(11, 16, 18). These SNPs are believed to represent molecular
epidemiology surveillance tools of antimalarial drug resistance,
which can complement the more conventional and logistically
complex in vitro or in vivo test (7, 24, 33, 34).
Existing molecular methods for analysis of these SNPs
in-clude allele-specific PCR, PCR-restriction fragment length
polymorphism (RFLP) analysis, multiplex PCR
(mPCR)-RFLP, DNA sequencing, dot blot hybridization techniques,
the molecular beacon method, real-time PCR,
PCR–enzyme-linked immunosorbent assay, and pyrosequencing (1, 2, 6, 8,
10, 28, 31, 37, 38). Each of these techniques offers its own
advantages and limitations. Among the techniques,
PCR-RFLP protocols constitute the most common methodological
approach for the analyses of these SNPs, but this approach is
laborious and time-consuming. A rapid and high-throughput
genotyping method would be ideal for large-scale
population-based studies.
The oligonucleotide microarray technology, also known as
DNA chip, has provided an incredible technical
develop-ment in rapid, large-scale, and automatic analysis of SNPs
(5, 36). Briefly, the principle of oligonucleotide microarray
is based on reverse Southern hybridization on a glass or
silicon substrate. The fluorescently labeled products
hybrid-ized to the immobilhybrid-ized probes on the substrate can be easily
detected by using a fluorescence-detecting scanner, and the
readable fluorescent signals obtained are combined to
de-termine the genotype of genes (12). In recent years, a
mi-croarray technique has been successfully applied to the
de-tection of resistance genes or resistance-associated SNPs in
various pathogens (3, 4, 23, 29).
Here, we introduce a one-step mPCR in combination with
an oligonucleotide microarray method for rapid,
high-through-put detection of the antimalarial resistance-associated SNPs in
Pf
crt
, Pf
mdr1
, Pf
dhps
, Pf
dhfr
, and Pf
ATPase6
.
* Corresponding author. Mailing address: National Institute of
Par-asitic Diseases, Chinese Center for Disease Control and Prevention,
207 Rui Jin Er Road, Shanghai 200025, China. Phone: 86-21-64373359.
Fax: 86-21-64332670. E-mail: [email protected].
† Supplemental material for this article may be found at http://jcm
.asm.org/.
䌤
Published ahead of print on 30 April 2008.
2167
on May 16, 2020 by guest
http://jcm.asm.org/
MATERIALS AND METHODS
Samples.ThreeP. falciparumlaboratory strains (3D7, HB3, and DD2) (30) and 92 field samples (positive forP. falciparumby microscopy) collected on 3MM filter paper (Whatman, Maidstone, United Kingdom) from China’s Yunnan province (40 samples), Hainan province (27 samples), and Myanmar’s Shan state (25 samples) were used in the present study. The genomic DNA ofP. berghei(CS strain),P. cynomolgi(B strain) andP. vivax(collected from Anhui province, China) were used as controls. The research protocol was approved by the Chi-nese National Institute of Parasitic Diseases ethics committee.
DNA extraction.Genomic DNAs of theP. falciparumlaboratory strains 3D7, HB3, and Dd2 were provided by the Malaria Research and Reference Reagent Resource Center (http://www.mr4.org/). Extraction of DNA from bloodspots on filter paper was carried out by the Chelex-100 (Bio-Rad Laboratories, Hercules, CA) method described by Wooden et al. (32) with some modifications described by Pearce et al. (22). The quality of the DNA samples was tested by determining the optical density at 260 and 280 nm.
SNPs studied.The following 21 SNPs were analyzed: Pfcrt391T/A, 392G/C, 399G/T, 400A/G, 402T/A, and 404A/C (corresponding to codons C72S, M74I, N75E, and K76T); Pfmdr1256A/T and 257A/T (N86Y/F); Pfdhps1482 T/G, 1483C/T/G, 1486 C/G, 1794 A/G, 1918 C/G, and 2013G/T/A (S436A/F/C, A437G, K540E, A581G, and A613S/T); Pfdhfr148T/C, 152A/T, 153T/C, 175T/C, 323G/A/C, and 490A/T (C50R, N51I, C59R, S108N/T, and I164L); and PfATPase62306G/A (S769N). These SNPs are located at 11 nucleotide positions since some positions include two or more SNPs.
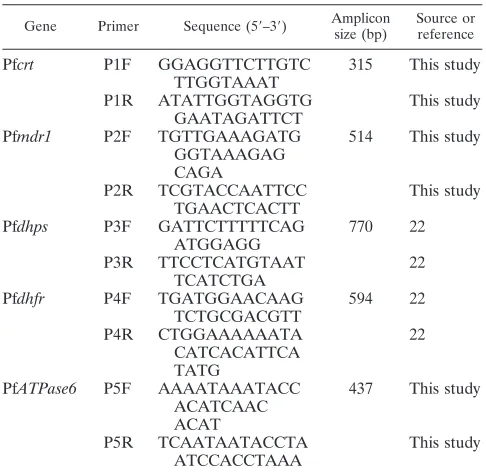
mPCR.To reduce the time and cost of DNA amplification, an mPCR was developed to amplify the DNA fragments containing all of the SNPs studied in one reaction. Five pairs of primers were designed by using Primer 5.0 software and checked for specificity in a BLAST search available through the National Center for Biotechnology Information (NCBI; http://www.ncbi.nlm.nih.gov /BLAST/). The primers used in the mPCR are shown in Table 1. mPCR was performed with the PCR amplification kit of Genscript (Piscataway, NJ) accord-ing to the manufacturer’s instructions. Briefly, the mPCR was performed by using the PTC 200 cycler (MJ Research, Inc., Waltham, MA) in a total volume of 50l of reaction mix containing 2.5 l of template DNA, 25l of 2⫻ Genscript master mix, and 1.0l of primer mixture (consisting of 3.2l of 12.5 M P1F, 3.2l of 12.5M P1R, 2.0l of 12.5M P2F, 2.0l of 12.5M P2R, 2.0l of 12.5M P3F, 2.0l of 12.5M P3R, 2.0l of 12.5M P4F, 2.0l of 12.5M P4R, 2.0l of 12.5M P5F, and 2.0l of 12.5M P5R). The mPCR cycling conditions were 94°C for 15 min for 1 cycle; followed by 30 cycles of denaturation at 94°C for 40 s, annealing at 50°C for 2 min, and extension (ramping from 50 to 72°C by 0.1°C/s) for about 3 min 40 s; followed in turn by 72°C for 3 min for 1 cycle and holding at 4°C. The resulting amplicon covers all
of the 21 observed SNPs. A total of 3l of PCR product was identified by electrophoresis on a 20-g/liter agarose gel to confirm the successful amplification.
Fragmentation and labeling of mPCR product.mPCR products were purified with a QIAquick PCR purification kit (Qiagen, Inc.) and treated with DNase I (Fermentas) at 0.001 U of DNA/g to generate fragments of 50 to 200 bp. Reaction mixtures contained 1 mM Tris-HCl, 0.25 mM MgCl2, and 0.05 mM CaCl2. The fragmentation reaction was performed at 37°C for 18 min and then at 95°C for 10 min. Labeling of DNA was performed using terminal deoxynucleo-tidyltransferase, and reaction mixtures (25l) contained 200 mM potassium cacodylate, 25 mM Tris-HCl (pH 7.2), 1 mM CoCl2, 0.01% Triton X-100, 20M Cy3-dCTP (GE Healthcare), and 20 U of deoxynucleotidyltransferase (Fermen-tas). The mixtures were incubated for 1 h at 37°C, followed by denaturation at 95°C for 10 min.
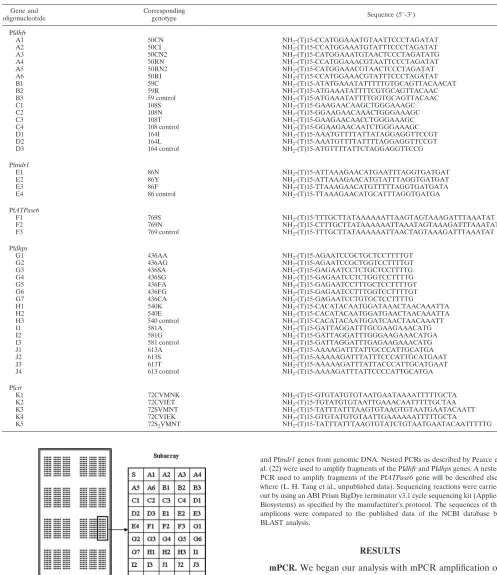
Oligonucleotide probe design and microarray manufacture.For each of the polymorphic sites associated with antimalarial drug resistance, a group of probes was designed, differentiated by the interrogated base(s) positioned in the central region of the probes. To reduce the number of potential ambiguous hybridization results, some oligonucleotide probes were designed to represent combinations of SNPs rather than one SNP. In all, 11 groups of probes were designed. The specificity of the oligonucleotide probes was verified through a BLAST search. Based on initial hybridization experiments, some probes were optimized by modifying their length and sequence to achieve more uniform fluorescence intensities across the microarray. Probes were commercially synthesized and modified (Table 2). Each probe contained a 5⬘-amino group for immobilization chemistry and a 15-mer poly(dT) spacer, followed by the nucleotide hybridiza-tion sequence.
The probes were suspended in 100 mM phosphate-buffered solution contain-ing 0.05% sodium dodecyl sulfate (SDS) at a concentration of 25M and printed on silylated slides (OPAldehydeSlide; CapitalBio Corp., Beijing, China) by an OmniGrid 100 Microarrayer (GeneMachine, San Carlos, CA). Each slide was spotted with 10 sets of three identical subarrays consisting of a 5⫻10 matrix; a matrix includes 45 specific probes and 2 Cy3-labeled spotting control probes (sequence, ATTGCTTGCGGCGGTAACG-Cy3), a positive hybridization con-trol probe (TCTGCTTCTGCTTCTGCTT), a negative hybridization concon-trol probe (TCTGCTTCTCCTTCTGCTT), and a blank control probe (100 mM phosphate-buffered solution containing 0.05% SDS). A schematic diagram of the probe positions on the microarray is shown in Fig. 1.
Hybridization and washing. Hybridization of fluorescently labeled single-stranded DNA samples to the oligonucleotide microarray was performed in 1⫻ hybridization buffer (6⫻sodium chloride-sodium phosphate-EDTA buffer, 5% dimethyl sulfoxide, 0.1% Triton X-100) at 52°C for 1 h. Just before hybridization, 10l of the Cy3-labeled single-stranded DNA sample was mixed with an equal volume of 2⫻hybridization buffer containing 1 nM Cy3-labeled control oligo-nucleotide (sequence, AAGCAGAAGCAGAAGCAGA), followed by denatur-ation at 95°C for 10 min and chilling on ice. After hybridizdenatur-ation, the slides were washed at 42°C for 6 min with 2⫻saline sodium citrate (SSC) buffer containing 1% SDS, for 6 min with 1⫻SSC buffer containing 0.2% SDS, and for 3 min with 0.6⫻SSC buffer. Traces of buffer were removed by air stream.
Microarray scanning and analysis.Slides were scanned by using a scanner GenePix 4000B (Axon Instruments), and data acquisition and processing were performed by using GenePix Pro 3.0 software. The median of local background-corrected feature intensities (henceforth referred to as net intensities) and their signal-to-noise ratios (net intensities/standard deviation of the local background) were used for further analyses. Each signal was ranked from highest to lowest in each probe group according to their net intensities. The highest ranked signal in each group was regarded as a positive signal, and a signal with an intensity more than one-third of the strongest signal in that group was also considered a positive signal, whereas signals with intensities less than one-third of the strongest signal were considered negative. When hybridized to single-infection samples, only one probe in each group produced a positive signal as the perfect match. In multiple infections, two or more probes with the highest signal intensities in a group might be selected as positive.
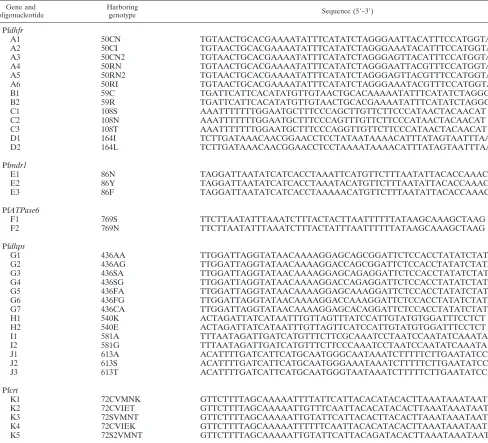
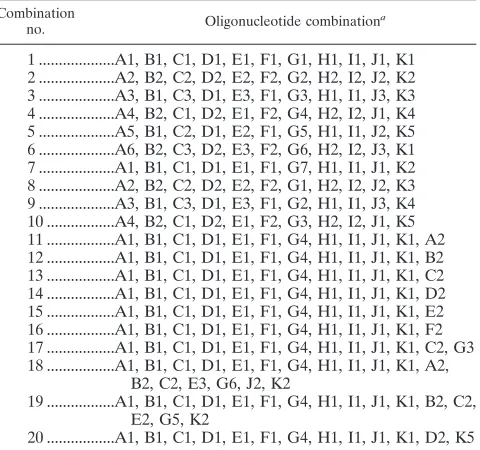
Microarray analyses of synthesized oligonucleotides.Because genotype vari-ations of the five genes from the samples studied here were limited, we also used a set of 37 synthesized 50-bp oligonucleotides (Table 3) harboring all known genotypes of the loci studied to evaluate the microarray. Twenty combinations (Table 4) of the synthesized oligonucleotides were detected by the microarray to test whether the method can correctly identify all possible genotypes in single or mixed infection. The labeling and hybridization conditions were as described above.
[image:2.585.42.285.79.317.2]Traditional nested PCR-sequencing assay.To validate the results of microar-ray analysis, nested PCR-sequencing assays were performed in parallel. Nested PCRs described by Djimde et al. (6) were used to amplify fragments of the Pfcrt
TABLE 1. Primers used in the mPCR
Gene Primer Sequence (5⬘–3⬘) Amplicon size (bp)
Source or reference
Pf
crt
P1F
GGAGGTTCTTGTC
TTGGTAAAT
315
This study
P1R
ATATTGGTAGGTG
GAATAGATTCT
This study
Pf
mdr1
P2F
TGTTGAAAGATG
GGTAAAGAG
CAGA
514
This study
P2R
TCGTACCAATTCC
TGAACTCACTT
This study
Pf
dhps
P3F
GATTCTTTTTCAG
ATGGAGG
770
22
P3R
TTCCTCATGTAAT
TCATCTGA
22
Pf
dhfr
P4F
TGATGGAACAAG
TCTGCGACGTT
594
22
P4R
CTGGAAAAAATA
CATCACATTCA
TATG
22
Pf
ATPase6
P5F
AAAATAAATACC
ACATCAAC
ACAT
437
This study
P5R
TCAATAATACCTA
ATCCACCTAAA
This study
on May 16, 2020 by guest
http://jcm.asm.org/
and Pfmdr1genes from genomic DNA. Nested PCRs as described by Pearce et al. (22) were used to amplify fragments of the Pfdhfrand Pfdhpsgenes. A nested PCR used to amplify fragments of the PfATPase6gene will be described else-where (L. H. Tang et al., unpublished data). Sequencing reactions were carried out by using an ABI Prism BigDye terminator v3.1 cycle sequencing kit (Applied Biosystems) as specified by the manufacturer’s protocol. The sequences of the amplicons were compared to the published data of the NCBI database by BLAST analysis.
RESULTS
mPCR.
We began our analysis with mPCR amplification of
the five antimalarial resistance related genes from laboratory
strains and field samples. Gel electrophoresis of the resulting
mPCR products indicated that they were of the expected sizes
(Fig. 2). Under these amplification conditions, no nonspecific
bands were observed for most samples. Moreover, the genomic
DNAs of
P. vivax
,
P. berghei
, and
P. cynomolgi
did not yield any
PCR products of the expected length.
[image:3.585.41.538.77.652.2]FIG. 1. Schematic diagram of the probe positions on the
microar-ray. A1 to K5, specific probes for detection of the SNPs; S, spotting
control probe; N, negative control probe; P, positive control probe; B,
blank control probe. Each probe was spotted three times.
TABLE 2. Oligonucleotide probes used in the microarray
Gene and oligonucleotide
Corresponding
genotype Sequence (5⬘–3⬘)
Pfdhfr
A1 50CN NH2-(T)15-CCATGGAAATGTAATTCCCTAGATAT
A2 50CI NH2-(T)15-CCATGGAAATGTATTTCCCTAGATAT
A3 50CN2 NH2-(T)15-CATGGAAATGTAACTCCCTAGATATG
A4 50RN NH2-(T)15-CCATGGAAACGTAATTCCCTAGATAT
A5 50RN2 NH2-(T)15-CATGGAAACGTAACTCCCTAGATAT
A6 50RI NH2-(T)15-CCATGGAAACGTATTTCCCTAGATAT
B1 59C NH2-(T)15-ATATGAAATATTTTTGTGCAGTTACAACAT
B2 59R NH2-(T)15-ATGAAATATTTTCGTGCAGTTACAAC
B3 59 control NH2-(T)15-ATGAAATATTTTGGTGCAGTTACAAC
C1 108S NH2-(T)15-GAAGAACAAGCTGGGAAAGC
C2 108N NH2-(T)15-GGAAGAACAAACTGGGAAAGC
C3 108T NH2-(T)15-GAAGAACAACCTGGGAAAGC
C4 108 control NH2-(T)15-GGAAGAACAATCTGGGAAAGC
D1 164I NH2-(T)15-AAATGTTTTATTATAGGAGGTTCCGT
D2 164L NH2-(T)15-AAATGTTTTATTTTAGGAGGTTCCGT
D3 164 control NH2-(T)15-ATGTTTTATTCTAGGAGGTTCCG
Pfmdr1
E1 86N NH2-(T)15-ATTAAAGAACATGAATTTAGGTGATGAT
E2 86Y NH2-(T)15-ATTAAAGAACATGTATTTAGGTGATGAT
E3 86F NH2-(T)15-TTAAAGAACATGTTTTTAGGTGATGATA
E4 86 control NH2-(T)15-TTAAAGAACATGCATTTAGGTGATGA
PfATPase6
F1 769S NH2-(T)15-TTTGCTTATAAAAAATTAAGTAGTAAAGATTTAAATAT
F2 769N NH2-(T)15-CTTTGCTTATAAAAAATTAAATAGTAAAGATTTAAATAT
F3 769 control NH2-(T)15-TTTGCTTATAAAAAATTAACTAGTAAAGATTTAAATAT
Pfdhps
G1 436AA NH2-(T)15-AGAATCCGCTGCTCCTTTTGT
G2 436AG NH2-(T)15-AGAATCCGCTGGTCCTTTTGT
G3 436SA NH2-(T)15-GAGAATCCTCTGCTCCTTTTG
G4 436SG NH2-(T)15-GAGAATCCTCTGGTCCTTTTG
G5 436FA NH2-(T)15-GAGAATCCTTTGCTCCTTTTGT
G6 436FG NH2-(T)15-GAGAATCCTTTGGTCCTTTTGT
G7 436CA NH2-(T)15-GAGAATCCTGTGCTCCTTTTG
H1 540K NH2-(T)15-CACATACAATGGATAAACTAACAAATTA
H2 540E NH2-(T)15-CACATACAATGGATGAACTAACAAATTA
H3 540 control NH2-(T)15-CACATACAATGGATCAACTAACAAATT
I1 581A NH2-(T)15-GATTAGGATTTGCGAAGAAACATG
I2 581G NH2-(T)15-GATTAGGATTTGGGAAGAAACATGA
I3 581 control NH2-(T)15-GATTAGGATTTGAGAAGAAACATG
J1 613A NH2-(T)15-AAAAGATTTATTGCCCATTGCATGA
J2 613S NH2-(T)15-AAAAAGATTTATTTCCCATTGCATGAAT
J3 613T NH2-(T)15-AAAAAGATTTATTACCCATTGCATGAAT
J4 613 control NH2-(T)15-AAAAGATTTATTCCCCATTGCATGA
Pfcrt
K1 72CVMNK NH2-(T)15-GTGTATGTGTAATGAATAAAATTTTTGCTA
K2 72CVIET NH2-(T)15-TGTATGTGTAATTGAAACAATTTTTGCTAA
K3 72SVMNT NH2-(T)15-TATTTATTTAAGTGTAAGTGTAATGAATACAATT
K4 72CVIEK NH2-(T)15-GTGTATGTGTAATTGAAAAAATTTTTGCTA
K5 72S2VMNT NH2-(T)15-TATTTATTTAAGTGTATCTGTAATGAATACAATTTTTG
on May 16, 2020 by guest
http://jcm.asm.org/
Microarray analyses of laboratory strains and field
sam-ples.
The net intensities achieved at the different
oligonucleo-tide probes varied substantially, which is reflected by the wide
range of signal-to-noise ratios from 5.6
⫾
0.9 to 40.3
⫾
6.4.
However, upon hybridization to perfectly matching target
DNA, the signal-to-noise ratios at all probes were larger than
three (Fig. 3A). This threshold is considered indicative of
suf-ficient signal in fluorescence-based microarray hybridization
(3). Also, the net intensities at matching probes were always at
least five times as stronger than those at probes with
mis-match(es) to the respective targets (Fig. 3B), which will suffice
for robust genotyping.
All of the SNPs in the three
P. falciparum
laboratory strains
could be correctly analyzed by the mPCR-microarray system.
In 8 of 92 field samples, results could not be obtained due to
failure of DNA extraction or mPCR amplification. Among 957
genotyped positions of the 87 successful hybridizations, 943
(98.5%) yielded usable data, and 12 (1.3%) had inconsistent
genotyping results between the nested PCR-sequencing assay
and the microarray assay (see Table S1 in the supplemental
material). Four discrepancies were due to errors in the
se-quencing assay, three discrepancies were due to insufficient
probe-spotting quality, three discrepancies were due to a
non-specific microarray signal, and two discrepancies were due to
false determination of mixed infection by microarray. Scanning
images and genotyping results of
P. falciparum
3D7 and Dd2
are shown in Fig. 4.
[image:4.585.46.534.81.524.2]Serial 10-fold dilutions of genomic DNA ranging from 60 ng
to 0.6 pg were used to test the sensitivity of the
mPCR-mi-croarray system. The results demonstrated that when the DNA
was not less than 0.06 ng, all of the SNPs in the five genes could
be identified. When the DNA was diluted to 6 pg, SNPs at
TABLE 3. Thirty-seven synthesized oligonucleotides
Gene and oligonucleotide
Harboring
genotype Sequence (5⬘–3⬘)
Pf
dhfr
A1
50CN
TGTAACTGCACGAAAATATTTCATATCTAGGGAATTACATTTCCATGGTA
A2
50CI
TGTAACTGCACGAAAATATTTCATATCTAGGGAAATACATTTCCATGGTA
A3
50CN2
TGTAACTGCACGAAAATATTTCATATCTAGGGAGTTACATTTCCATGGTA
A4
50RN
TGTAACTGCACGAAAATATTTCATATCTAGGGAATTACGTTTCCATGGTA
A5
50RN2
TGTAACTGCACGAAAATATTTCATATCTAGGGAGTTACGTTTCCATGGTA
A6
50RI
TGTAACTGCACGAAAATATTTCATATCTAGGGAAATACGTTTCCATGGTA
B1
59C
TGATTCATTCACATATGTTGTAACTGCACAAAAATATTTCATATCTAGGG
B2
59R
TGATTCATTCACATATGTTGTAACTGCACGAAAATATTTCATATCTAGGG
C1
108S
AAATTTTTTTGGAATGCTTTCCCAGCTTGTTCTTCCCATAACTACAACAT
C2
108N
AAATTTTTTTGGAATGCTTTCCCAGTTTGTTCTTCCCATAACTACAACAT
C3
108T
AAATTTTTTTGGAATGCTTTCCCAGGTTGTTCTTCCCATAACTACAACAT
D1
164I
TCTTGATAAACAACGGAACCTCCTATAATAAAACATTTATAGTAATTTAA
D2
164L
TCTTGATAAACAACGGAACCTCCTAAAATAAAACATTTATAGTAATTTAA
Pf
mdr1
E1
86N
TAGGATTAATATCATCACCTAAATTCATGTTCTTTAATATTACACCAAAC
E2
86Y
TAGGATTAATATCATCACCTAAATACATGTTCTTTAATATTACACCAAAC
E3
86F
TAGGATTAATATCATCACCTAAAAACATGTTCTTTAATATTACACCAAAC
Pf
ATPase6
F1
769S
TTCTTAATATTTAAATCTTTACTACTTAATTTTTTATAAGCAAAGCTAAG
F2
769N
TTCTTAATATTTAAATCTTTACTATTTAATTTTTTATAAGCAAAGCTAAG
Pf
dhps
G1
436AA
TTGGATTAGGTATAACAAAAGGAGCAGCGGATTCTCCACCTATATCTATA
G2
436AG
TTGGATTAGGTATAACAAAAGGACCAGCGGATTCTCCACCTATATCTATA
G3
436SA
TTGGATTAGGTATAACAAAAGGAGCAGAGGATTCTCCACCTATATCTATA
G4
436SG
TTGGATTAGGTATAACAAAAGGACCAGAGGATTCTCCACCTATATCTATA
G5
436FA
TTGGATTAGGTATAACAAAAGGAGCAAAGGATTCTCCACCTATATCTATA
G6
436FG
TTGGATTAGGTATAACAAAAGGACCAAAGGATTCTCCACCTATATCTATA
G7
436CA
TTGGATTAGGTATAACAAAAGGAGCACAGGATTCTCCACCTATATCTATA
H1
540K
ACTAGATTATCATAATTTGTTAGTTTATCCATTGTATGTGGATTTCCTCT
H2
540E
ACTAGATTATCATAATTTGTTAGTTCATCCATTGTATGTGGATTTCCTCT
I1
581A
TTTAATAGATTGATCATGTTTCTTCGCAAATCCTAATCCAATATCAAATA
I2
581G
TTTAATAGATTGATCATGTTTCTTCCCAAATCCTAATCCAATATCAAATA
J1
613A
ACATTTTGATCATTCATGCAATGGGCAATAAATCTTTTTCTTGAATATCC
J2
613S
ACATTTTGATCATTCATGCAATGGGAAATAAATCTTTTTCTTGAATATCC
J3
613T
ACATTTTGATCATTCATGCAATGGGTAATAAATCTTTTTCTTGAATATCC
Pf
crt
K1
72CVMNK
GTTCTTTTAGCAAAAATTTTATTCATTACACATACACTTAAATAAATAAT
K2
72CVIET
GTTCTTTTAGCAAAAATTGTTTCAATTACACATACACTTAAATAAATAAT
K3
72SVMNT
GTTCTTTTAGCAAAAATTGTATTCATTACACTTACACTTAAATAAATAAT
K4
72CVIEK
GTTCTTTTAGCAAAAATTTTTTCAATTACACATACACTTAAATAAATAAT
K5
72S2VMNT
GTTCTTTTAGCAAAAATTGTATTCATTACAGATACACTTAAATAAATAAT
on May 16, 2020 by guest
http://jcm.asm.org/
codons 50, 51, 59, 108, and 164 of gene Pf
dhfr
could not be
identified, but other SNPs were identified successfully. When
the DNA was diluted to 0.6 pg, only the SNPs at codons 436,
437, 540, and 613 of Pf
dhps
and the SNP at codon 86 of Pf
mdr1
could be detected.
The specificity of microarray assay was tested by using
mPCR products from
P. berghei
,
P. cynomolgi
, and
P. vivax
. For
these three parasites no positive signal was obtained with any
specific probe except the spotting control probe and the
posi-tive hybridization control probe.
To determine at what level minor SNPs in mixed infections
can be detected, we mixed the genomic DNA of the 3D7 and
Dd2 strains. These two strains have different genotypes at
Pf
dhfr
codons 51, 59, and 108, Pf
mdr1
codon 86, Pf
dhps
codons
436 and 613, and Pf
crt
codons 74, 75, and 76. Although the
DNA concentration of one parasite strain was fixed at 3 ng/
l,
the DNA concentration of the other strain was serially 10-fold
diluted from 30 ng/
l to 0.3 pg/
l. When the DNA
concentra-tion of 3D7 was fixed, Dd2 could be satisfactorily analyzed at
30 pg/
l. When the DNA concentration of Dd2 was fixed, 3D7
could also be satisfactorily analyzed at 30 pg/
l.
There was 98.2% (926/943) agreement among the genotypes
obtained from three identical subarrays in the same slide for 87
samples. Thirty samples were investigated in two separate tests
by the microarray method and interpreted blindly, and the
reproducibility between the repeated typing was 96.1% (317/
330).
Microarray analyses of the synthesized oligonucleotides.
All
SNPs in the 20 combinations of the synthesized
oligonucleo-tides were identified without ambiguity by the microarray
ex-cept for two genotyped positions of Pf
dhps
540 that could not
give usable signals due to spotting failure. The net intensity
ratios of matching probes to the mismatch ones were more
than five times for 83.9% of the total and between 2.7 and 5.0
times for the others. Figure 5 shows a scanning image of the
combination of 18 of the synthesized oligonucleotides
(simu-lation of mixed infection of
P. falciparum
3D7 and
P.
falcipa-rum
Dd2).
DISCUSSION
In this study, we describe the development of an
mPCR-based oligonucleotide microarray method that can
simulta-neously detect a set of SNPs, covering the genetic markers
associated with the resistance of
P. falciparum
to the most
common used antimalarial drugs, such as CQ, AQ, MQ, LUM,
pyrimethamine, sulfadoxine, and artemether.
A high degree of concordance was observed when we
com-pared the new microarray assay with the existing nested
PCR-sequencing method, probably the most credible method
cur-rently used for detection of these SNPs. This indicates that the
microarray technique for drug resistance-associated genes
genotyping is reliable and accurate.
[image:5.585.45.285.79.304.2]Traditional nested PCR method requires 10 PCRs for
ap-plication of the five genes, which may take five workdays to
accomplish. Here, the use of mPCR to amplify the five genes
in one reaction leads to a significant decrease in time, cost, and
FIG. 2. Agarose gel electrophoresis of mPCR products. M, 100-bp DNA ladder. Lane 1,
P. falciparum
3D7; lane 2,
P. falciparum
Dd2; lane 3,
P. falciparum
HB3; lanes 4 to 5,
P. falciparum
samples collected from field; lane 6,
P. vivax
; lane 7,
P. berghei
; lane 8,
P. cynomolgi
; lane 9, blank
control (H
2O).
TABLE 4. Twenty combinations of the synthesized oligonucleotides
Combination
no. Oligonucleotide combination
a
1 ...A1, B1, C1, D1, E1, F1, G1, H1, I1, J1, K1
2 ...A2, B2, C2, D2, E2, F2, G2, H2, I2, J2, K2
3 ...A3, B1, C3, D1, E3, F1, G3, H1, I1, J3, K3
4 ...A4, B2, C1, D2, E1, F2, G4, H2, I2, J1, K4
5 ...A5, B1, C2, D1, E2, F1, G5, H1, I1, J2, K5
6 ...A6, B2, C3, D2, E3, F2, G6, H2, I2, J3, K1
7 ...A1, B1, C1, D1, E1, F1, G7, H1, I1, J1, K2
8 ...A2, B2, C2, D2, E2, F2, G1, H2, I2, J2, K3
9 ...A3, B1, C3, D1, E3, F1, G2, H1, I1, J3, K4
10 ...A4, B2, C1, D2, E1, F2, G3, H2, I2, J1, K5
11 ...A1, B1, C1, D1, E1, F1, G4, H1, I1, J1, K1, A2
12 ...A1, B1, C1, D1, E1, F1, G4, H1, I1, J1, K1, B2
13 ...A1, B1, C1, D1, E1, F1, G4, H1, I1, J1, K1, C2
14 ...A1, B1, C1, D1, E1, F1, G4, H1, I1, J1, K1, D2
15 ...A1, B1, C1, D1, E1, F1, G4, H1, I1, J1, K1, E2
16 ...A1, B1, C1, D1, E1, F1, G4, H1, I1, J1, K1, F2
17 ...A1, B1, C1, D1, E1, F1, G4, H1, I1, J1, K1, C2, G3
18 ...A1, B1, C1, D1, E1, F1, G4, H1, I1, J1, K1, A2,
B2, C2, E3, G6, J2, K2
19 ...A1, B1, C1, D1, E1, F1, G4, H1, I1, J1, K1, B2, C2,
E2, G5, K2
20 ...A1, B1, C1, D1, E1, F1, G4, H1, I1, J1, K1, D2, K5
a
Combinations 1 to 10 simulate single infections with various genotypes; combinations 11 to 20 simulate mixed infections.
on May 16, 2020 by guest
http://jcm.asm.org/
[image:5.585.84.508.553.694.2]number of manipulations. It takes a total of about 8 h to
perform the entire detection procedure, from mPCR reaction
(4.0 h), DNA labeling (2.0 h), hybridization (1.5 h), and
mi-croarray washing (0.25 h) to mimi-croarray scanning and analysis
(0.25 h). There are 30 subarrays in a slide, allowing the
geno-typing of 10 different samples thrice by each assay, so
approx-imately 100 samples could be analyzed for the 21
resistance-associated SNPs in one workday by two technicians. Therefore,
this method is especially suitable for large-scale surveillance of
the molecular markers. Moreover, the method requires less
genomic DNA, which is propitious for analyzing samples with
low parasite density.
The high throughput of the microarray method substantially
reduces the cost. In estimating the cost, we included expenses
associated with DNA isolation, multiplex-PCR, PCR product
labeling, microarray production, microarray hybridization, and
microarray washing. The equipment and labor costs were not
included. We calculated a price of 2.9 Chinese yuan ($0.41
[United States]) per SNP for the microarray method; this cost
was lower than that for pyrosequencing ($2.28 per SNP),
con-ventional sequencing ($3.66 per SNP), and RFLP ($6.58 per
SNP) (37).
Filter paper samples used in the present study offered
con-siderable advantages for field collection, transportation, and
storage over frozen liquid samples, but eight samples collected
from Hainan province in 2001 failed to be analyzed by
microar-ray. We found that these samples were not stored in a dry
environment and became moldy before tests were conducted.
Thus, it is probable that the genomic DNA of the parasite in
these samples was destroyed or degraded. Therefore, it is
im-portant to store samples properly to ensure high-quality DNA.
In addition, since false microarray determinations were mainly
caused by nonspecific signals and poor probe spotting, the
microarray silylated slides should be carefully kept from dust
contamination and more efforts should be made to further
improve the spotting quality.
The testing results of the 20 combinations of the synthesized
oligonucleotides show that the microarray is able to identify all
of the possible genotypes at the loci studied. Furthermore, it
indicates that the technique can also differentiate the SNPs of
mixed infections with
P. falciparum
strains of different
geno-types, which allows the application of microarrays in various
regions for different genetic background of
P. falciparum
.
[image:6.585.73.515.69.195.2]As a limitation, the microarray could only be used to analyze
the known SNPs in the resistance-related genes. Further
stud-ies are needed to develop a microarray assay for detection of
FIG. 3. Signal-to-noise ratios and mismatch discrimination. The data are based on three independent hybridizations of
P. falciparum
3D7.
(A) Signal-to-noise ratios (means and standard errors) of perfectly matching probes; (B) relative intensities of mismatched probes (means and
standard errors).
FIG. 4. Scanning images of
P. falciparum
3D7 and Dd2. For 3D7, the positive probes were A1, B1, C1, D1, E1, F1, G4, H1, I1, J1, K1, P, and
S (genotypes: Pf
dhfr
, 50/51CN, 59C, 108S, and 164I; Pf
mdr1
, 86N; Pf
ATPase6
, 769S; Pf
dhps
, 436/437 SG, 540K, 581A, and 613A; Pf
crt
,
72-76CVMNK). For Dd2, the positive probes were A2, B2, C2, D1, E3, F1, G6, H1, I1, J2, K2, P, and S (genotypes: Pf
dhfr
, 50/51CI, 59R, 108N,
and 164I; Pf
mdr1
, 86F; Pf
ATPase6
, 769S; Pf
dhps
, 436/437 FG, 540K, 581A, and 613S; Pf
crt
, 72-76CVIET).
on May 16, 2020 by guest
http://jcm.asm.org/
[image:6.585.82.502.530.688.2]the Pf
mdr1
copy number, which has been associated with
re-sistance against chloroquine, mefloquine, and probably
arte-misinins. Since new SNPs associated with antimalarial drug
resistance continue to be discovered, the present microarray
should be regularly updated by adding new probes.
It should be noted that microarray technology requires a
microarray spotter and a microarray scanner, which may not be
available in ordinary laboratories. We hereby suggest that a
microarray laboratory be established in one or several
coun-tries where
P. falciparum
is endemic so that every site within
the area can send filter paper samples to that laboratory for
testing. Moreover, in the next phase, we will try to adopt
chemiluminescence in the microarray technology so that the
microarray assay can be performed in more laboratories.
In conclusion, mPCR-based microarray provides a
promis-ing tool for resistance-associated SNP detection in
P.
falcipa-rum
. This approach not only saves time and cost but also
permits high-throughput detection of the SNPs. However, we
consider that molecular techniques, including microarray, will
complement rather than replace conventional in vivo or in
vitro testing. Conventional resistance testing will remain
indis-pensable for the detection of resistance because the molecular
results do not always correlate with the clinical response
asso-ciated with
P. falciparum
. Therefore, microarray-based analysis
will be most useful in combination with conventional methods.
We expect that the method developed here will considerably
facilitate the molecular surveillance of antimalarial resistance
in countries and regions where malaria is endemic.
ACKNOWLEDGMENTS
This study was supported by the Key Science-Technology Project of
the National Tenth Five-Year Plan of China (no. 2004BA718B13).
We are grateful to Yi Zhong Duan and Ying Xue Lin for providing
P. falciparum
samples. We thank Yao Yu Feng and Yi Chang Ni for
critically reading the manuscript. We also thank the Malaria Research
and Reference Reagent Resource Center for providing the genomic
DNA for
P. falciparum
3D7, HB3, and Dd2.
REFERENCES
1.Abdel-Muhsin, A. M., L. C. Ranford-Cartwright, A. R. Medani, S. Ahmed, S. Suleiman, B. Khan, P. Hunt, D. Walliker, and H. A. Babiker.2002. Detec-tion of mutaDetec-tions in thePlasmodium falciparumdihydrofolate reductase (dhfr) gene by dot blot hybridization. Am. J. Trop. Med. Hyg.67:24–27. 2.Alifrangis, M., S. Enosse, R. Pearce, C. Drakeley, C. Roper, I. F. Khalil,
W. M. Nkya, A. M. Ronn, T. G. Theander, and I. C. Bygbjerg.2005. A simple, high-throughput method to detectPlasmodium falciparumsingle nucleotide
polymorphisms in the dihydrofolate reductase, dihydropteroate synthase, andP. falciparumchloroquine resistance transporter genes using polymerase chain reaction- and enzyme-linked immunosorbent assay-based technology. Am. J. Trop. Med. Hyg.72:155–162.
3.Antwerpen, M. H., M. Schellhase, E. Ehrentreich-Forster, F. Bier, W. Witte, and U. Nubel.2007. DNA microarray for detection of antibiotic resistance determinants inBacillus anthracisand closely relatedBacillus cereus. Mol. Cell Probes21:152–160.
4.Booth, S. A., M. A. Drebot, I. E. Martin, and L. K. Ng.2003. Design of oligonucleotide arrays to detect point mutations: molecular typing of anti-biotic resistant strains ofNeisseria gonorrhoeaeand hantavirus-infected deer mice. Mol. Cell Probes17:77–84.
5.Bruant, G., C. Maynard, S. Bekal, I. Gaucher, L. Masson, R. Brousseau, and J. Harel.2006. Development and validation of an oligonucleotide microarray for detection of multiple virulence and antimicrobial resistance genes in
Escherichia coli. Appl. Environ. Microbiol.72:3780–3784.
6.Djimde, A., O. K. Doumbo, J. F. Cortese, K. Kayentao, S. Doumbo, Y. Diourte, A. Dicko, X. Z. Su, T. Nomura, D. A. Fidock, T. E. Wellems, C. V. Plowe, and D. Coulibaly.2001. A molecular marker for chloroquine-resistant falciparum malaria. N. Engl. J. Med.344:257–263.
7.Djimde, A., A. Dolo, A. Ouattara, S. Diakite, C. V. Plowe, and O. K. Doumbo.
2004. Molecular diagnosis of resistance to antimalarial drugs during epidemics and in war zones. J. Infect. Dis.190:853–855.
8.Duraisingh, M. T., J. Curtis, and D. C. Warhurst.1998.Plasmodium falcip-arum: detection of polymorphisms in the dihydrofolate reductase and dihy-dropteroate synthetase genes by PCR and restriction digestion. Exp. Para-sitol.89:1–8.
9.Duraisingh, M. T., and P. Refour.2005. Multiple drug resistance genes in malaria: from epistasis to epidemiology. Mol. Microbiol.57:874–877. 10.Durand, R., J. Eslahpazire, S. Jafari, J. F. Delabre, A. Marmorat-Khuong,
J. P. di Piazza, and J. Le Bras.2000. Use of molecular beacons to detect an antifolate resistance-associated mutation inPlasmodium falciparum. Antimi-crob. Agents Chemother.44:3461–3464.
11.Eckstein-Ludwig, U., R. J. Webb, I. D. Van Goethem, J. M. East, A. G. Lee, M. Kimura, P. M. O’Neill, P. G. Bray, S. A. Ward, and S. Krishna.2003. Artemisinins target the SERCA ofPlasmodium falciparum. Nature424:957– 961.
12.Ehrenreich, A.2006. DNA microarray technology for the microbiologist: an overview. Appl. Microbiol. Biotechnol.73:255–273.
13.Gregson, A., and C. V. Plowe.2005. Mechanisms of resistance of malaria parasites to antifolates. Pharmacol. Rev.57:117–145.
14.Happi, C. T., G. O. Gbotosho, O. A. Folarin, D. O. Akinboye, B. O. Yusuf, O. O. Ebong, A. Sowunmi, D. E. Kyle, W. Milhous, D. F. Wirth, and A. M. Oduola.2005. Polymorphisms inPlasmodium falciparum dhfranddhpsgenes and age related in vivo sulfadoxine-pyrimethamine resistance in malaria-infected patients from Nigeria. Acta Trop.95:183–193.
15.Hyde, J. E.2005. Drug-resistant malaria. Trends Parasitol.21:494–498. 16.Jambou, R., E. Legrand, M. Niang, N. Khim, P. Lim, B. Volney, M. T. Ekala,
C. Bouchier, P. Esterre, T. Fandeur, and O. Mercereau-Puijalon.2005. Resistance ofPlasmodium falciparumfield isolates to in-vitro artemether and point mutations of the SERCA-type PfATPase6. Lancet366:1960–1963. 17.Johnson, D. J., D. A. Fidock, M. Mungthin, V. Lakshmanan, A. B. Sidhu, P. G. Bray, and S. A. Ward.2004. Evidence for a central role for PfCRT in conferringPlasmodium falciparumresistance to diverse antimalarial agents. Mol. Cell15:867–877.
18.Jung, M., H. Kim, K. Y. Nam, and K. T. No. 2005. Three-dimensional structure ofPlasmodium falciparumCa2⫹-ATPase(PfATP6) and docking of
artemisinin derivatives to PfATP6. Bioorg Med. Chem. Lett.15:2994–2997. 19.Kublin, J. G., F. K. Dzinjalamala, D. D. Kamwendo, E. M. Malkin, J. F. Cortese, L. M. Martino, R. A. Mukadam, S. J. Rogerson, A. G. Lescano, M. E. Molyneux, P. A. Winstanley, P. Chimpeni, T. E. Taylor, and C. V. Plowe.2002. Molecular markers for failure of sulfadoxine-pyrimethamine and chlorproguanil-dapsone treatment ofPlasmodium falciparummalaria. J. Infect. Dis.185:380–388.
20.Lakshmanan, V., P. G. Bray, D. Verdier-Pinard, D. J. Johnson, P. Horrocks, R. A. Muhle, G. E. Alakpa, R. H. Hughes, S. A. Ward, D. J. Krogstad, A. B. Sidhu, and D. A. Fidock.2005. A critical role for PfCRT K76T in Plasmo-dium falciparumverapamil-reversible chloroquine resistance. EMBO J.24:
2294–2305.
21.Ndiaye, D., J. P. Daily, O. Sarr, O. Ndir, O. Gaye, S. Mboup, and D. F. Wirth.
2005. Mutations inPlasmodium falciparumdihydrofolate reductase and di-hydropteroate synthase genes in Senegal. Trop. Med. Int. Health.10:1176– 1179.
22.Pearce, R. J., C. Drakeley, D. Chandramohan, F. Mosha, and C. Roper.
2003. Molecular determination of point mutation haplotypes in the dihydro-folate reductase and dihydropteroate synthase ofPlasmodium falciparumin three districts of northern Tanzania. Antimicrob. Agents Chemother.47:
1347–1354.
[image:7.585.80.248.68.193.2]23.Perreten, V., L. Vorlet-Fawer, P. Slickers, R. Ehricht, P. Kuhnert, and J. Frey.2005. Microarray-based detection of 90 antibiotic resistance genes of gram-positive bacteria. J. Clin. Microbiol.43:2291–2302.
FIG. 5. Scanning image of simulated mixed infection of
P.
falcipa-rum
3D7 and
P. falciparum
Dd2 (combination of 18 synthesized
oligo-nucleotides). The positive probes were A1, B1, C1, D1, E1, F1, G4, H1,
I1, J1, K1, A2, B2, C2, E3, G6, J2, K2, P, and S.
on May 16, 2020 by guest
http://jcm.asm.org/
24.Plowe, C. V.2003. Monitoring antimalarial drug resistance: making the most of the tools at hand. J. Exp. Biol.206:3745–3752.
25.Reed, M. B., K. J. Saliba, S. R. Caruana, K. Kirk, and A. F. Cowman.2000. Pgh1 modulates sensitivity and resistance to multiple antimalarials in Plas-modium falciparum. Nature403:906–909.
26.Sisowath, C., J. Stromberg, A. Martensson, M. Msellem, C. Obondo, A. Bjorkman, and J. P. Gil.2005. In vivo selection ofPlasmodium falciparum pfmdr186N coding alleles by artemether-lumefantrine (Coartem). J. Infect. Dis.191:1014–1017.
27.Tagelsir, N., Z. Ibrahim, A. Medani, O. Salih, A. Hamad, H. Giha, A. El-Agib, B. Khan, N. Saeed, and M. Ibrahim.2006. High frequency of
Plasmodium falciparumPfCRT K76T and PfpghN86Y in patients clearing infection after chloroquine treatment in the Sudan. Acta Trop.97:19–25. 28.Veiga, M. I., P. E. Ferreira, A. Bjorkman, and J. P. Gil.2006. Multiplex
PCR-RFLP methods forpfcrt,pfmdr1, andpfdhfrmutations inPlasmodium falciparum. Mol. Cell Probes20:100–104.
29.Vora, G. J., C. E. Meador, M. M. Bird, C. A. Bopp, J. D. Andreadis, and D. A. Stenger.2005. Microarray-based detection of genetic heterogeneity, antimi-crobial resistance, and the viable but nonculturable state in human patho-genicVibriospp. Proc. Natl. Acad. Sci. USA102:19109–19114.
30.Walliker, D., I. A. Quakyi, T. E. Wellems, T. F. McCutchan, A. Szarfman, W. T. London, L. M. Corcoran, T. R. Burkot, and R. Carter.1987. Genetic analysis of the human malaria parasite Plasmodium falciparum. Science
236:1661–1666.
31.Wilson, P. E., A. P. Alker, and S. R. Meshnick.2005. Real-time PCR meth-ods for monitoring antimalarial drug resistance. Trends Parasitol.21:278– 283.
32.Wooden, J., S. Kyes, and C. H. Sibley.1993. PCR and strain identification in
Plasmodium falciparum. Parasitol. Today9:303–305.
33.Woodrow, C. J., and S. Krishna.2006. Antimalarial drugs: recent advances in molecular determinants of resistance and their clinical significance. Cell Mol. Life Sci.63:1586–1596.
34.World Health Organization.2005. Susceptibility ofPlasmodium falciparum
to antimalarial drugs: report on global monitoring, 1996–2004. World Health Organization, Geneva, Switzerland.
35.World Health Organization and UNICEF.2005. World malaria report 2005. World Health Organization, Geneva, Switzerland.
36.Zhang, F., S. Hu, J. Huang, H. Wang, Z. Wen, G. Yongyao, and S. Wang.
2006. Development and clinical evaluation of oligonucleotide microarray for HLA-AB genotyping. Pharmacogenomics7:973–985.
37.Zhou, Z., A. C. Poe, J. Limor, K. K. Grady, I. Goldman, A. M. McCollum, A. A. Escalante, J. W. Barnwell, and V. Udhayakumar.2006. Pyrosequenc-ing, a high-throughput method for detecting single nucleotide polymor-phisms in the dihydrofolate reductase and dihydropteroate synthetase genes ofPlasmodium falciparum. J. Clin. Microbiol.44:3900–3910.
38.Zolg, J. W., G. X. Chen, and J. R. Plitt.1990. Detection of pyrimethamine resistance inPlasmodium falciparumby mutation-specific polymerase chain reaction. Mol. Biochem. Parasitol.39:257–265.