in Gram-Negative Pathogens by Use of High-Resolution Melting and
ScreenClust Analyses
Amanda L. Roth, Nancy D. Hanson
Center for Research in Anti-Infectives and Biotechnology, Department of Medical Microbiology and Immunology, Creighton University School of Medicine, Omaha, Nebraska, USA
In the United States, the production of theKlebsiella pneumoniaecarbapenemase (KPC) is an important mechanism of carbap-enem resistance in Gram-negative pathogens. Infections with KPC-producing organisms are associated with increased morbid-ity and mortalmorbid-ity; therefore, the rapid detection of KPC-producing pathogens is critical in patient care and infection control. We developed a real-time PCR assay complemented with traditional high-resolution melting (HRM) analysis, as well as statistically based genotyping, using the Rotor-Gene ScreenClust HRM software to both detect the presence ofblaKPCand differentiate be-tween KPC-2-like and KPC-3-like alleles. A total of 166 clinical isolates ofEnterobacteriaceae,Pseudomonas aeruginosa, and Acinetobacter baumanniiwith various-lactamase susceptibility patterns were tested in the validation of this assay; 66 of these organisms were known to produce the KPC-lactamase. The real-time PCR assay was able to detect the presence ofblaKPCin all 66 of these clinical isolates (100% sensitivity and specificity). HRM analysis demonstrated that 26 had KPC-2-like melting peak temperatures, while 40 had KPC-3-like melting peak temperatures. Sequencing of 21 amplified products confirmed the melting peak results, with 9 isolates carryingblaKPC-2and 12 isolates carryingblaKPC-3. This PCR/HRM assay can identify KPC-produc-ing Gram-negative pathogens in as little as 3 h after isolation of pure colonies and does not require post-PCR sample manipula-tion for HRM analysis, and ScreenClust analysis easily distinguishesblaKPC-2-likeandblaKPC-3-likealleles. Therefore, this assay is a rapid method to identify the presence ofblaKPCenzymes in Gram-negative pathogens that can be easily integrated into busy clin-ical microbiology laboratories.
T
he increased prevalence in antibiotic resistant Gram-negative pathogens poses a threat to public health. Of particular con-cern are pathogens that are resistant to the carbapenems, since these-lactams are often used as the last treatment option for infections with multidrug-resistant organisms. Klebsiella pneu-moniaecarbapenemase (KPC)-producing organisms have been reported worldwide and are endemic in certain regions, such as New York City, Puerto Rico, Israel, and Greece (1). These enzymes are associated most often withKlebsiella pneumoniae but have been identified in other genera ofEnterobacteriaceae, such as Esch-erichia coliandEnterobacterspp., as well asPseudomonas aerugi-nosaandAcinetobacter baumannii(2). Infections with KPC-pro-ducing organisms are associated with mortality rates ranging from 27.5 to 57% (3,4,17). These high mortality rates may be due in part to inappropriate or inadequate antimicrobial therapy due to the inability to detect carbapenem resistance in these strains using current susceptibility methods.The use of molecular based assays has become more prevalent in today’s clinical microbiology laboratories to decrease turn-around time, as well as increase the sensitivity and specificity of detection for a specific organism and/or resistance mechanism (5). There are molecular assays for the detection ofblaKPC avail-able, but these often require specialized equipment and expensive reagents (3,6–8). Moreover, no existing assay is able to differen-tiate betweenblaKPC-2-like(including alleles 2, 4, 5, 6, 11, and 12) andblaKPC-3-like(including alleles 7, 8, 9, 10, and 13) genes without direct sequencing or digestion of the amplified product with re-striction enzymes (7). Although the identification of the specific KPC allele will not modify specific treatment options, differenti-ation can be useful for infection control and epidemiological
stud-ies. Incorporating new advances in instrumentation, detection software, and fluorescent dyes, several recent studies have de-tected and identified bacterial species and antibiotic resistance mechanisms that utilize high-resolution melting (HRM) analysis (9–11). Another advance in HRM analysis is to statistically quan-tify the differences between amplicons, which we have done using Rotor-Gene ScreenClust HRM software, making interpretation of test results extremely easy and reliable (12). Our objective was to develop a PCR-based assay that would rapidly identify the pres-ence ofblaKPCin addition to differentiating between the two most prevalent gene variant groups,blaKPC-2-likeandblaKPC-3-like, using HRM analysis in a single closed reaction.
MATERIALS AND METHODS
Bacterial strains.To develop and validate this assay, 125 previously char-acterized strains of Gram-negative pathogens that produced various
-lactamases and 14 isolates designated as wild type (either non- -lacta-mase-producing strains or strains producing chromosomal-lactamases but susceptible to oxyimino-cephalosporins and carbapenems) were tested (Table 1). The-lactamases produced in these organisms included class A carbapenemases (KPC, SME, NMCA, and OXA), metallo- -lac-tamases (IMP, VIM, NDM, GIM, and SPM), ESBLs (TEM, SHV,
CTX-Received15 August 2012 Returned for modification7 September 2012
Accepted10 October 2012
Published ahead of print17 October 2012
Address correspondence to Nancy D. Hanson, [email protected]. Copyright © 2013, American Society for Microbiology. All Rights Reserved.
doi:10.1128/JCM.02193-12
on May 16, 2020 by guest
http://jcm.asm.org/
M-15, and CTX-M-14), andampC-lactamases (chromosomal, plasmid encoded CMY-2, DHA, and FOX). The identification of these known
-lactamases was determined using the following techniques: endpoint PCR using gene specific primers, direct sequencing of the-lactamase gene, isoelectric focusing, and/or phenotypic methods (i.e., disk diffusion assays). During the validation of this assay, 27 additional isolates were submitted to our laboratory for KPC-specific PCR testing. When screened at the referring laboratories, these 27 isolates demonstrated positive or weak positive results with the modified Hodge test (MHT), which is rec-ommended for screening potential KPC-producing isolates by the Cen-ters for Disease Control and Prevention (13). Real-time positive KPC PCR results were confirmed by endpoint KPC-specific PCR as previously de-scribed (14).
DNA isolation.Strains were inoculated on blood agar media and in-cubated for 18 h at 37°C. DNA was extracted from 2 ml of an overnight bacterial culture grown in Luria-Bertani (LB) broth or a 1.0 McFarland suspension in LB broth made of colonies grown on a blood agar plate using the DNeasy Blood & Tissue kit (Qiagen, Valencia, CA) and eluted with 100l of AE buffer according to recommendations of the manufac-turer.
Development of real-time PCR assay with HRM analysis.In order to detectblaKPCand differentiate between variousblaKPCalleles, a single set of primers were designed that amplified a 189-bp region that flanked the nucleotide positions 716, 814, and 843 (Table 2). Real-time PCR and HRM analysis were performed in 25-l reaction volumes using the Rotor-Gene Q (Qiagen). Each reaction volume contained 8l of sterile water, 12.5l of 2⫻HRM PCR master mix (Qiagen), 0.7M concentrations of the primers KPC F9 (5=-GCAGACTGGGCAGTCGG-3=) and KPC 4R (5=-GACTCGCGGTCGAGGGATTG-3=), and 1 l of template DNA (⬃25 pg). Negative control reactions that lacked DNA template were included in each PCR run. The PCR was performed using the following conditions: initial denaturation at 95°C for 5 min, followed by 30 cycles of denaturation (95°C for 10 s), annealing (55°C for 30 s), and extension (72°C for 10 s). To ensure the accuracy of amplification, all generated amplicons were separated by agarose gel electrophoresis in a 2% (wt/vol) agarose gel, stained with ethidium bromide, and visualized on a UV tran-silluminator.
After amplification, HRM analysis and genotyping were performed by detecting the fluorescent signal during a temperature rise of 0.1°C incre-ments from 84 to 90°C. The Rotor-Gene Q operating software was used to determine the results. After the normalization of the raw data, the fluo-rescence signal intensity was plotted on theyaxis, and the temperature
was plotted on thexaxis. The melting temperature (Tm) of each sample was the temperature at which 50% of the amplified product was dissoci-ated into single-stranded DNA for that sample, which was visualized as a decrease in fluorescence as the EvaGreen dye was released. HRM geno-types were determined by establishing one previously sequencedblaKPC-2
and oneblaKPC-3sample as the reference genotypes in each run. TheirTms were calculated and used as reference values for determining whichblaKPC
allele was present in the amplified products of the other samples. These
blaKPC-2orblaKPC-3referenceTms were then subtracted from the normal-ized value of each test sample and plotted on theyaxis. Samples with a vertical shift in fluorescence intensity within an 80% confidence interval (CI) of either theblaKPC-2orblaKPC-3reference sample were genotyped as
blaKPC-2-likeorblaKPC-3-like, respectively.
ScreenClust HRM analysis.In order to standardize the interpretation process, the HRM results from each PCR run were analyzed with the ScreenClust HRM software (Qiagen, Hilden, Germany). First, HRM curves were normalized to decrease the differences in raw fluorescence between samples. After normalization, a residual plot was then created by subtracting the differentiated curves from a median of all of the curves. Principal components (PCs) were then able to be determined based on the residual plots. A single PC is the most varied combination of data among the samples in a single run. Second and third PCs were then generated to account for the remaining variability in the data.
The ScreenClust HRM software enables the user to analyze data in either a supervised or unsupervised mode, where the former requires known positive genotype controls, and the latter is meant forde novo
single nucleotide polymorphism (SNP) discovery. We validated this assay using known controls and therefore used the supervised mode with a minimum of twoblaKPC-2andblaKPC-3controls for each PCR run. Once the positive controls are identified, the remaining unknown samples are sorted using linear discriminant analysis, which calculates cluster distri-bution.
Verification ofblaKPCallele by direct sequence analysis.To verify that the differentiation betweenblaKPC-2-likeandblaKPC-3-likegenes using HRM and ScreenClust were true to the specific allele, direct sequencing of theblaKPCwas performed on amplified products from a subset of 21 clinical isolates as previously described (14). Sequence analysis was per-formed using the DNA Baser version 2.75 software program (Heracle Software, Lilienthal, Germany).
RESULTS
Detection ofblaKPCby real-time PCR using characterized iso-lates.The primary purpose for developing this assay was to detect the presence ofblaKPCby real-time PCR. Fluorescence as a result of PCR amplification was visualized using the Rotor-Gene Q
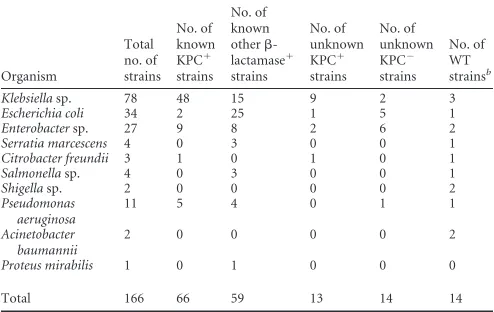
Se-TABLE 1Clinical isolates used during the validation processa
Organism Total no. of strains No. of known KPC⫹ strains No. of known other -lactamase⫹ strains No. of unknown KPC⫹ strains No. of unknown KPC⫺ strains No. of WT strainsb
Klebsiellasp. 78 48 15 9 2 3
Escherichia coli 34 2 25 1 5 1
Enterobactersp. 27 9 8 2 6 2
Serratia marcescens 4 0 3 0 0 1
Citrobacter freundii 3 1 0 1 0 1
Salmonellasp. 4 0 3 0 0 1
Shigellasp. 2 0 0 0 0 2
Pseudomonas aeruginosa
11 5 4 0 1 1
Acinetobacter baumannii
2 0 0 0 0 2
Proteus mirabilis 1 0 1 0 0 0
Total 166 66 59 13 14 14
a
Known strains were previously characterized for possessing specific-lactamases and were used for initial assay validation. Unknown isolates were tested after initial assay validation between May 2011 and February 2012.
bNon--lactamase-producing strains or strains producing chromosomal-lactamases
[image:2.585.40.287.78.234.2]but susceptible to oxyimino-cephalosporins and carbapenems.
TABLE 2In silicoandin vitro Tmanalysis of the 189-bp amplicon for 12
blaKPCalleles
KPC
Nucleotide at positiona: T m(°C)
716 814 843 Predictedb
Actualc
KPC-2 T C A 87.6 87.2
KPC-3 T T A 87.3 86.9
KPC-4 G C A 87.7 ND
KPC-5 T C A 87.6 87.2
KPC-6 G C A 87.7 ND
KPC-7 T T A 87.3 ND
KPC-8 G T A 87.3 ND
KPC-9 C T A 87.6 ND
KPC-10 T T A 87.3 ND
KPC-11 T C A 87.6 ND
KPC-12 T C A 87.6 ND
KPC-13 T T G 87.4 ND
aThe nucleotide position in comparison to GenBank accession number EU176012.
b
The predictedTmusing a web-based oligonucleotide calculator (http://www.basic .northwestern.edu/biotools/oligocalc.html).
c
TheTmobserved in this assay. ND, not determined.
on May 16, 2020 by guest
http://jcm.asm.org/
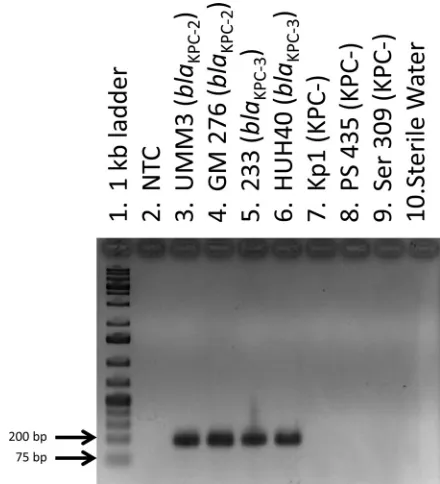
[image:2.585.298.545.87.208.2]ries software (Qiagen) over the course of 30 three-step cycles for each sample, and the cycle threshold (CT) of each sample was determined by establishing an arbitrary threshold of fluorescence detection (between 1.5 and 1.7 normalized fluorescence units). A total of 66 known KPC-producing isolates hadCTs between 12 and 22; 73 isolates that were negative for KPC production hadCTs of⬎29 and were thus interpreted as having a negative result for the presence ofblaKPC(Table 3). Analysis of the amplified prod-ucts by agarose gel electrophoresis from all samples correlated with theCT. No amplified products were detected in samples that hadCTs of⬎29, and samples that hadCTs between 12 and 22 had bands of the expected amplified product size of 189 bp (Fig. 1).
Detection ofblaKPCby real-time PCR using uncharacterized isolates.Following validation of the KPC HRM assay, an addi-tional 27 clinical isolates that demonstrated positive or weakly positive MHT results were also screened for the presence ofblaKPC (Table 1). Of these isolates, 13 were positive for the presence of
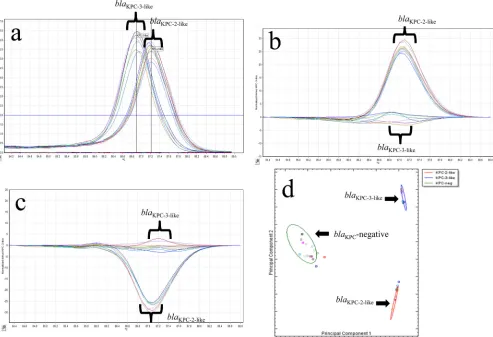
blaKPC(averageCT⫽17.8) and 14 were KPC negative (CT⬎29). Differentiation ofblaKPC-2-likeandblaKPC-3-likegene variants by HRM curve analysis.In addition to determining the presence ofblaKPC, we sought to differentiate between the two most com-monblaKPCalleles in the United States,blaKPC-2andblaKPC-3, by using HRM curve analysis of the amplified products. The fluores-cence levels for each of the 79 KPC-producing samples were nor-malized after the removal of background fluorescence, and the decrease was plotted against increasing temperature increments of 0.1°C in a dissociation curve. These results from the first set of PCR samples tested are shown inFig. 2. A signal/noise ratio dif-ference was then calculated for each sample in comparison to two reference samples, one forblaKPC-2-likeproducers and the other for blaKPC-3-likeproducers.
The 66 KPC-producing organisms tested each had a single dominant peak generated by melting curve analysis that fell into one of two distinct melting temperature ranges (Fig. 2a). The pres-ence of ablaKPC-2-likegene was detected in 26 strains with a melting temperature range of 87.08 to 87.32°C, whereas 40 strains had a melting temperature range of 86.8 to 86.95°C, indicating the pres-ence of theblaKPC-3-likegene. There was no amplification in the 73 known KPC-negative isolates by PCR (CT⬎29), and no peaks were observed in melting curve analysis (⬍1 on the plot of fluo-rescence and time derivatives [dF/dT] against temperature).
Of 27 unknown isolates that demonstrated positive or weak positive results with the MHT, 13 were KPC positive by PCR, 6 hadblaKPC-2-like Tms, and 7 hadblaKPC-3-likeTms. Although the other 14 unknown isolates also showed positive or weakly positive MHT results, these isolates were negative for KPC using this assay and other previously validated endpoint KPC-specific PCRs
avail-able in our laboratory (14). The mechanisms of resistance in 11 of these isolates remain unresolved. However, threeE. coliisolates were positive for theblaCMY-2-likegene (data not shown), which when combined with a loss of the porin OmpF has been shown to result in decreased susceptibility to ertapenem (15).
Differentiation ofblaKPC-2-likeandblaKPC-3-likegene variants by HRM genotyping analysis.In order to fully utilize the Rotor-Gene Q’s HRM capabilities, we also differentiated the presence of
blaKPC-2-likeandblaKPC-3-like genes by genotyping. The resulting difference plots for theblaKPC-2-likeorblaKPC-3-likegenes are shown inFig. 2b andc, respectively. PS28, which carried theblaKPC-5 gene, was correctly identified as being positive for ablaKPC-2-like gene with aTmof 87.2. There was one isolate (Kp324) that was positive for the presence ofblaKPCand had aTmof 86.88, which suggested that it encoded theblaKPC-3gene. This sample was un-able to be genotyped initially asblaKPC-3-likebecause its curve on the HRM difference plot was outside the 80% CI cutoff we estab-lished for this assay. Upon repeat testing, this was resolved, and Kp324 was correctly genotyped as encoding theblaKPC-3-likegene. Quantitative genotyping using ScreenClust HRM software.
To successfully implement an assay into the clinical microbiology laboratory, the results must be easy to interpret. Current software for both traditional melting curve and HRM analyses are not able to quantify differences between genotypes using statistical analy-sis. To overcome this limitation, we chose to use the Rotor-Gene ScreenClust HRM software, which statistically genotyped our samples into one of three clusters (KPC negative,blaKPC-2-like, and blaKPC-3-like). The results are displayed in both a spreadsheet ( Ta-ble 4) and cluster plot (Fig. 2d). The spreadsheet identifies the cluster for each sample sorted, the typicality (i.e., how well the sample sorted into that cluster), and the probabilities of that
[image:3.585.42.287.97.170.2]sam-FIG 1Agarose gel electrophoresis of amplified products generated using real-time PCR. Lane 1, 1-kb molecular-weight ladder; lane 2, no template control (NTC); lanes 3 to 6, amplified products from KPC-producing test isolates; lanes 7 to 9, amplified products from KPC-negative isolates; lane 10, water-only control.
TABLE 3Sensitivity and specificity of HRM and ScreenClust analyses for the presence ofblaKPCand differentiation ofblaKPC-2-likeand
blaKPC-3-likegene variants
Parameter Presence ofblaKPC
a
Variantsb
blaKPC-2-like blaKPC-3-like
Tm⫾SD (°C) 87⫾0.17 87.2⫾0.03 86.8⫾0.03
No. of tested strains 66 14 17
Sensitivity (%) 66/66 (100) 14/14 (100) 17/17 (100) Specificity (%) 73/73 (100) 17/17 (100) 14/14 (100)
a
Compared to previous characterization by endpoint PCR.
bCompared to direct sequencing ofblaKPCgene in a subset of 31 isolates.
on May 16, 2020 by guest
http://jcm.asm.org/
[image:3.585.309.529.432.674.2]ple being sorted into one of the three clusters correctly. The cluster plot shows each sample as a distinct colored square with a color-coded ellipse that designates to which cluster the samples belong. ScreenClust correctly identified all 87 of the KPC-negative sam-ples into the KPC-negative cluster. ScreenClust also correctly clus-tered 32 and 47 isolates previously identified as being in the
blaKPC-2-likeandblaKPC-3-likeclusters, respectively.
[image:4.585.47.540.69.406.2]Verification ofblaKPC-2-likeandblaKPC-3-likeTms and Screen-Clust results by direct sequencing.Of the 66 previously charac-terized KPC-producing Gram-negative organisms that were tested in this assay, direct sequencing of theblaKPCgene was per-formed on 10 isolates (8). Using ScreenClust analysis, five samples were identified asblaKPC-2-like; four isolates carriedblaKPC-2, and 1 isolate carriedblaKPC-5. The five samples identified asblaKPC-3-like all carriedblaKPC-3. To further validate both the HRM and Screen-Clust results, theblaKPCgene was sequenced from an additional 21 isolates (Table 3). Nine isolates had an averageTmof 87.2°C⫾ 0.03°C; these were shown to encode KPC-2. Another 12 isolates had an averageTm of 86.8°C ⫾0.03°C, and sequence analysis verified that these isolates carriedblaKPC-3.
TABLE 4ScreenClust HRM analysis cluster, typicality, and probability results
ID Isolate Clustera Typicalityb
Posterior probabilityc
KPC-2-like KPC-3-like KPC negative
15 Entb247 KPC negative 0.40697278 0.0000 0.0000 1.0000 16 Kleb225 KPC negative 0.58822841 0.0000 0.0000 1.0000 17 UMM3 KPC-2-like 0.62458202 1.0000 0.0000 0.0000 18 233 KPC-3-like 0.64076957 0.0000 1.0000 0.0000 19 Kleb352 KPC-2-like 0.41996172 1.0000 0.0000 0.0000 20 Ec351 KPC-2-like 0.91755836 1.0000 0.0000 0.0000 21 236 KPC-3-like 0.29703921 0.0000 1.0000 0.0000
aThe genotype result for a sample.
b
The typicality measures how well a sample falls within the cluster for which it has been classified.
c
The probability of each sample fitting into a particular cluster is given as a value from 0 to 1. The sum of all probability values for a single sample is 1. Each sample is called into the cluster with the highest probability. Samples with a probability of less than 0.7 of belonging to a particular cluster should be treated with caution.
FIG 2(a) Representative melting curves for 17 isolates withblaKPC-2-likeandblaKPC-3-likegenotypes using single-tube analysis ofblaKPCreal-time PCR with HRM.
The⫺dF/dT (negative first derivative of the change in fluorescence) is shown on theyaxis, and the temperature shown on thexaxis. (b) Representative difference graph of 10 KPC-2-like-producing isolates compared to 7 KPC-3-like-producing isolates using single-tube analysis ofblaKPCreal-time PCR with HRM. The
relative fluorescence units compared to the genotype control are shown on theyaxis; the temperature is shown on thexaxis. (c) Representative difference graph of 7 KPC-3-like-producing isolates compared to 10 KPC-2-like-producing isolates using single-tube analysis ofblaKPCreal-time PCR with HRM. The relative
fluorescence units compared to the genotype control are shown on theyaxis; the temperature is shown on thexaxis. (d) Cluster plot showing the differentiation of 17 isolates positive for KPC-2-like (red oval) or KPC-3-like (blue oval) and 16 KPC-negative samples (green oval) generated by the Rotor-Gene ScreenClust HRM software.
on May 16, 2020 by guest
http://jcm.asm.org/
[image:4.585.41.287.548.661.2]DISCUSSION
Combination therapy is warranted when patients are infected with KPC-producing organisms (16). Therefore, rapid and accu-rate detection of KPC-producing Gram-negative organisms in the clinical laboratory is paramount in directing appropriate therapy and preventing dissemination. Conventional phenotypic assays to screen and identify these organisms are time-consuming and can be difficult to interpret. Therefore, we developed a rapid assay to detect the presence ofblaKPC, as well as differentiate between the two most prevalentblaKPCgene variants on one analyzer without downstream sample manipulation.
This KPC HRM assay demonstrated 100% specificity and sen-sitivity for the detection ofblaKPCsince we were able to detect blaKPCin all of our previously characterized KPC-positive isolates while avoiding any false positives from the 73 previously charac-terized KPC-negative isolates. For the differentiation of the two most prevalentblaKPCgene variants, we compared the melting-curveTms, HRM genotyping, and ScreenClust genotypes to direct sequencing results. The differentiation ofblaKPC-2andblaKPC-3 genes in 31 isolates by HRM using all three analyses had 100% sensitivity and specificity compared to direct sequencing of the
blaKPCgene. However, utilization of the ScreenClust software gave the most easily interpreted results, supported by quantitative mea-surements (i.e., cluster typicalities and probabilities for each sam-ple). For this reason, we consider its incorporation to be the opti-mal analytical tool regarding this assay.
A common concern when introducing a molecular assay into the clinical laboratory is the expense. This assay takes advantage of the Rotor-Gene Q’s ability to perform both the PCR and HRM analysis on a single analyzer without additional equipment. In addition, the Type-It HRM master mix has also been optimized for use on the LightCycler 480 analyzer. The total cost of supplies required for this assay from template preparation to PCR and HRM analysis is⬃$5 per sample.
The turnaround time from the isolation of individual colonies to PCR and HRM results in the present study was 24 h when inoculated broth medium grown overnight for template prepara-tion was used. This turnaround time was decreased to⬍3 h with the preparation of template made directly from isolated colonies in RNase-free, DNase-free sterile water. The desired template preparation method should be determined for each individual laboratory and standardized using control strains for implemen-tation of this assay.
In conclusion, we have demonstrated that this assay reliably detects the presence ofblaKPCand can differentiate between the two most prevalentblaKPCgene variants. This assay is cost-effec-tive, is simple to set up, and provides rapid results that require little interpretation. These characteristics allow for easy incorpo-ration into the workflow of a clinical microbiology or reference laboratory to aid in the identification of KPC-producing Gram-negative organisms.
ACKNOWLEDGMENTS
We thank Kenneth Thomson and Stephen Cavalieri for the clinical iso-lates used in this study. We also thank Qiagen for providing the Rotor-Gene Q analyzer, the Rotor-Rotor-Gene Q software, and the ScreenClust HRM software for laboratory use.
REFERENCES
1.Cuzon G, Naas T, Truong H, Villegas MV, Wisell KT, Carmeli Y, Gales AC, Venezia SN, Quinn JP, Nordmann P.2010. Worldwide diversity of
Klebsiella pneumoniaethat produce beta-lactamaseblaKPC-2gene. Emerg.
Infect. Dis.16:1349 –1356.
2.Davies TA, Marie Queenan A, Morrow BJ, Shang W, Amsler K, He W, Lynch AS, Pillar C, Flamm RK.2011. Longitudinal survey of carbapenem resistance and resistance mechanisms inEnterobacteriaceae and non-fermenters from the U.S.A. in 2007– 09. J. Antimicrob. Chemother.66: 2298 –2307.
3.Mangold KA, Santiano K, Broekman R, Krafft CA, Voss B, Wang V, Hacek DM, Usacheva EA, Thomson Richard B, Jr, Kaul KL, Peterson LR.2011. Real-time detection ofblaKPCin clinical samples and
surveil-lance specimens. J. Clin. Microbiol.49:3338 –3339.
4.Woodford N, Tierno Philip M, Jr, Young K, Tysall L, Palepou MI, Ward E, Painter RE, Suber DF, Shungu D, Silver LL, Inglima K, Kornblum J, Livermore DM.2004. Outbreak ofKlebsiella pneumoniae
producing a new carbapenem-hydrolyzing class A beta-lactamase, KPC-3, in a New York medical Center. Antimicrob. Agents Chemother.48:4793– 4799.
5.Espy MJ, Uhl JR, Sloan LM, Buckwalter SP, Jones MF, Vetter EA, Yao JDC, Wengenack NL, Rosenblatt JE, Cockerill FR, III, Smith TR.2006. Real-time PCR in clinical microbiology: applications for routine labora-tory testing. Clin. Microbiol. Rev. 19.1:165–256.
6.Chen L, Chavda KD, Mediavilla JR, Zhao Y, Fraimow HS, Jenkins SG, Levi MH, Hong T, Rojtman AD, Ginocchio CC, Bonomo RA, Kre-iswirth BN.2012. Multiplex real-time PCR for detection of an epidemic KPC-producingKlebsiella pneumoniaeST258 Clone. Antimicrob. Agents Chemother.56:3444 –3447.
7.Cole JM, Schuetz AN, Hill CE, Nolte FS. 2009. Development and evaluation of a real-time PCR assay for detection ofKlebsiella pneumoniae
carbapenemase genes. J. Clin. Microbiol.47:322–326.
8.Hindiyeh M, Smollen G, Grossman Z, Ram D, Davidson Y, Mileguir F, Vax M, Ben David D, Tal I, Rahav G, Shamiss A, Mendelson E, Keller N.2008. Rapid detection ofblaKPCcarbapenemase genes by real-time
PCR. J. Clin. Microbiol.46:2879 –2883.
9.Chromá M, Hricová K, Koláø M, Sauer P, Koukalová D.2011. Using newly developed multiplex polymerase chain reaction and melting curve analysis for detection and discrimination of-lactamases inEscherichia coliisolates from intensive care patients. Diagn. Microbiol. Infect. Dis.
71:181–191.
10. Mendes RE, Kiyota KA, Monteiro J, Castanheira M, Andrade SS, Gales AC, Pignatari ACC, Tufik S.2007. Rapid detection and identification of metallo-beta-lactamase-encoding genes by multiplex real-time PCR assay and melt curve analysis. J. Clin. Microbiol.45:544 –547.
11. Yang S, Ramachandran P, Rothman R, Hsieh Y, Hardick A, Won H, Kecojevic A, Jackman J, Gaydos C.2009. Rapid identification of bio-threat and other clinically relevant bacterial species by use of universal PCR coupled with high-resolution melting analysis. J. Clin. Microbiol.
47:2252–2255.
12. Reja V, Kwok A, Stone G, Yang L, Missel A, Menzel C, Bassam B.2010. ScreenClust: advanced statistical software for supervised and unsuper-vised high resolution melting (HRM) analysis. Methods50:S10 –S14. 13. Clinical and Laboratory Standards Institute.2009. Methods for dilution
antimicrobial susceptibility tests for bacteria that grow aerobically, 6th ed. Approved standard M7-A6, vol 28. Clinical and Laboratory Standards Institute, Wayne, PA.
14. Roth AL, Kurpiel PM, Lister PD, Hanson ND. 2011. blaKPC RNA
expression correlates with two transcriptional start sites but not always with gene copy number in four genera of Gram-negative pathogens. An-timicrob. Agents Chemother.55:3936 –3938.
15. Yan JJ, Wu JJ, Lee CC, Ko WC, Yang FC.2010. Prevalence and charac-teristics of ertapenem-nonsusceptibleEscherichia coliin a Taiwanese uni-versity hospital, 1999 to 2007. Eur. J. Clin. Microbiol. Infect. Dis.29:1417– 1425.
16. Zarkotou O, Pournaras S, Tselioti P, Dragoumanos V, Pitiriga V, Ranellou K, Prekates A, Themeli-Digalaki K, Tsakris A.2011. Predictors of mortality in patients with bloodstream infections caused by KPC-producingKlebsiella pneumoniaeand impact of appropriate antimicrobial treatment. Clin. Microbiol. Infect.17:1798 –1803.
17. Won SY, Munoz-Price L, Lolans K, Hota B, Weinstein RA, Hayden MK.2011. Emergence and rapid regional spread ofKlebsiella pneumoniae
carbapenemase-producingEnterobacteriaceae. Clin. Infect. Dis.53:532– 540.