III. RESEARCH METHOD
This chapter consist of research design, population and sample of the research,
research procedures, data collecting technique, instrument of the research,
instrument of the try out, scoring system, data analysis, and hypothesis testing.
Each of these points is described in detail as follows:
3.1 Research Design
This research conducted with the aim to find out whether there is any significant
increase of students’ vocabulary achievement after being taught by using
substitution and cued response drills. This research is a quantitative study. Hatch
and Farhady (1982) state that quantitative is a kind of research in which the data
used tend to use statistics as measurement in deciding the conclusion. The design
of this research is one group pretest posttest design and represented as follows:
T1 X T2
T1 : pre-test
X : treatment
T2 : post-test
The researcher took one class as experimental class, VII C. Pretest administered
before treatments and posttest conducted after treatments. The goal of pretest and
posttest is to see whether there is any significant increase in students’ vocabulary
achievement. Substitution and cued response drills was used as teaching
techniques on the treatments.
3.2 Population and Sample of the Research
The population of the research is grade seven students of SMP Negeri 10 Bandar
Lampung. There are six classes in first grade in 2012/2013 school year. Each class
consists of 30-40 students. The researcher selected one class, VII C as the subject
of the research. In this research, the researcher used simple random probability
sampling by lottery (Setiyadi, 2006: 39).
3.3 Research Procedures
The procedures of this research are as follows:
1. Determining the population and selecting sample.
The population of this research was the first grade students of SMP Negeri 10
Bandar Lampung. The sample of this research was VII C which consists of 38
students.
2. Administering the try-out.
Try out administered with the aim to know the quality of its test and to
determine the items that should be omitted for pre-test and post-test. The time
3. Administering the pre test
Pre-test was administered to measure the students’ mastery of vocabulary
before treatments. The time allocation of pretest is 90 minutes with 40
questions.
4. Conducting the treatment.
After giving pre test, the students were given three times treatments by using
substitution and cued response drills.
5. Administering the post test.
The post-test administered after treatments. The post-test was conducted in 90
minutes with 40 questions.
6. Analyzing the data.
The data was computed through SPSS version 17.0.
3.4 Data Collecting Technique
The instrument of the research is an objective English vocabulary test in the form
of multiple choice items. The researcher gave pre-test and post-test as the
measurement of English vocabulary achievement. The test held before (pre-test)
and after the treatment (post-test).
1. Pre test
The pretest conducted before the treatments. The aim was to reveal the
students’ vocabulary achievement before the treatments. The researcher used
the objective test of the multiple choices for pretest. The time allocation of this
2. Post test
The posttest conducted after the students got treatments. The researcher used
the objective test in form of multiple choices for posttest. The time allocation
of this test was 90 minutes.
3.5 Instrument of the Research
The research instrument is vocabulary test in the form of objective test, multiple
choice. In this research, the researcher administered three kinds of the test; try out
test, pre-test, and post-test.
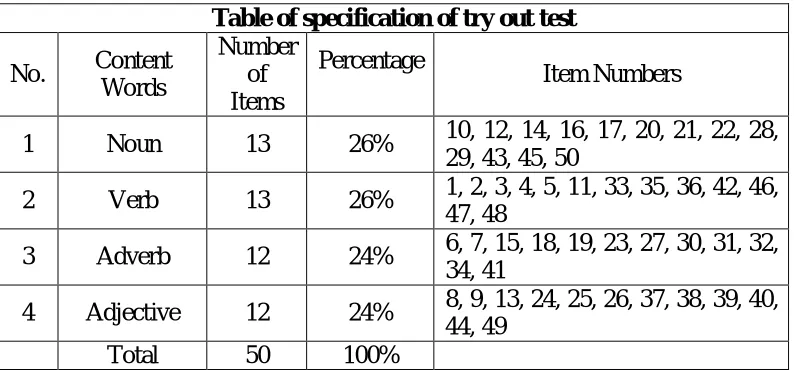
The total number of the items of the try out is 50 items, and the total number of
the items for pretest and posttest was determined from the result of the try out test.
In the three of the test contained content words, consist of nouns, verbs, adverbs,
and adjectives. The content of try out test was presented in the table specification
[image:4.595.115.512.525.710.2]below:
Table 1. Table of Specification of Try Out Test
Table of specification of try out test
No. Content Words
Number of Items
Percentage
Item Numbers
1 Noun 13 26% 10, 12, 14, 16, 17, 20, 21, 22, 28,
29, 43, 45, 50
2 Verb 13 26% 1, 2, 3, 4, 5, 11, 33, 35, 36, 42, 46, 47, 48
3 Adverb 12 24% 6, 7, 15, 18, 19, 23, 27, 30, 31, 32, 34, 41
4 Adjective 12 24% 8, 9, 13, 24, 25, 26, 37, 38, 39, 40, 44, 49
3.6 Instrument of the Try Out
In this research, try out is an important thing. It measures the students’ mastery of
vocabulary before the students got pretest and posttest. The researcher conducted
try out test in try out class that was VII B. The number of the students in this class
was 40 students consisting 26 females and 14 males.
The try out test can be said have a good quality if it has a good validity, reliability,
level of difficulty, and discrimination power.
3.6.1 Validity of The Test
The validity of a test is the extent to which it measures what it is supposed to
measure and nothing else (Heaton, 1975: 159). Every test, whether it be a
short, informal classroom test or public examination, should be as valid as
constructor can make it. The test must aim to provide a true measure of the
particular skill which it is intended to measure (Heaton, 1975: 159). There are
four kinds of validity, but in this research, the researcher used two of them,
content validity and construct validity.
3.6.1.1 Content validity
Content validity is concerned with whether the test is sufficiently
representative and comprehensive for the test. The test should be so
constructed as to contain a representative sample of the course (Heaton,
1975: 160). Researcher used the vocabulary that is supposed to be
researcher arranged the instrument related to which is content words
because content words can cover the material. The material is
vocabulary of occupation, contain: noun, verb, adjective, and adverb.
The content of pre test and post test were presented in the table
specification below:
[image:6.595.113.513.261.458.2] [image:6.595.113.513.516.710.2]Table 2. Table Specification of Pre test
Table of specification of pre test
No. Content Words Number of Items Percentage Item Numbers
1 Noun 11 27.5% 4, 8, 10, 12, 13, 16, 17, 18, 24, 37, 40
2 Verb 7 17.5% 1, 3, 9, 28, 30, 31, 38
3 Adverb 11 27.5% 6, 7, 11, 14, 20, 21, 22, 32, 33, 34, 39
4 Adjective 11 27.5% 2, 5, 15, 19, 23, 25, 26, 27, 29, 35, 36
Total 40 100%
Table 3. Table Specification of Post test
Table of specification of pre test
No. Content Words Number of Items Percentage Item Numbers
1 Noun 11 27.5% 2, 6, 8, 11, 13, 17, 24, 28, 35, 38, 40
2 Verb 7 17.5% 3, 5, 16, 21, 23, 26, 36
3 Adverb 11 27.5% 7, 9, 12, 14, 19, 27, 29, 30, 31, 32, 39
4 Adjective 11 27.5% 1, 4, 10, 15, 18, 20, 22, 25, 33, 34, 37
3.6.1.2 Construct validity
According to Setiyadi (2006: 26) if the instrument just measures one
aspect, for example vocabulary, the construct validity can be measured
by evaluating all items in the test. If all items have measured vocabulary
mastery, this instrument would have fulfilled construct validity.
3.6.2 Reliability of The Test
Reliability is a necessary characteristic of any good test: for it to be valid at
all, the test must first be reliable as a measuring instrument (Heaton, 1975:
162). Reliability is a consistency of a measurement or how far that
measurement can be measured the similar subjects in different time but
showed the same result (Setiyadi, 2006: 16).
Knowing the reliability of the half of the test, Arikunto’s formula was used to
get the result of the computation of try out test. After the researcher had
obtained the reliability of half of its test, the researcher used Spearman
Browns Prophecy formula to determine the reliability of the whole test (Hatch
and Farhady, 1982:246).
Where :
r : coefficient of reliability between odd numbers and even numbers items
x : total numbers of odd numbers items
y : total numbers of even numbers items
2 2 2 2
n : numbers of students who take part in the test
x2 : square of x
y2 : square of y
∑x : total score of odd number items
∑y : total score of even number items
( Arikunto, 2002: 157 in Sahlan 2012: 30)
The criteria of reliability:
0.80 – 1.00 : very high
0.60 – 0.79 : high
0.40 – 0.59 : average
0.20 – 0.39 : low
0.00 – 0.19 : very low
To compute the coefficient correlation of the whole items, the researcher used
Spearman Brown Prophecy formula.
rk : reliability of a full test
rl : reliabilty of half test
the criteria of reliability are:
0.90 – 1.00 : high
0.50 – 0.89 : moderate
0.00 – 0.49 : low
(Hatch and Farhady, 1982: 246) rl
rl rk
The result of the computation by using Arikunto’s formula showed that
reliability of the half test (rxy) was 0.78 (See Appendix 11). Using Spearman
Browns Prophecy Formula, it was found that the reliability of the whole of the
test (rk) was 0.87 (See Appendix 11). Based on the criteria of the reliability,
the reliability 0.87 belongs to the moderate level. It indicated that data
collecting technique instrument in this research was reliable.
3.6.3 Level Difficulty of the Test
To see the level of difficulty, the researcher used the following formula:
Where :
FV : index number difficulty / level of difficulty
R : numbers of students answers correctly
N : total number of the students
Heaton (1975: 182) states the criteria of the index of difficulty. The criteria
are:
FV< 0.30 : difficult
FV= 0.30 – 0.70 : satisfactory
FV> 0.70 : easy
There were three criteria of level difficulty; easy, satisfactory, and difficult.
The items or the test can be said it was good if the items were not too easy and
difficult. From the test, the data has been analyzed and the computation of this
test (See Appendix 8), it was found that there were 3 items which were less N
than 0.30, it means that the items were difficult. There were 31 items were
more than 0.70 that meant it was easy and 16 items were satisfactory (between
0.30-0.70).
3.6.4 Discrimination Power of the Test
Discrimination power is used to indicate the discrimination of the fail and the
success of the students. To find out the discrimination power the researcher
used the following formula, adapted from Heaton ( 1975: 182):
Where:
DP : discrimination power
U : the proportion of upper group students
L : the proportion of lower group students
N : total number of students
The criteria of discrimation power are:
0.00 – 0.19 : poor
0.20 – 0.39 : satisfactory
0.40 – 0.69 : good
0.70 – 1.00 : excellent
- (negative) : bad items, must be omitted
From the computation of discrimination of try out test (See Appendix 9), it
was found 8 items was poor the discrimination power of them were 0.00 – n
L U DP
0.19. There were 2 items was bad because the discrimination power of both
were negative, 32 items were satisfactory (0.20 – 0.39), 8 items were good
(0.40 – 0.69).
Based on the table of discrimination power (See Appendix 9), there were 10
items were dropped ( 1, 2, 3, 6, 17, 21, 42, 45, 47, 49), 1 item was revised
(13), and 27 items were administered. The researcher took 40 items were
administered in pre-test and post-test.
3.7Scoring System
In scoring the students’ test result, the researcher used Arikunto’s formula. The
scores the pretest and posttest was calculated by using formula as follow:
Where:
S : the score of the test
R : the total of the right answer
N : the total items
( Arikunto, 1997: 212)
3.8 Data Analysis
After conducting pretest and posttest, the researcher analyzed the data. It was used
to know whether there is significant increase of the student’s English vocabulary
achievement.
The researcher examined the students score by using the following steps:
100
1. Scoring pretest and posttest.
2. Calculating the total correct answer of pretest and posttest.
3. Tabulating the score of the student’s English vocabulary test results using
t-test.
4. Drawing conclusion from the tabulated result of the pretest posttest, that is
statistically analyzed by using SPSS ( Statistical Program for Social Sciences)
in order to examine whether increase of the students gain is significant or not.
3.9 Normality Test
Normality test is used to know whether the data in pretest and post test are
distributed normally or not. The hypothesis of the normality test is as follows:
H1 : The data is distributed normally
H0 : The data is not distributed normally
In this research, the criteria for the hypothesis are:
H1 is accepted if level of significance at 0.005 (Sig.>α). Meanwhile, H1 is
rejected if significant value does not exceed level of significance at 0.005.
3.10 Hypothesis Testing
The hypothesis testing is used to see that the hypothesis in this research is
accepted or not and analyzed by using Repeated Measured T-test in order to find
the significance of students’ vocabulary achievement. The hypothesis was
analyzed at the significant level of 0.005 in which the hypothesis is approved if
The hypothesis are:
H1 : There is any significant increase of students’ vocabulary achievement after
being taught by using substitution and cued response drills.
H0 : There is no significant increase of students’ vocabulary achievement after
being taught by using substitution and cued response drills
The criteria for accepting the hypothesis are as follows:
1. If the t-ratio is lower than t-table: H0 is accepted if there is no difference of the
students’ vocabulary achievement after being taught by using substitution and
cued response drills.
2. If the t-ratio is higher than t-table: H1 is accepted if there is any difference of
the students’ achievement after being taught by using substitution and cued