Journal of Criminal Law and Criminology
Volume 79
Issue 1
Spring
Article 3
Spring 1988
Examining Three-Wave Deterrence Models: A
Question of Temporal Order and Specification
Raymond Paternoster
Follow this and additional works at:
https://scholarlycommons.law.northwestern.edu/jclc
Part of the
Criminal Law Commons,
Criminology Commons, and the
Criminology and Criminal
Justice Commons
This Criminology is brought to you for free and open access by Northwestern University School of Law Scholarly Commons. It has been accepted for inclusion in Journal of Criminal Law and Criminology by an authorized editor of Northwestern University School of Law Scholarly Commons.
Recommended Citation
0091-4169/88/7901-135
THE JOURNAL OF CRIMINAL LAW & CRIMINOLOGY Vol. 79, No. 1 Copyright © 1988 by Northwestern University, School of Law Printed in U.S.A.
CRIMINOLOGY
EXAMINING THREE-WAVE DETERRENCE
MODELS: A QUESTION OF
TEMPORAL ORDER AND
SPECIFICATION*
RAYMOND PATERNOSTER**
I. INTRODUCTION
Since its restatement as a perceptual process some fifteen years
ago,I the deterrence doctrine has generated much research interest. There are now over twenty-five published studies in the criminologi-cal literature that test the deterrent effect of the perceived certainty of punishment.2 The bulk of this literature consists of bivariate cross-sectional correlations between respondents' estimates of the certainty of punishment and self-reported involvement in minor forms of crime and delinquency. In general, these studies have found moderately large inverse correlations between the perceived certainty of punishment and various forms of self-reported deviance consistent with the deterrence doctrine.As has often been noted,3 however, such correlations may ex-plain nothing about the deterrent effect of sanction threats. First,
* This research was supported by grants from the National Institute of Justice,
Crime Control Theory Program (81-IJ-CX-0023; 83-IJ-CX-0045). Computer support was generously provided by the Computer Science Center, University of Maryland.
** Associate Professor, University of Maryland Institute of CriminalJustice and
Crim-inology. Ph.D., Florida State University, 1978; B.A., University of Delaware, 1973.
1 Waldo & Chiricos, Perceived Penal Sanction and Self-Reported Criminality: A Neglected
Approach to Deterrence Research, 9 SOC. PROBS. 522 (1972).
2 See, e.g., J. GIBBS, CRIME, PUNISHMENT, AND DETERRENCE (1975); Paternoster, The
Deterrent Effect of the Perceived Certainty and Severity of Punishment: A Review of the Evidence and Issues, 4JusT Q. 173 (1987).
3 Paternoster, Saltzman, Waldo & Chiricos, Estimating Perceptual Stability and Deterrent
Effects: The Role of Perceived Legal Punishment in the Inhibition of Criminal Involvement, 74 J. CRIM. L. & CRIMINOLOGY 270 (1983); Saltzman, Paternoster, Waldo & Chiricos, Deterrent
RAYMOND PA TERNOSTER
even moderately large inverse bivariate correlations between per-ceived certainty and self-reported involvement in deviance may be spurious because they exclude explanatory factors which either gen-erate deviance, such as peer involvement in crime, or inhibit devi-ance, such as moral beliefs condemning rule breaking. Second, the reported cross-sectional correlations usually measure the relation-ship between current perceptions of the certainty of punishment and self-reported criminal activity that occurred in the past. It is not clear from these inverse correlations whether the observed relation-ship measures the effect of perceptions on behavior, which is a de-terrent effect, or the effect of prior behavior on current perceptions, which is an experiential effect.4 The cross-sectional nature of the data, however, argues strongly for the second interpretation, which, in turn, suggests that those who commit offenses usually do so with impunity and subsequently lower their estimate of the risks involved.
More recently, those investigating the deterrence question have tried to overcome the methodological defects of previous studies by employing more fully specified causal models and longitudinal data collection designs.5 In panel studies, respondents are queried about
CRIME & DELINQ. 172 (1982); Silberman, Toward a Theory of Criminal Deterrence, 41 AM. Soc. REV. 442 (1976).
4 It is clear by now that inverse cross-sectional correlations between prior
self-re-ported behavior and current estimates of sanction threats cannot be taken as evidence of a deterrent effect unless perceptions are relatively stable over time. This is particularly true if the sanction threat indicators refer to the risk to one's self rather than a genera-lized other. Recent panel research has suggested that perceptions are not particularly stable, even over short periods of time. In order to emulate longitudinal designs with-out multiple data collection efforts, some researchers have attempted to build the cor-rect temporal order into the measurement process by asking respondents retrospective questions about perceptions or prospective questions about behavior. For a detailed discussion of these methodological issues in perceptual deterrence research, see C.
Trr-TLE, SANCTIONS AND SOCIAL DEVIANCE: THE QUESTION OF DETERRENCE (1980); Bishop,
Deterrence: A Panel Analysis, 1 JuST Q. 311 (1984); Grasmick & Green, Legal Punishment,
Social Disapproval and Internalization as Inhibitors of Illegal Behavior, 71J. CRIM. L. & CRIMI-NOLOGY 325 (1980); Greenberg, Methodological Issues in Survey Research on the Inhibition of
Crime, 72 J. CRIM. L. & CRIMINOLOGY 1094 (1981); Lundman, One-Wave Perceptual
Deter-rence Research: Some Grounds for the Renewed Examination of Cross-Sectional Methods, 23J. RES.
CRIME & DELIN%. 370 (1986); Meier, Burkett & Hickman, Sanctions, Peers and Deviance:
Preliminary Models of A Social Control Process, 25 Soc Q 67 (1984); Minor & Harry, Deterrent
and Experiential Effects in Perceptual Deterrence Research: A Replication and Extension, 19 J. RES.
CRIME & DELINQ. 190 (1982); Paternoster, supra note 2; Paternoster, Saltzman, Waldo & Chiricos, supra note 3; Silberman, supra note 3; Teevan, Subjective Perception of Deterrence
(Continued), 13J. RES. CRIME & DELINQ. 155 (1976).
5 Bishop, Legal and Extralegal Barriers to Delinquency, 22 CRIMINOLOGY 403 (1984);
Meier, Burkett & Hickman, supra note 4; Minor & Harry, supra note 4; Paternoster & lovanni, The Deterrent Effect of Perceived Severity: A Reexamination, 64 Soc. FORCES 751
(1986); Paternoster, Saltzman, Waldo & Chiricos, Perceived Risk and Social Contro" Do
Sanctions Really Deter?, 17 LAw & Soc'y REv. 457 (1983).
19881 EXAMINING THREE-WAVE DETERRENCE MODELS 137
their perceptions of certain punishment at one time and their self-reported behavior during a later period. In this way, the temporal ordering for estimating a deterrent effect is less ambiguous than in cross-sectional studies because researchers can examine the rela-tionship between current perceptions and subsequent behavior. In addition to collecting data on the perceptual properties of punish-ment, recent deterrence researchers have also gathered information on other relevant factors, such as the respondents' moral beliefs,6 informal sanctions,7 and peer involvement in or expressed verbal support for deviance.8 With this more extensive data, researchers have estimated deterrence models that include inhibitory and gener-ative factors in addition to perceptions of formal sanction threats. These models estimate the deterrent effect of sanction threats while simultaneously controlling for one or more other explanatory vari-ables and make the estimated deterrent effect less susceptible to a spuriousness bias.
When researchers have employed these two methodological re-finements, namely, panel data and more fully specified causal mod-els, they generally have failed to find any significant deterrent effect for the perceived certainty of punishment. For example, in fourteen tests of the deterrence doctrine in which the effect of perceived cer-tainty was estimated in a multivariate equation that included at least two other explanatory factors, the deterrent effect on various meas-ures of self-reported subsequent deviance was negligible and was non-significant in twelve.9 Only in the studies reported by Bishop'0 and Grasmick and Green" was the direct effect of perceived cer-tainty both significant and in the theoretically expected direction.
Unfortunately, these latter two studies do not provide
unequiv-6 Bishop, supra note 5; Minor, A Deterrence-Control Theory of Crime, in THEORY IN
CRIM-INOLOGY (R. Meier, ed. 1977); Paternoster & Iovanni, supra note 5; Silberman, supra note 3.
7 Grasmick & Green, supra note 4; Meier &Johnson, Deterrence and Social Contro" The
Legal and Extralegal Production of Conformity, 42 AM. Soc. REV. 292 (1977); Paternoster,
Saltzman, Waldo & Chiricos, supra note 5.
8 R. JOHNSON, JUVENILE DELINQUENCY ANiD ITS ORIGINS (1979); Akers, Krohn,
Lanza-Kaduce & Radosevich, Social Learning and Deviant Behavior: A Specific Test of a
Gen-eral Theory, 44 AM. Soc. REv. 636 (1979); Meier &Johnson, supra note 7; Paternoster &
Tovanni, supra note 5; Silberman, supra note 3.
9 R. JOHNSON, supra note 8; Akers, Krohn, Lanza-Kaduce & Radosevich, supra note 8; Jacob, Deterrent Effects of Formal and Informal Sanctions, 2 LAw PoLicY Q. 61 (1980); Meier &Johnson, supra note 7; Minor, supra note 6; Paternoster & lovanni, supra note 5; Paternoster, Saltzman, Waldo & Chiricos, supra note 3; Piliavin, Gartner, Thornton & Matsueda, Crime, Deterrence and Choice, 51 AM. Soc. REV. 101 (1986); Silberman, supra note 3. For a more detailed review of these studies, see Paternoster, supra note 2.
10 Bishop, supra note 5.
RAYMOND PA TERNOSTER
ocal evidence of a deterrent effect for perceived certainty. In both instances, the estimated equation contained only three independent variables: perceived legal sanctions, perceived informal sanctions, and a measure of moral beliefs. The estimated model, therefore, was likely to have been misspecified, and the estimated effects bi-ased by the exclusion of other important explanatory variables. Per-haps most notable among the excluded variables was a measure of peer support for or involvement in deviance. Peer influence has consistently been found in the literature to be one of the best predictors of one's own involvement in deviance.' 2 In addition, peer involvement and support are probably inversely related to one's own estimate of the certainty of formal legal sanctions, be-cause one's peers have likely committed their offenses without ap-prehension and punishment. The positive effect that peer involvement in crime has on one's own participation and its inverse effect on one's estimate of the certainty of formal sanction could be part of the process producing the negative correlations between the latter two variables reported in the literature.13 Therefore, the
con-12 D. ELLIOTr, D. HUIZINGA & S. AGETON, EXPLAINING DELINQUENCY AND DRUG USE
(1985); R. JOHNSON, supra note 8; Akers, Krohn, Lanza-Kaduce & Radosevich, supra note 8; Burkett &Jensen, Conventional Ties, Peer Influence, and the Fear of Apprehension: A Study of
Adolescent Marijuana Use, 16 Soc. Q. 522 (1975);Jacob, supra note 9; Jensen, Parents, Peers
and Delinquent Action: A Test of the Differential Association Perspective, 78 AM. J. Soc. 562
(1972); Meier, Burkett & Hickman, supra note 4; Meier & Johnson, supra note 7; Pater-noster & Iovanni, supra note 5.
13 This process describes a textbook example of spurious correlation. The following
diagram shows the correlations among self-reported marijuana use (MU), the perceived certainty of punishment for marijuana use (PC), and peer behavior regarding marijuana use (PB). The correlations were calculated with survey data from approximately 1200 high school students for a study described in greater detail in Section II, infra. The indicators of peer use and perceived certainty were measured at one time, and respon-dents' self-reported marijuana use was measured one year later.
PC
.51 N
PB >MU
The zero-order correlations indicate that respondents with peers who are marijuana users and who have had considerable success in avoiding apprehension are less likely to believe that they will get caught if they use marijuana (r = -. 22). Those with mari-juana-using peers at one time are also more likely to use marijuana themselves in the subsequent year (r = .51). The inverse correlation between perceived certainty and self-reported marijuana use is consistent with the deterrence doctrine (r = -. 19). The dashed line is drawn to suggest, however, that part of this correlation is not the result of an inherent causal link between the two variables, but reflects the causal effect on both
1988] EXAMINING THREE-WAVE DETERRENCE MODELS 139
clusions of researchers such as Bishop and Grasmick and Green,14 who interpret inverse correlations between perceived certainty and self-reported deviance as resulting from a causal deterrent effect should be viewed cautiously as long as any indicator of peer support is excluded from the estimated model.
Perhaps the most methodologically sophisticated attempt to as-sess the deterrent effect of perceived certainty was recently con-ducted by Meier, Burkett, and Hickman.15 They estimated a model of marijuana use (MU) with three-wave panel data. Their model of social control included both a deviance generator (peer behavior re-garding marijuana use, PB) and a deviance inhibitor (the perceived certainty of punishment for marijuana use, PC). With three waves of data, Meier, Burkett, and Hickman estimated at two different points in time both the lagged (PC1--+MU2; PC2--+MU3) and "instantane-ous" (PC2-+MU2; PC3--+MU3) relationship between perceived cer-tainty and marijuana use. In their conceptualization of the model, Meier, Burkett, and Hickman referred to these relationships as re-flecting the causal deterrent effect of sanction threats on marijuana use. Estimating their model with data from a sample of 265 high school students, Meier and his colleagues found a significant inverse relationship between perceived certainty at wave three and self-re-ported marijuana use measured at the same time.16 They found no evidence of a similar "instantaneous" relationship at the second wave or of a lagged deterrent (PCt--.MUt+ 1) effect at any time. The significant negative relationship between perceived certainty and marijuana use at the third wave, with peer use of marijuana con-trolled, was interpreted as reflecting a deterrence process.17
The purpose of this Article is both to reexamine and reanalyze the Meier, Burkett, and Hickman data with a different model specifi-cation and to present and analyze additional data bearing on the relationship between perceived certainty and self-reported involve-ment over time in two types of common rule breaking. Rather than contradicting their findings, the present study confirms most of the
of peer use of marijuana. This hypothesis is given some support by the partial tion between perceived certainty and marijuana use. Although the zero-order correla-tion is r = -. 19, the first-order partial, when controlling for peer use, reduces that figure to -. 10. This example illustrates the necessity of including relevant explanatory factors, such as peer involvement in deviance, when making tests of the deterrence
doctrine.
14 Bishop, supra note 5; Grasmick & Green, supra note 4.
15 Meier, Burkett & Hickman, supra note 4.
16 Id. at 72.
RAYMOND PA TERNOSTER
conclusions offered by Meier and his associates in their original study. Following their lead in constructing and estimating a general model of social control, this Article reports on a three-wave, six-variable model of marijuana use and petty theft.
II. METHODS
The data used by Meier, Burkett, and Hickman are fully de-scribed in their original publication.'8 Their well-detailed article describes the sample (265 high school students) and the measures they employed in their study. In addition, the authors report a full correlation matrix with standard deviations and means so that their LISREL models could be replicated and so that models different from theirs could be estimated and compared. Their correlation matrix (see Table 1) will be used in this Article to estimate a model of social control somewhat different from the one they originally es-timated and on which they reported. The model used in this Article is theoretically identical to the one used by Meier and his associates, but the former is better justified methodologically. Furthermore, similar but more complete social control models will be estimated using a different data set which is described in the following sections of this Article.
A. SAMPLE
The new data that will be analyzed in this paper are similar to that of Meier and his associates. These data, as with the data used
by Meier, Burkett, and Hickman, come from a three-wave panel
study of high school students. The respondents included all tenth grade students who were in attendance at nine high schools in and around a mid-sized southeastern city. These schools represent a purposive sample that was selected to include urban, suburban, and rural schools in the study and to accurately reflect the race, gender, and social class characteristics of the city's high schools. Confiden-tial questionnaires were administered in all tenth grade English classes during the fall of 1981. Follow-up questionnaires were given to the respondents in the fall semester of their junior year (second wave) and senior year (third wave). A total of 1244 respondents (49% male, 86% white) completed full questionnaires at all three time periods; this constituted approximately 46% of the respon-dents who completed a questionnaire during the first wave.
As in most panel studies, particularly those that extend beyond two waves, problems of sample attrition arose in this study. The
18 Id. at 70-71.
1988] EXAMINING THREE-WAVE DETERRENCE MODELS 141
original sample size was selected to be large enough so that even with considerable case attrition there would be a sufficiently large number of cases at the end of the third wave to conduct detailed and efficient analyses. More important than its size is the process by which the attrition is generated. A large case attrition will be of less concern to the analysis of theoretical relationships if the process is a random, rather than a systematic, one. Fortunately, a very large proportion of the case attrition in this study could not be attributed to two non-random sources of case attrition: an unwillingness of available respondents to cooperate in completing the questionnaire and the respondents dropping out of high school.
On the day of the questionnaire's administration, over 99% of those students who attended agreed to participate in the study, and approximately 95% of their responses were sufficiently complete to warrant analysis. In addition, in subsequent questionnaire adminis-trations, approximately 99% of the attending students agreed to continue their participation. Therefore, the rate of participation in the study was very high for those who were in attendance. Further-more, in none of the nine high schools did the dropout rate from the tenth to the twelfth grade exceed 5% of the original tenth grade class.
There were two major sources of case attrition in this study. One came from a change of research policy in one of the high schools. At the beginning of the second wave, an interim principal instituted a policy of requiring written parental approval for stu-dents to participate in research activities. This policy was not in ef-fect in this school at either the first or third wave of the study but did result in a more than normal case attrition from the first to the sec-ond wave, as these students were less than diligent in returning pa-rental permission slips from home. The second source of case attrition for these schools came from normal school processes, such as students missing English classes, failing to attend school on the day of follow-up administrations, moving out of the area, remaining behind in English, or electing a non-traditional English section, such as creative writing, journalism, or theatre. The most troubling of these reasons is non-attendance because it is plausible that the more delinquent students are also more likely to be irregular attenders.
RAYMOND PA TERNOSTER
completed a questionnaire at wave one but were lost for one or both of the subsequent waves (n= 1449). To ensure that the sample of respondents about whom there is complete information did not dif-fer in any important way from those lost due to attrition, these two groups of respondents were compared on each variable of interest. The data are presented in the appendix of this Article. With some exceptions, there were no substantial differences on these measured variables. A few points are important to keep in mind, however. Respondents who stayed in the sample across three waves were somewhat more "conventional" than those who were eventually lost. The former had somewhat lower means for the deviance gen-erators, namely, peer behavior and peer attitude and for self-re-ported behavior and had higher means for each of the deviance inhibitors, namely, perceived certainty, moral beliefs, and parental supervision. These differences, though consistent for both offenses, are not large and are more characteristic of marijuana use than petty theft. It can be argued with some confidence, therefore, that the group of respondents examined here are reasonably representative of the students from the chosen schools. While both the non-ran-dom selection of schools and the case attrition from wave one to wave three limit the generalizability of the reported results, these data are valid for testing theoretical relationships among variables.
B. VARIABLES
Identical to the model reported by Meier and his associates, the first model to be estimated in this Article contains three variables measured at each of three time periods or waves: self-reported ma-rijuana use, peer use of mama-rijuana, and the percevied certainty of punishment for marijuana use. At each wave, respondents were asked to report how many times in the past year they had used mari-juana. Because the distribution of this variable was somewhat
skewed, a log transformation of the raw frequency was done. All analyses were conducted on this transformed variable. This mea-sure of self-reported marijuana use was somewhat different than the measure used by Meier, Burkett, and Hickman.19 They employed a similar time for the recall period, namely, the prior twelve months, but they had rank ordered response options that ranged on a five-point continuum from "never" to "once a week or more." The measure of peer use of marijuana and the measure of perceived cer-tainty of punishment in the data set used in this Article are virtually identical to those used by Meier and his colleagues in their research.
19 Id. at 71.
1988] EXAMINING THREE-WAVE DETERRENCE MODELS 143
Peer use of marijuana was measured by asking respondents to port how many of their friends had used marijuana. Provided re-sponse options were "none," "some," "most," and "all." To measure the perceived certainty of punishment, respondents were asked to respond to the following question: "If you were to use ma-rijuana, how likely is it that you will be caught by the police?" Re-sponse options for this question ranged on a five-point continuum from "very likely" to "very unlikely."
In order to expand the generality of the findings on adolescent marijuana use reported in this Article and by Meier and his associ-ates, a second common delinquent offense, petty theft, was ex-amined.- Each respondent answered questions pertaining to self-reported petty theft, peer involvement in petty theft, and the per-ceived certainty of punishment for petty theft which were identical to the questions about marijuana use. All analyses conducted on the marijuana use measures were performed separately from the theft variables to determine whether the nature of the causal processes examined differed by offense.
III. FINDINGS A. BIVARIATE RELATIONSHIPS
Table 1 reports the zero-order correlation coefficients among the marijuana use variables and their means and standard deviations at each of the three time periods for Meier's original study and the data collected for the present study.20 Table 2 contains equivalent data on petty theft from the present study. The first task is to ex-amine the zero-order correlations for marijuana use and petty theft from the data collected for the present study. For both sets of cor-relations, the relationships are consistent with theoretical expecta-tions. Consistent with the deterrence doctrine, both the lagged and synchronous correlation between perceived certainty and self-re-ported marijuana use are significant and negative.2 1 The three
syn-20 The reader can compare the means and standard deviations for each marijuana
use item from the present with those reported by Meier and his colleagues. This data is contained in Table 1, along with the correlation matrix from each study.
144 RAYMOND PA TERNOSTER [Vol. 79
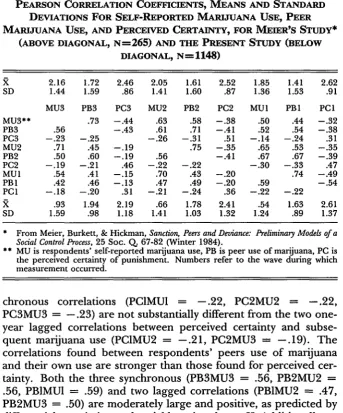
TABLE 1
PEARSON CORRELATION COEFFICIENTS, MEANS AND STANDARD DEVIATIONS FOR SELF-REPORTED MARIJUANA USE, PEER MARIJUANA USE, AND PERCEIVED CERTAINTY, FOR MEIER'S STUDY*
(ABOVE DIAGONAL, N=265) AND THE PRESENT STUDY (BELOW DIAGONAL, N=1148)
2.16 1.72 2.46 2.05 1.61 2.52 1.85 1.41 2.62
SD 1.44 1.59 .86 1.41 1.60 .87 1.36 1.53 .91 MU3 PB3 PC3 MU2 PB2 PC2 MU1 PBI PCI
MU3** .73 -. 44 .63 .58 -. 38 .50 .44 -. 32 PB3 .56 -. 43 .61 .71 -. 41 .52 .54 -. 38
PC3 -. 23 -. 25 -. 26 -. 31 .51 -. 14 -. 24 .31 MU2 .71 .45 -. 19 .75 -. 35 .65 .53 -. 35 PB2 .50 .60 -. 19 .56 -. 41 .67 .67 -. 39 PC2 -. 19 -. 21 .46 -. 22 -. 22 -. 30 -. 33 .47
MUl .54 .41 -. 15 .70 .43 -. 20 .74 -. 49 PB1 .42 .46 -. 13 .47 .49 -. 20 .59 -. 54
PC1 -. 18 -. 20 .31 -. 21 -. 24 .36 -. 22 -. 22
R .93 1.94 2.19 .66 1.78 2.41 .54 1.63 2.61 SD 1.59 .98 1.18 1.41 1.03 1.32 1.24 .89 1.37
* From Meier, Burkett, & Hickman, Sanction, Peers and Deviance: Preliminary Models of a
Social Control Process, 25 Soc. Q. 67-82 (Winter 1984).
** MU is respondents' self-reported marijuana use, PB is peer use of marijuana, PC is the perceived certainty of punishment. Numbers refer to the wave during which measurement occurred.
chronous correlations (PC1MUI = -. 22, PC2MU2 = -. 22,
PC3MU3 = -. 23) are not substantially different from the two
one-year lagged correlations between perceived certainty and subse-quent marijuana use (PCIMU2 = -. 21, PC2MU3 = -. 19). The
correlations found between respondents' peers use of marijuana and their own use are stronger than those found for perceived cer-tainty. Both the three synchronous (PB3MU3 = .56, PB2MU2 =
.56, PB1MUI = .59) and two lagged correlations (PB1MU2 = .47, PB2MU3 = .50) are moderately large and positive, as predicted by
differential association and social learning theory.22 Additionally, as was suggested earlier, peer involvement in marijuana use is
in-certainty and peer use, when all three are measured at the same wave, is referred to as a lagged effect, because respondents' own marijuana use had to have occurred before the measurement of the latter two variables. The relationship between two variables mea-sured at different times is, of course, a lagged relationship if the lag interval is over one or two waves.
22 See, e.g., R. AKERS, DEVIANT BEHAVIOR: A SOCIAL LEARNING APPROACH (2d ed.
[image:11.454.63.407.67.481.2]1988] EXAMINING THREE-WAVE DETERRENCE MODELS 145
versely related to respondents' estimate of their own risk of being caught by the police. The three synchronous (PB3PC3 = -. 25, PB2PC2 = -. 22, PB1PC1 -. 22) and two lagged correlations (PB1PG2 = -. 20, PB2PC3 --- .19) are consistent with the sugges-tion that knowledge of one's friends' use of marijuana is related to a belief that one can do the same with relative impunity.23
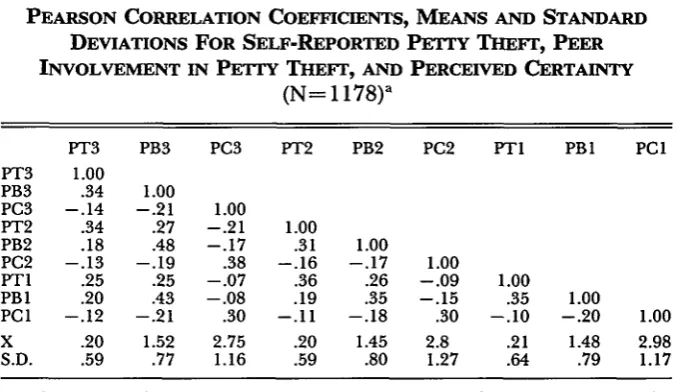
The zero-order correlations for petty theft are reported in Ta-ble 2. With only minor variations, these results are identical to those for marijuana use, although the magnitude of the correlations is consistently weaker for petty theft. Both the synchronous and lagged correlations between perceived certainty and self-reported petty theft are negative, consistent with the deterrence doctrine. Similar to the case for marijuana use, the magnitudes of the two lagged effects are not substantially different (PC2PT3 = -. 13, PC1PT2 =-.11). In addition, all correlations between respon-dents' peers involvement in petty theft and their own reported par-ticipation in theft, though positive, are much weaker than those found for marijuana use (PB3PT3 = .34, PB2PT2 = .31, PB1PT1 =
.35, PB1PT2 = .19, PB2PT3 = .18). This finding is not too surpris-ing in view of the important role attributed in the theoretical litera-ture to social others in the etiology of marijuana use.24 Finally, as for marijuana use, there is an inverse correlation between peer in-volvement in petty theft and respondents' estimates of their own likelihood of getting caught for the act. The magnitude of both syn-chronous (PB3PC3 = -. 21, PB2PC2 = -. 17, PB1PC1 = -. 20) and lagged correlations (PB1PC2 = -. 15, PB2PC3 = -. 17) suggest that those respondents who have friends participating in petty theft are more likely to believe that they can get away with it than those respondents with fewer or no friends involved in theft.
Not only are these bivariate correlation coefficients for mari-juana use and petty theft consistent with theoretical expectations,
they are also similar to the substantive findings reported by Meier and his colleagues in their earlier three-wave study of marijuana use (see Table 1). They found both lagged and synchronous inverse correlations between the perceived certainty of punishment and self-reported marijuana use, larger positive correlations between self-reported marijuana use and peer use of marijuana, and inverse correlations between peer use and estimates of sanction threats for marijuana use. At least at the level of bivariate analysis and in terms
23 See supra note 13 and accompanying text.
24 See, E. GOODE, THE MARIJUANA SMOKERS (1970); Becker, BecomingA Marijuana User,
59 AM. J. Soc. 235 (1953); Ginsberg & Greenley, Competing Theories of Marijuana Use: A
R4YMOND PA TERNOSTER
TABLE 2
PEARSON CORRELATION COEFFICIENTS, MEANS AND STANDARD DEVIATIONS FOR SELF-REPORTED PETTY THEFr, PEER INVOLVEMENT IN PETTY THEFT, AND PERCEIVED CERTAINTY
(N=
1178)-PT3 PB3 PC3 PT2 PB2 PC2 PTi PB1 PCI
PT3 1.00
PB3 .34 1.00
PC3 -. 14 -. 21 1.00
PT2 .34 .27 -. 21 1.00
PB2 .18 .48 -. 17 .31 1.00
PC2 -. 13 -. 19 .38 -. 16 -. 17 1.00
PTi .25 .25 -. 07 .36 .26 -. 09 1.00
PB1 .20 .43 -. 08 .19 .35 -. 15 .35 1.00
PC1 -. 12 -. 21 .30 -. 11 -. 18 .30 -. 10 -. 20 1.00
X .20 1.52 2.75 .20 1.45 2.8 .21 1.48 2.98
S.D. .59 .77 1.16 .59 .80 1.27 .64 .79 1.17 PT is the respondent's self-reported involvement in petty theft, PB is peer behavior for petty theft, PC is perceived certainty of punishment for petty theft. The subscript refers to the time of measurement (time 1, 2, or 3).
of the expected theoretical direction of the relationships, the find-ings reported here paralled those reported by Meier.
This Article will next analyze the causal model constructed by Meier and his associates to explain marijuana use over time. After examining their model, a different specification is suggested and tested both with their original data and the marijuana use and petty theft data collected as part of this study.
B. ESTIMATION OF PRELIMINARY MODELS: MEIER'S THREE-WAVE STUDY
In interpreting their data, Meier, Burkett, and Hickman speci-fied and estimated a three-wave, three-variable model of marijuana use shown in Figure 1. Although it was not made explicit in their paper, Meier's estimated model is premised on a distinctive theoret-ical position which was translated into the model's specification.25 This position can be clarified by a close examination of their model (see Figure 1). In an inspection of this model, two dimensions are particularly important. One such dimension is the nature and makeup of the social control process the model describes. This question addresses the theoretical constructs used to explain mari-juana use over time. The second dimension has both a theoretical
25 Meier, Burkett & Hickman, supra note 4, at 71-72.
[image:13.454.62.401.63.259.2]1988] EXAMINING THREE-WAVE DETERRENCE MODELS 147
11 0
ci~
°
--G-s
000
00 Lo
04
V)a
-~ '~ to - 0
z m
0 0- <t0 .-
000 00
04' 04
CCk0 ccc C."
co. - .0
II 0
otoN
v0 1 U J
RAYMOND PA TERNOSTER
and methodological component and addresses the issue of how the theoretical constructs are related over time.
In constructing their model of marijuana use, Meier and his as-sociates assumed that the process of social control is made up of two elements: deviance generators and deviance inhibitors.2 6 The for-mer is measured by an indicator of peer use of marijuana, and the latter is measured by respondents' estimates of the certainty of pun-ishment for marijuana use (see Figure 1). As previously discussed, they obtained estimates on these two measures and respondents' self-reported use of marijuana during a previous twelve-month re-call period. Their estimated model assumed that the causal effect of both peer behavior and perceived certainty on self-reported mari-juana use occurs during the same measurement period. It means, for example, that the observed correlation found at wave three be-tween peer behavior and self-reported marijuana use reflects the causal effect of peer use measured at wave three on self-reported marijuana use measured at the same time (PB3---MU3). This same causal process applies at wave two (PB2--+MU2) and for perceived certainty (PC3-*MU3, PC2-+MU2). As understood by Meier, Bur-kett, and Hickman, the experiential effect of self-reported marijuana use on peer use is lagged, such that marijuana use that occurred during the preceeding year affects peer behavior measured one year later (MU1-+PB2, MU2---*PB3), and the effect of marijuana use on perceived certainty is lagged over a two-year measurement period (MU1--+PC3). Also explicit in their model is that peer use of mari-juana affects respondents' estimates of sanction threat at the same measurement period (PB3--+PC3, PB2-+PC2) and that perceived sanction threats, in turn, influence the deviance of peers with whom respondents associate at a later time (PC2-+PB3).
The estimates derived from the Meier group's original model are reported in Figure 1. They found a mutual causal effect between peer use of marijuana and respondents' own drug use that was con-sistent with both social learning and differential association theory. Users of marijuana subsequently had more friends who also used marijuana, and these friends' use affected repondents' subsequent involvement. There was also a moderately large inverse effect of peer use of marijuana on respondents' estimate of their own risk of punishment for marijuana use. Both social control theory and dif-ferential association would predict that involvement with deviant others is likely to lead to a neutralization of the fear of legal
26 Id. at 68-69.
1988] EXAMINING THREE-WAVE DETERRENCE MODELS 149
threats.2 7 Meier's data provided some confirmation of this and sug-gested that deviant peers both directly affect one's own involvement in crime and indirectly influence it by reducing the perceived threat posed by discovery and apprehension.
What the Meier data did not reveal, however, is a strong direct effect of one's own use of marijuana on estimates of sanction threat. Previous longitudinal studies have found evidence of such an "expe-riential" effect.2 8 Meier reported no such relationship, except an ef-fect from marijuana use that occurred in the year before wave one on wave three estimates of perceived certainty, and suggested that "those investigators who have reported larger effects ... did so be-cause their models were not completely specified."2 9 It should be noted, however, that tracing the causal paths linking marijuana use to perceived certainty reveals a moderately strong indirect causal ef-fect of wave one marijuana use on wave two (-. 107) and wave three
(-.134) estimates of sanction threats, and an inverse, but much weaker, effect of wave two marijuana use on wave three perceived certainty (-.053). Contrary to the conclusion of Meier and his asso-ciates, their data suggests that one's own experience with marijuana neutralizes the user's fear of the law by bringing him or her into contact with marijuana using peers.
Regarding the role of deviance inhibitors, Meier, Burkett, and Hickman reported a moderate inverse effect of perceived certainty on self-reported marijuana- use, but only at the third wave (p =
-. 157). Although the effect of perceived certainty on self-reported marijuana use is weaker than that found for the deviance generator (peer use p = .491), their finding of a significant inverse relation-ship between a measure of perceived certainty and self-reported in-volvement in one common form of deviance is an important one. Most multivariate panel studies have failed to find a significant asso-ciation between perceived risk and deviance once other explanatory factors were controlled. In addition, although Meier, Burkett, and Hickman reported no direct effect of perceived certainty on mari-juana use at the second wave, had they traced the causal paths they would have found that the wave two measure of perceived certainty did have a non-trivial indirect effect on self-reported marijuana use
27 T. HIRSCHI, CAUSES OF DELINQUENCY (1969); E. SUTHERLAND & D. CRESSEY,
CRIM-INOLOGY, (10th ed. 1978); Jensen, supra note 12; Kandel, Homophily, Selection, and
Sociali-zation in Adolescent Friendships, 84 AM. J. Soc. 427 (1978); Matsueda, Testing Control Theory and Differential Association: A Causal Modeling Approach, 47 AM. Soc. REV. 489 (1982).
28 Minor & Harry, supra note 4; Paternoster, Saltzman, Waldo & Chiricos, supra note 3; Saltzman, Paternoster, Waldo & Chiricos, supra note 3; Teevan, supra note 4. See also Paternoster, supra note 2 (review of perceptual deterrence literature).
RAYMOND PA TERNOSTER
at wave three (-.136) both through its effect on wave three per-ceived risk and its effect in deterring respondents from associating with drug-using peers. The total causal effect is consistent in direc-tion with the deterrence doctrine, and their model did suggest that perceptions of certain punishment are influential in explaining mari-juana use.
C. RESPECIFICATION AND ESTIMATION OF MEIER'S THREE-WAVE MODEL
In the analysis of their three-wave model of marijuana use, Meier, Burkett, and Hickman reported some support for an experi-ential effect of marijuana use on perceived certainty and a deterrent effect of perceived certainty on marijuana use. The evidence in sup-port of these two effects becomes stronger when indirect effects are considered. This is particularly true for the deterrent effect speci-fied by Meier's model. The total effect of wave three perceptions of risk on wave three marijuana use was -. 157 (entirely direct), while for wave two perceptions it was -. 137 (entirely indirect). Although much weaker than the direct and indirect effects for the role of peer use on self-reported marijuana use, these data do suggest a substan-tively important deterrent effect. Do these findings represent a true
deterrent effect, or are they due to the particular specification of the
causal model? In order to substantiate the latter interpretation, it must be shown not only that an alternative model can explain the data as well, but that such a model is more reasonable than the one originally specified and estimated by Meier and his associates in their paper.
Figure 2 represents a different specification of Meier's three-wave, three-variable model of marijuana use. Employing their data, it reports alternative estimates of causal effects. This model is simi-lar to Meier's in that the former presumes that social control is due to the effect of both a deviance generator (peer use of marijuana) and an inhibitor (perceived certainty). In addition, respondents' use of marijuana is related to peer use, and peer use is causally related to respondents' estimate of sanction threats. This model and the one estimated by Meier and his associates differ most critically in the temporal specification of effects. Most notably, Meier, Burkett, and Hickman assumed that there is a synchronous or "instantaneous" causal effect of peer use and perceived certainty on self-reported marijuana use at waves two and three. In the respecification of their model (see Figure 2), these relationships are instead expressed as the causal effect of self-reported marijuana use on peer use and per-ceived certainty. In the representation of this temporal ordering,
1988] EXAMINING THREE-WAVE DETERRENCE MODELS 151
0 a0
0
N I
E
m
0
r~l l
00 C)
C14O
0
U) 000
0 0.i
m- CIS
(1
00
O,
'o
01
= .-.
_".--o==o
10I c~
cq*
-..
RAYMOND PA TERNOSTER
marijuana use is lagged behind the period at which all three are measured and before the measurement at the previous wave (see Figure 2). This alternative specification of the model was made be-cause, even though all three variables are measured at the same time for each wave, the variables reflect logically different time periods. Peer use and perceived certainty reflect respondents' attitudinal states at the time they are measured, while self-reported marijuana use reflects behavior that occurred in the preceding twelve-month period.30 Because of this, the measure of self-reported marijuana use should logically come before the measure of peer use and per-ceived certainty and should causally affect them.
In the model originally specified by Meier and his associates, the effect of perceived certainty on self-reported marijuana use, which they referred to as an "instantaneous" deterrent effect, re-flected the relationship between perceived risk measured at one point in time and self-reported marijuana use that occurred in the previous year (see Figure 1). This, however, is precisely what has been identified in the literature as the experiential rather than the deterrent effect. The latter effect is defined by Gibbs as the associa-tion between percepassocia-tions of sancassocia-tion threat and "subsequent criminal or delinquent acts."3 1 Because reported experiential effects have consistently been greater than deterrent effects,3 2 this may partially account for the significant and substantively non-trivial negative as-sociation reported by Meier, Burkett, and Hickman between per-ceived certainty and marijuana use (p - -. 157).33 Their estimate of the experiential effect was based on the effect of wave one mari-juana use, which occurred sometime in the year before wave one and perceptions of sanction threats measured at wave three. Con-trary to most of the published literature which finds moderately
30 Actually, even though these perceptions (certainty of punishment and reported peer use of marijuana) are measured at one point, they may reflect the respondents' attitudes over a previous time period. For example, estimates of perceived certainty at wave two (PC2), although measured at wave two, may have been formed immediately after wave one and gone unchanged over the intervening twelve month period. If this is true then the relationship between perceived certainty and self-reported marijuana use at any wave may reflect the causal effect of the former on the latter. Although concep-tually reasonable and the premise behind the utilization of cross-sectional studies, em-pirical studies (and the stability coefficients from the models estimated here) have indicated that perceptions may be unstable over fairly short time periods, particularly for samples of adolescents. See supra notes 4 and 28 and accompanying text.
31 J. GiBBs, supra note 4, at 209 (emphasis added). See Silberman, supra note 3, at
444.
32 See supra note 2 and accompanying text.
33 Meier, Burkett & Hickman, supra note 4, at 72.
1988] EXAMINING THREE-WAVE DETERRENCE MODELS 153
strong negative experiential effects,3 4 Meier and his associates found a positive effect (p = .159).
Because the recall period for self-reported marijuana use is the previous twelve months, a lagged interval is built into the measure-ment process. For this reason, the model specification depicted in Figure 2 seems to be more logically defensible. In Figure 2, the measure of self-reported marijuana use is hypothesized to affect causally both perceived certainty and the deviance of peers when all three are measured at the same time. Perceived certainty and peer use of marijuana are assumed to affect respondents' own marijuana use occurring in the subsequent twelve months and measured at the next wave.
The correlation matrix reported in Meier's original paper was used to obtain estimates for the respecified model in Figure 2. The first thing to observe from this model is that it provides as good or slightly better an overall fit to the data as compared to Meier's model.3 5 Although the two models are comparable in terms of over-all fit, the amount of explained variance in the particular equations differs. While Meier and his associates reported R2 values of ap-proximately .60 for self-reported marijuana use and .50 for peer use, the respecified model in Figure 2 shows the opposite pattern. This situation results because the synchronous correlation between peer and self-reported use of marijuana at each wave in the model in Figure 2 is expressed as the causal effect of self-reported use on peer use, while lagged correlations are expressed as the causal effect of peer use on self-reported use of marijuana. The correlation ma-trix indicates that the synchronous correlations between self-re-ported and peer use were larger than the lagged correlations between peer use and subsequent self-reported use of marijuana.
Taking full advantage of the panel nature of the data, then,
34 Minor & Harry, supra note 4; Paternoster, Saltzman, Waldo & Chiricos, supra note
3; Saltzman, Paternoster, Waldo & Chiricos, supra note 3.
35 In both Meier's original model and the respecified one in Figure 2, causal effects
were estimated with LISREL V. K. JORESKOG & D. SORBOM, LISREL: ANALYSIS OF LIN-EAR STRUCTURAL RELATIONSHIPS By THE METHOD OF MAXIMUM LIKELIHOOD, (1981). In both Figures 1 and 2 the estimated effects are the standardized solution from analyzing the sample covariance matrix. The overall goodness of fit of the model can be deter-mined from a number of measures. One of these is the estimated chi-square for that model. The magnitude of the chi-square reflects the difference between the observed covariance matrix and one generated by the model. A small discrepancy (low chi-square) indicates that the hypothesized model accurately reproduces the data. Unlike traditional uses of the chi-square statistic, small and non-significant values are desired for good fitting models. In the present case, the re-estimated model (X2 = 20.71, 16
RAYMOND PA TERNOSTER
does not reduce the model's goodness of fit. In addition, the sub-stantive conclusions suggested by the respecified model in Figure 2 are similar to those reported by Meier and his colleagues. There is a strong mutual causal relationship between peer use of marijuana and respondents' own use. At the first measurement wave, respon-dents who reported more marijuana use in the previous twelve month period were more likely to report having friends who also had used marijuana than those reporting less prior use of marijuana (p = .740). These deviant peers had a deviance generating effect on respondents' own subsequent use both directly (p = . 111) and indi-rectly, though very weakly, by reducing their estimate of sanction certainty (.008). This process is repeated and is stronger at the sec-ond wave, where self-reported involvement affects peer use (.504) which, in turn, directly (p = .207) and indirectly through the neu-tralization of sanction fear (.039) leads to greater self-reported mari-juana use.
There are two important differences, however, between the re-sults originally reported by Meier, Burkett, and Hickman and those found here for the respecified causal model. First, while Meier found a positive experiential effect of self-reported marijuana use on perceived certainty lagged over three time periods (p = .159), the model in Figure 2 reports moderate (and stronger) inverse
ef-fects at wave one (p = -. 194) and wave three (p = -. 269) and a
moderate positive experiential effect lagged over three waves (p = .202). The pattern of positive and negative experiential effects may reflect the different effect on perceived sanction threats of marijuana users (inverse effect) and desisters (positive) over the three-year pe-riod. Consistent with previous findings, these data do, however, show much stronger support for the effect of rule breaking on per-ceptions of the certainty of punishment than Meier's own analysis. Second, the deterrent effect estimated in this model (p = -. 146) is
weaker than that found by Meier and his associates in their original model (p = -. 157). Nonetheless, contrary to much of the recent literature,3 6 the direct effect of perceived certainty on subsequent self-reported marijuana use is both negative and significant, consis-tent with the deterrence doctrine. This deterrent effect was found at the third wave only, even after controlling for an important genera-tor of marijuana use, namely, peer involvement, which had only a slightly stronger effect (p = .207). In addition, the indirect effect of perceived certainty, measured at wave one, on self-reported
mari-36 See supra note 9 and accompanying text.
1988] EXAMINING THREE-WAVE DETERRENCE MODELS 155
juana use at wave three is weak but non-trivial (-.064) and in the expected direction.
This respecified three-wave model was then used to estimate causal relationships for the marijuana use and petty theft data col-lected as part of this study. The correlation matrices reported in Tables 1 and 2 were employed to obtain the estimated causal mod-els in Figures 3 (marijuana use) and 4 (petty theft). For clarity of presentation, the unstandardized estimates are omitted, and only the standardized solution is reported. In each model, the self-re-ported deviance variable is lagged in time before the wave at which it was measured to reflect the logic of the twelve-month recall period.
The model for marijuana use estimated from the present data (Figure 3) provides a good fit. Relative to degrees of freedom, the chi-square value for this model is comparable to that estimated from Meier's data in Figure 2.37 The R2 values for individual equations are also comparable, though generally there is more explained
vari-37 In relatively large samples, as in this case, the chi-square statistic is not by itself an
appropriate measure of a model's goodness of fit. This is because chi-square is very sensitive to sample size, and even trivial differences between observed and estimated covariance matrices may be statistically significant. With a large sample, the chi-square test may lead to the erroneous rejection of a good model. To correct for this, Joreskog has suggested that a model's goodness of fit be assessed by the ratio of chi-square to degrees of freedom. Joreskog, A General Approach to Confinnatory Factor Analysis, 34
PSYCHOMETRICA 183 (1969). Although intuitively reasonable, this adjusted chi-square is somewhat arbitrary, and there has been some.debate as to the requisite value to indicate a good fit. Wheaton has suggested that a ratio of chi-square to degrees of freedom in the order of five or less is indicative of a good fit, while more recently Carmines and McIver recommended a more conservative ratio of two or three. Wheaton, Muthen, Alwin & Summers, Assessing Reliability and Stability in Panel Models, in SOCIOLOGICAL METH-ODOLOGY: 1977 (D. Heise ed. 1977). See also Carmines & McIver, Analyzing Models With
Unobserved Variables: Analysis of Covariance Structures, in SOCIAL MEASUREMENT: CURRENT ISSUES (G. Borhnstedt & E. Borgatta eds. 1981). A more justifiable measure of goodness
of fit in latent construct models has been offered by Hoelter. Hoelter, The Analysis of
Covariance Structures: Goodness of Fit Indices, 11 Soc. METHODS & RES. 325 (1983).
Hoelter's test statistic is called Critical N (CN), which is the largest sample size at which the hypothesis of a statistically acceptable fit (probability of .05) would not be rejected. The formula for the CN statistic is:
= z crit + (2 df- 1)1/22 + G
CN =+G
2X2 / (N - G)
Fig-156 RAYMOND PA TERNOSTER [Vol. 79
0
o
-. 0 0C11I" " V0
C11 a2
C.0
!
!2
00
P0 to
on 00
.I-m CO
>
o- C.,
I
1988] EXAMINING THREE-WAVE DETERRENCE MODELS 157
ance in Meier's equations. More importantly, the substantive inter-pretation of the model for understanding marijuana use, over time is similar for the two data sets. There is an ongoing relationship be-tween the self-reported marijuana use of these respondents and their peers. Respondents' marijuana use prior to wave one has a strong direct effect on peer use measured at that time (p = .590). This effect is repeated but grows weaker at waves two (p = .410) and three (p =.352). It appears that the selection of marijuana-us-ing peers was strongest when these students first entered high school and became progressively weaker once these friendships are formed. Marijuana-using peers also have a direct effect on respon-dents' own self-reported marijuana use, and this effect grows stronger over time (PB1--MU2 = .083; PB2-+MU3 = .123). This
trend is similar to what was found in the reanalysis of Meier's data (see Figure 2): an initially strong but declining social selection ef-fect of one's own use on marijuana-using peers and a growing influ-ence of peer use on self-reported use over the three-year period. This would suggest that upon entering high school marijuana users quickly seek out like-minded peers who, over time, come to have a stronger effect on their behavior.
These data also agree with Meier's by showing not only that peers have a direct influence on respondents' use of marijuana but that they also have an indirect effect by neutralizing the fear of de-tection.3 8 At each wave, there is a significant direct inverse effect of peer use of marijuana on respondents' estimate of the certainty of punishment (PBI-+PC1 = -. 138, PB2-PC2 = -. 084, PB3->PC3 = -. 12 1). In terms of total causal effects, wave three peer use has a moderate inverse effect on wave three estimates of certainty (-.121), wave two peer use has an effect on perceived certainty at wave two (-.084) and wave three (-.097), and wave one peer use is negatively related to perceived certainty at waves one (-.138), two (-.081), and three (-.030). All of these effects suggest that associ-ation with deviant peers leads to a neutralizassoci-ation of sanction threats. Not only does peer use of marijuana positively affect self-re-ported use through the neutralization of sanction threats, a moder-ate inverse experiential effect of one's own use of marijuana has the same effect. The experiential effects observed here for one's own behavior are both strong and consistent. Respondents' use of mari-juana in the prior year has a direct (but diminishing) inverse causal
ure 3 (ON = 1266) are substantially higher than the minimum value of 200
recom-mended by Hoelter as indicative of a good fit.
RAYMOND PA TERNOSTER
effect on perceived certainty at waves one (p = -. 138), two (p = -. 106), and three (p = -. 096). A strong indirect effect of respon-dents' use of marijuana is also felt on perceived certainty through its effect on peer behavior. The total causal effect of wave three self-reported marijuana use on perceived certainty at wave three is -. 139. The total causal effect of wave two self-reported marijuana
use on perceived certainty is -. 164 at wave three and -. 141 at
wave two. Respondents' use of marijuana in the year prior to wave one had moderate inverse causal effects on perceptions of risk at
wave one (-.220), two (-.183), and three (-.162). Contrary to
Meier's original model, but consistent with the respecification of that model here (Figure 2), these data show a consistently strong negative experiential effect of self-reported marijuana use. Respon-dents' own involvement in using marijuana lowers their expectation of sanction risk directly and indirectly by moving them into closer affiliation with drug-using peers whose own experience neutralizes these threats.
Consistent with the previous reanalysis of Meier's model, this model for marijuana use shows a non-trivial, significant lagged de-terrent effect for perceived certainty at only one measurement pe-riod. The direct effect of wave two perceived certainty on wave three marijuana use is in the expected direction, but it is negligible (p = -. 016). The direct causal effect of wave one certainty on sub-sequent self-reported marijuana use measured at wave two is, how-ever, more evident (p = -. 051). The unstandardized coefficients for the deterrent effect estimated from Figure 3 are -. 019 for
PC2--.MU3 and -. 054 for PCI-+MU2, while, for the reestimation of Meier's model, they were -. 242 and -. 030, respectively. The
1988] EXAMINING THREE-WAVE DETERRENCE MODELS 159
mal sanctions are more important than formal ones,3 9 part of the observed deterrent effect in Meier's data may be due to respon-dents' fear of the reaction of non-legal personnel.
Second, there is considerably more variation in marijuana use to explain over the three waves in Meier's original data set than in the data collected for this study. The unstandardized stability esti-mates for marijuana use in Meier's data are p = .578 for MU1-MU2 and p = .430 for MU2---MU3; in the present data, the correspond-ing Stability coefficients were .726 and .680. The greater stability in marijuana use over time in this study may explain the generally weaker structural effects found not only for perceived certainty but for peer use as well. Consistent with this interpretation, the effects of perceived certainty and peer use in Meier's data were strongest during the period from wave two to wave three, when the stability of marijuana use was weakest. More generally, these data suggest that causal models may be misleading if the underlying processes are in a state of equilibrium.
Figure 4 presents the results of the model analysis for petty theft. The petty theft model shows a good fit to the data, although, in terms of the amount of variance explained in individual equa-tions, it is not as good as the model for marijuana use. With minor exceptions, the substantive results for the petty theft model parallel those found for marijuana use. As suggested by the zero-order cor-relations, the relationship between self-reported involvement in petty theft and respondents' peers involvement is positive, though weaker than that found for marijuana use. Nonetheless, consistent with social learning and differential association theory, there is an on-going mutual effect between the two and moderately strong total causal effects. The petty theft data also reveal that both peer in-volvement and respondents' own participation in petty theft serve to reduce their fear of sanction threats. The most important difference between this model and the one for marijuana use is that for petty theft the direct inverse effect of perceived certainty on subsequent behavior is significant and non-trivial for both lagged effects (PC1-+PT2 = -. 065, PC2--PT3 = -. 059). Both of these are
con-sistent with the deterrence doctrine, as is the inverse but weak indi-rect effect of wave one perceived risk on wave three self-reported petty theft (-.037).
The respecification and reanalysis of Meier's three-wave model
39 See, e.g., Anderson, Chiricos & Waldo, Formal and Informal Sanctions: A Comparison of
Deterrent Effects, 25 Soc. PROBS. 103 (1977); Grasmick & Green, supra note 4;Jacob, supra
160 RAYMOND PA TERNOSTER [Vol. 79
II
z
00
IIi
to
z to
N 0
C11l
q
v
r-.--
000>
w
0
CI-
C11-to
1988] EXAMINING THREE-WAVE DETERRENCE MODELS 161
of marijuana use presented here confirms their findings regarding both the mutual effect of peer behavior and respondents' own ac-tions and the effect of these variables on respondents' estimates of the certainty of punishment. This reanalysis also reveals a signifi-cant and substantively non-trivial inverse effect consistent with the deterrence doctrine between perceived certainty and subsequent marijuana use. The hypothesized model was then estimated with a different data set for both marijuana use and petty theft. This analy-sis also reveals a mutual relationship between peer and self-reported behavior and a threat neutralization effect of both. Most impor-tantly, these models suggest that, contrary to much of the recent literature, perceived certainty may have a significant and meaningful deterrent effect on at least two common forms of delinquency. This effect persisted even after controlling for the behavior of respon-dents' peers.
However persuasive, before these data may be taken as evi-dence of a deterrent effect for perceived certainty, one must ensure that the observed relationship is due to the inhibitory effect of sanc-tion threats and not the effect of another deviance generator or in-hibitor which was omitted from the model. Although Meier, Burkett, and Hickman argued for the necessity of complete models of the social control process, the one they estimated contained only one inhibitory and one generating mechanism.40 The remainder of this Article will advance their work another step by constructing and estimating a more complete model of social control and deviance.
D. A GENERAL MODEL OF SOCIAL CONTROL
The models estimated in Figures 3 and 4 contain only two ex-planatory variables: peer behavior and perceived certainty. The de-linquency literature has suggested the importance of other deviance generators and inhibitors in the social control process. Three of these generators and inhibitors will be added to the two models. Social learning and differential association theory suggest that, in addition to peer behavior, verbal support for deviance serves as an important generator of deviance.41 Such verbal reinforcements
40 Meier, Burkett, and Hickman did recognize this, however, by referring to their model as a preliminary model of the social control process. Meier, Burkett & Hickman,
supra note 4.
41 See, e.g., R. AKERS, supra note 22; D. MATZA, DELINOJENCY AND DRIFT (1964); R.
JOHNSON, supra note 8; Akers, Krohn, Lanza-Kaduce & Radosevich, supra note 8; Britt &
Campbell, Assessing the Linkage of Norms, Environments, and Deviance, 56 Soc. FORCES 532
(1977); Burkett &Jensen, supra note 12; Ginsberg & Greenley, supra note 24; Jacob, supra