Journal of Criminal Law and Criminology
Volume 63 | Issue 3
Article 6
1973
Changing Relationship Between Official and
Self-Reported Measures of Delinquency: An
Exploratory-Predictive Study, The
Maynard L. Erickson
Follow this and additional works at:
https://scholarlycommons.law.northwestern.edu/jclc
Part of the
Criminal Law Commons
,
Criminology Commons
, and the
Criminology and Criminal
Justice Commons
This Criminology is brought to you for free and open access by Northwestern University School of Law Scholarly Commons. It has been accepted for inclusion in Journal of Criminal Law and Criminology by an authorized editor of Northwestern University School of Law Scholarly Commons.
Recommended Citation
THE CHANGING RELATIONSHIP BETWEEN OFFICIAL AND
SELF-REPORTED MEASURES OF DELINQUENCY: AN
EXPLORATORY-PREDICTIVE STUDY
MAYNARD L. ERICKSON*
PROLOGUE
A number of years ago an exloratory study of the relationship between "official" delinquency and "self-reported" delinquency was made.' In that study, respondents were questioned about their past delinquent behavior and then were asked to estimate the likelihood of their committing a vari-ety of "delinquent" acts in the future. However, that study accomplished little more than to pose the usual questions regarding the predictive effi-ciency of the various criteria since it included no up data. Since that time, additional follow-up data have been gathered which make possible a further exploration of those questions.
This paper, therefore, is divided into two parts. In the first part the methodological development of two scales is discussed: one concerning "self-re-ported" delinquent behavior and the other con-cerning respondents' "estimates of the likelihood of future violations." The second part of the paper involves an analysis of the relationships between the scales and official delinquency data over time.
DEFm ON OF THE PRoBLEm
It has long been recognized that present criminal and juvenile delinquency statistics are inadequate as measures of the extent of lawbreaking in the United States.2 Their inadequacy stems from a multiplicity of factors. First, there is a lack of con-sensus regarding the definition for criminality.
* Professor of Sociology, University of Arizona, Tucson.
I M. Erickson, An Experiment to Determine the
Plausibility of Developing an Empirical Means of Differentiating Between Delinquents and Nondelin-quents Without Consideration to Involvement in the Legal Process (unpublished thesis, Brigham Young University, 1960).2
H. BAsR & N. TEETERS, NEw HouzoNs IN CsusNoLoay 35-38 (3rd ed. 1959); R. CAVAN, CRui-NOLOGY 35-38 (1955); M. E C Ao IN MODEN
Socixrn 48-74 (1952); M. NEumEYEE, JuENILE DE-LiNQUENCy IN MODERN SocirY 32-52 (1955); S.
RoBisoN, JUvENILE DELINQUENCY: ITS NATURE AND
CONTROL 13-27 (1960); D. TAxr, CRnu1OLOGY 35-38 (1955); Pearlman, The Meaning of Juvenile Delinquency Statistics, 13 FED. PROBATION 63-67 (September, 1949); Sellin, The Basis of a Crime Index, 22 J. Cmm. L. & C. 346 (1931).
Second, there is a lack of uniform methods of re-porting and recording crime data. Third, there is a differential in law enforcement with respect to different racial and class groups and geographic regions. Fourth, perhaps the most serious limita-tion of all is the fact that present statistics deal ex-clusively with those offenders who become involved in some way in the legal-reactive process.
Evidence of widespread crime by persons who are never, or only rarely, involved with the law has long been publicized. Sutherland, in a notable series of studies, called attention to extensive lawbreak-ing among business and professional groups Fraud, violation of trust, misrepresentation in ad-vertising and the restraint of trade were among the violations he noted. Porterfield, in a comparison of college students and juvenile delinquents, found that all the college students in his sample had com-mitted offenses comparable to the offenses for which other people had been taken to court.' In an-other study, he found that the violations admitted by college boys exceeded in number and in serious-ness those for which other juveniles were charged and brought to court.5 Robison found that 32 per-cent of the behavioral problems known to agencies in New York City never became court cases.' In another study of 114 boys involved in a counseling program only 13 had not been guilty of some law-breaking; yet, only 40 of them had ever been to court This sample of boys had committed 6,416 legal violations of which only 95 (1.5 percent) had been reported to the juvenile court. Erickson and Empey found that nearly nine out of 10 violations go undetected by anyone-parents, police, or any-one in authority. This finding holds for known
3
E. SUTHERLND, WrTE COLA CR= (1949);
Sutherland, Is "White Collar Crime' Crime?, 10 Am. SocIOLoGxicA RsEv. 132 (1945); Sutherland, Whi
e
Collar Criminality, 5 Am. SoCioLOGicAL RIv. 1 (1940).4 Porterfield, Ddinquency and Its Outcome in Court and College, 49 Am. Socoi.oLGcA. REv. 199 (1943).
5A. PORTERF IE, YoUTH IN TROUBLE (1946).
6S. RoBisON, CAN DELINQuENCY BE MEASURED?
(1936).7
Murphy, Shirley & Witmer, The Incidents of Hidden Delinquency, 16 Am. J. ORiTorsycamATRY 686 (1946).
MEASURES OF DELINQUENCY
"official" delinquents and nondelinquents. The conclusion is clear that relatively few violations committed by juveniles become a matter of official records. Furthermore, the conclusion does not seem to be limited to juveniles. Studies of adults indicate the same picture. Wallerstein and Wyle found that 91 percent of a sample of New York adults ad-mitted having comad-mitted felonies and misde-meanors.9
Even more striking is the evidence suggesting that many people in penal institutions have com-mitted fewer offenses than many who remain in the community. For example, Short found that 22 per-cent of the boys in a Washington reformatory were no more delinquent than 90 percent of a sample of public high school boys ° Likewise, Gough, in com-paring a broader sample of delinquents-institu-tionalized offenders, high school disciplinary prob-lems, and a sample of non-delinquents-found that 44 percent of the nondelinquents fell above the cutting point on his scale which supposedly divided delinquents from nondelinquents; 12 percent of the so-called "delinquents" fell below the cutting point."
Thus, the fact that some individuals are officially designated as delinquent does not necessarily mean that they are any more or less delinquent than many others not so designated. These studies and many others2 suggest that those who become in-volved in the legal process constitute but a small portion of the total number of lawbreakers. Ap-parently, there are vastly more delinquent individ-uals at any moment than official statistics indi-cate.'3 Furthermore, there is probably considerably more delinquent behavior among both official de-linquents and nondede-linquents than is indicated by
all sources of official statistics concerning them. Yet, until very recently most of the research that P.S. 456 (1963); Empey & Erickson, Hidden
Dein-quency and Social Status, 44 SoCAL. FoRcEs 546 (1966). 9 Wallerstein & Wyle, Our Law Abiding Law-.reak-"
ers,
25 FED. PR OBATiON 110 (April1947).
10 J. Short, Jr., The Study of Juvenile Delinquency by Reported Behavior: An Experiment in Method and Preliminary Findings (paper read at the annual meet-ing of the American Sociological Society, Washmeet-ington,
D.C., Septenber 1955).
" H. Gough, Systematic Validation of a Test for Delinquency (paper read at the annual meeting of the American Psychological Association, September 2, 1945).
12 Several articles present good reviews of the studies done on self-reported delinquency. See, e.g., Gold, Undetected Delinquent Behavior,
13 J.
REAcm INCRnm Am DELNQUENCY
27 (1966); Short & Nye,
Extent of Unrecorded Delinquency, Tentative Conclu-sions, 49 J. CGnr L.C. & P.S. 296 (1958).":
H.
BARNEs&
N. TEETERs, supranote 2, at 6.
has been conducted in an attempt to delineate
etiological variables concerning delinquency hasfailed to take this into account. Numerous studies
have been conducted by comparing groups of
insti-tutionalized offenders with groups of boys still in
the community. The former are defined as
delin-quents and the latter as nondelindelin-quents. As one
might expect, the results of such research have not
been very productive in isolating etiological
vari-ables. Such factors as age and sex have repeatedly
been found to bear a closer relationship to
delin-quency (when it is thus defined) than any of the
variables which supposedly are more theoretically
relevant.'4A review of the literature suggests that the
pri-mary reason for the failure of previous research to
delineate pertinent variables is that the procedures
utilized have failed to distinguish actual
delin-quents from nondelindelin-quents; that is, those
exten-sively involved in illegal behavior from those rarely
or never involved in it. If this claim is correct, the
following conclusions can be drawn. First, data
derived from police and/or court records of arrests,
court appearances, and- convictions may be less
directly related to actual lawbreaking than to
pat-terns of differential law enforcement, methods of
gathering and reporting statistics and definitions of
criminality. Second, any research which attempts
to differentiate between delinquents and
nonde-linquents, criminals and noncriminals, which
utilizes arrests, court appearances or convictions as
the sole criterion of criminality may be biased in a
number of ways and therefore, fail to distinguish
"real" delinquents from nondelinquents.
5There are, however, many unresolved issues
re-garding the relationship between official records
and actual delinquent behavior. For example, it is
possible that official records reflect in some way the
extent and nature of delinquent behavior within a
given area even though the proportion* of actual
behavior that becomes a matter of official concern
is extremely small.
6In other words, for official
records to be of scientific value does not necessitate
congruence of official and unofficial measures.
7If
14 Short & Nye, Reported Behavior as a Criterion oj
Delinquent Behavior, 5 SoclAL PnoBimxis 207 (1957).
15
Wilson,
How to Measure the Extent of JuvenileDe-linquency, 41 J.
Cxue.L.C. & P.S. 4.35 (1950).
1
6This
point of view is made clear in T. SEIxzN &
M. WoLGANG, THE MEASURE OF DErLNQuENCy
(1964).
1If the relationship between official and unofficial
measures were "reasonably constant over time" for
given types of offenses, the fact that the official records
only represented a small proportion of the actual
only the relationship between the two sources of data was better understood, perhaps much of the controversy regarding sample selection procedures would be dissipated. The crucial point is that there is a real need for further research concerning the relationship between official and unofficial criteria of delinquency and crime. Clearly there is a need to examine "official" and "unofficial" measures of delinquency for the same samples or populations of adolescents over time. The present paper reports the results of such a study.
TnE
STUDyProcedures
The first task involved the development of a methodological means of ordering a sample of adolescents according to some "measure" of delin-quency other than "official records." Two kinds of data were chosen: self reports of past violations (self-reported delinquent behavior), and adoles-cents' estimates of the likelihood of their own future violations.
The major task involved two steps. The first was an attempt to provide some objective means for distributing a population of adolescents along a continuum of delinquency-nondelinquency (e.g., self reports, etc.). The second was directed toward establishing an empirical criterion for making a cutting point on the continuum for further empiri-cal manipulation; that is, the task would be directed toward establishing an empirical criterion for mak-ing predictions regardmak-ing future official and unoffi-cial delinquency.
Guttman's method of scale construction and in-tensity analysis seemed suited to the tasks.a Thus, having chosen a technique, questionnaire items were built which were thought to represent a
uni-offenses committed would not pose any methodological problems since one could be extrapolated from the other. The fact that we have not developed sufficient knowledge of what the relationship is, poses some difficulty, however.
18 Guttman, Cornell Technique for Scale and Inten-sity Analysis, in _.A su .ErN or CoNsuMER
IN-TEREST 60 (C. Churchman, R. Ackoff & M. Wax eds. 1947), and in 7 EDUCATIONAL AN PsycHoLoGicAL
MEASUREMENT 247 (1947); Guttman, The Quantifica-tion of a Class of Attributes: A Theory and Method of Scale Construction, in PREDICTON Op PERSONAL
AD-jusniENT 319 (P. Horst ed. 1944); Goodenough, A Technique of Scale Analysis, 4 EDUCATIONAL AND Psycoao0GCAL MAsuREmNT 179 (1944); L. Gutt-man, Questions and Answers About Scale Analysis 10 (L and E. Division, Report No. D-2, Headquarters, Army Service Forces, Washington 25, D.C., July
1945)
verse of items concerning past delinquent behavior. The form of the item was intentionally kept simple. Typical of the items included in the pretest and later in the final instruments is the following item: I (have or have not) stolen things worth less than $2 that didn't belong to me.
Items were also constructed that asked respond-ents to estimate the likelihood of their violating each of the delinquent acts in the future. The form of these items is illustrated by the following: I (would, might, wouldn't) steal things worth less than $2 that didn't belong to me.
Sample
As a matter of convenience and to avoid the bias of specifying a priori that certain groups were de-linquent because of official designation, etc., a sample was selected from a public high school. 9 In two days, questionnaires were administered to 316 boys. An attempt was made to obtain responses from the entire population of sophomores, and juniors at the high school. A few boys were absent the days the questionnaires were administered, and later 34 boys had to be dropped from the research because of nonresponse to one or more parts of the
questionnaire. This left a total of 282 boys. An examination of the non-response pattern of those who had to be deleted from the research revealed no apparent pattern of bias. The nonresponses seemed to be distributed randomly among the age and class groups. Because those who were absent constituted a small percentage of the population and because the nonresponses appeared to be random, the data were treated as though they con-stituted the data of "a representative sample." Nevertheless, technically the sample may be biased in a number of ways and fail to be representative of the adolescent population of even the commun-ity from which it was drawn. For example, it was not possible to include boys who had quit school for some reason. However, complete data were avail-able for 282 respondents oneach item included in both parts of the questionnaire. These data were submitted to the Cornell technique for scale con-struction to test the hypothesis of scaleability.
Scales
After several initial runs, a scale including only eight dichotomous items produced a coefficient of
19
MEASURES OF DELINQUENCY
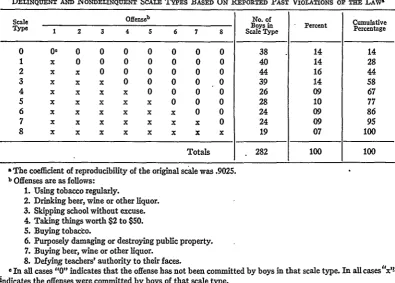
TABLE 1
DELINQUENT AND NONDELINQUENT SCALE TYPES BASED ON REPORTED PAST VIOLATIONS o THE LAWS
Scale Offenseb Boys in No. of Cumulative
Percent Percentage
Type 1 2 3 4 5 6 7 8 Scale Tyrpe Pretg
0 0' 0 0 0 0 0 0 0 38 14 14
1 x 0 0 0 0 0 0 0 40 14 28
2 x x 0 0 0 0 0 0 44 16 44
3 x x x 0 0 0 0 0 39 14 58
4 x x x x 0 0 0 0 26 09 67
5 x x x x x 0 0 0 28 10 77
6 x x x x x x 0 0 24 09 86
7 x x x x x x x 0 24 09 95
8 x x x x x x x x 19 07 100
Totals 282 100 100
a The coefficient of reproducibility of the original scale was .9025.
b Offenses are as follows: 1. Using tobacco regularly.
2. Drinking beer, wine or other liquor.
3. Skipping school without excuse.
4. Taking things worth $2 to $50.
5. Buying tobacco.
6. Purposely damaging or destroying public property. 7. Buying beer, wine or other liquor.
8. Defying teachers' authority to their faces.
GIn all cases "0" indicates that the offense has not been committed by boys in that scale type. In all cases Ux!
indicates the offenses were committed by boys of that scale type.
reproducibility of .90. The offenses included are: 1. Using tobacco regularly.
2. Drinking beer, wine or other liquor. 3. Skipping school without a legitimate excuse. 4. Stealing things worth $2 to $50.
5. Buying tobacco.
6. Purposely damaging or destroying public property.
7. Buying beer, wine or other liquor. 8. Defying teachers' authority to their faces. The resultant scale provided a simple means of ordering respondents on a continuum which would place on opposite ends those who reported exten-sive involvement in the delinquent acts included in the scale and those who reported little or no in-volvement.
Scale types were then assigned to all of the 282 boys in the sample. Table I shows the response pat-tern and a frequency and percentage breakdown of the sample according to the scale types.
When the data regarding estimates of the likeli-hood of future violations were submitted to Gutt-man scaling, twelve dichotomous items produced a coefficient of reproducibility of .93. Items regarding
the following offenses were included in this scale: 1. Skipping school without a legitimate excuse. 2. Taking things worth more than $50 other
than a car.
3. Breaking into a place illegally (i.e., store, home, etc.).
4. Purposely damaging or destroying private property.
5. Purposely damaging public property.
6. Taking things worth $2 to $50. 7. Buying beer, wine or other liquor. 8. Buying tobacco.
9. Using tobacco.
10. Drinking beer, wine or other liquor. 11. Gambling (playing poker, betonhorses, etc.). 12. Getting in a fight with someone.
Table 2 presents the response pattern and fre-quency and percentage breakdown of the sample according to the scale types for this scale.
O.ffical Ddinquency
[image:5.454.16.412.53.336.2]TABLE 2
DELINQUENT AND NONDELINQUENT SCALE TYPES BASED ON EsTArES OF FUTURE LAW VIOLATIONSa
Scale Offenseb Boys in No. of Cumulative
Percent cnage Type 1 2 3 4 5 6 7 8 9 10 11 12 Scale Type Percentage
0 0' 0 0 0 0 0 0 0 0 0 0 0 20 07 07.
1 x 0 0 0 0 0 0 0 0 0 0 0 51 18 25
2 x x 0 0 0 0 0 0 0 0 0 0 50 18 43
3 x x x 0 0 0 0 0 0 0 0 0 25 09 52
4 x x x x 0 0 0 0 0 0 0 0 21 07 59 5 x x x x x 0 0 0 0 0 0 0 17 06 65
6 x x x x x x 0 0 0 0 0 0 23 08 73
7 x x x x x x x 0 0 0 0 0 33 12 85
8 x x x x x x x x 0 0 0 0 14 05 90
9 x x x x x x x x x 0 0 0 13 05 95
10 x x x x x x x x x x 0 0 08 03 98
11 X x x x x x x x x x x 0 07 02 100
Totals 282 100 100
The coefficient of reproducibility of the original scale was .93.
b Offenses are as follows:
1. Skipping school without legitimate excuse.
2. Taking things worth more than $50 other than a car. 3. Breaking into a place illegally (i.e., store, home, etc.). 4. Purposely damaging or destroying private property. 5. Purposely damaging public property.
6. Taking things worth $2 to $50. 7. Buying beer, wine or other liquor. 8. Buying tobacco.
9. Using tobacco.
10. Drinking beer, wine or other liquor.
11. Gambling (playing poker, betting on race horses, etc.). 12. Getting in a fight with someone.
In all cases "0" means that boys assigned that scale type indicated that they thought they wouldn't commit that offense. The "x" indicates that boys in that scale type indicated that they thought they would or might commit that offense in the future.
names through the juvenile court records. Doing so data clearly qualified as "ordinal" in nature. There-made it possible to determine the exact number of fore, the gamma coefficient was chosen. The gamma times each respondent had been arrested and/or coefficient seemed particularly applicable for the taken to court for delinquent behavior. These data problem at hand for two reasons: first, because all made it possible to examine the statistical inter- three variables met the assumptions of ordinality; relationships between three variables: (1) reported and second, because gamma coefficients are opera-delinquent behavior; (2) estimates of future delin- tionally interpretable20 in terms of improvement in quent behavior; and (3) number of past official predictability.2' For present purposes, such a coeffi-court appearances. These analyses are presented cient seemed ideal for meeting the objectives of the below. study.22 However, because gamma is sometimes
FINDINGS 20 It has been suggested that one relevant and cogent criterion for choosing a measure of relationship is The Original Interrelationships coperational interpretability." See Goodman & Krus-kal, Measures of Association for Cross Classification, To begin, the interrelati6nships between the 49 J. Am. STATISTICAL ASS'N 740 (1954).
MEASURES OF DELINQUENCY
misleadingly large due to skewness of marginals (i.e., few untied pairs on one or both variables), Somers dyx coefficients were also calculated.2 Table 3 presents the intercorrelations between the three basic variables.
As can be observed, the relationships were all quite high. According to Costner, one can interpret these coefficients as "the proportion reduction of error in predictions." 24 The implication is that a coefficient is interpretable as a percentage improve-ment in prediction over a purely random set of pre-dictions. Said another way, the coefficients indicate how much predictive knowledge is added to under-standing the variability in a variable by the intro-duction of a second variable. The interpretation of the coefficients in Table 3. can thus proceed in several directions.
For simplicity, let the coefficients be thought of in terms of predicting court records. If this is done, it will be observed that court records are more ac-curately predicted from self reported past delin-quency than from estimates of future violations (gamma-.72 compared to .62-Somers dyx .58 as compared to .47). This comes as no real surprise, however, if time (as a variable) is introduced.
. It is clear that both reported delinquency and official court records are past events. Using'the time of data -collection as an anchoring point divides time into three categories: past events (court rec-ords and reported delinquency); here and now (estimates of future violations); and future events (follow-ups of any or all variables after the initial data collection).
However, attempting to cast the findings within a time sequence makes it necessary to clarify and operationalize the concept "prediction." Though the matter remains controversial, it has been sug-gested that the concept need not be limited to "forecasts of future occurrences." 25 One writer
sug-gests that it is possible to infer previous conditions of the system from the present state of a system.26 "Backward" prediction is referred to as "retrodic-tion," 21 while forecasts of future events are referred to.as "predictions."
2 Somers, A New Asymmetric Measure of Association for Ordinal Variables, 27 Am. SocIoLoOicAL REv. 799
(1962).
24 Costner & Wager, supra note 21, at 464.
25 The issue is widely discussed in the literature. See, e.g., I. ScuETLER, TE ANATOMY OF INQUIRY
46-57
(1963); Grunbaum, Temporally Asymmetric Principles: Parity Between Explanation and Prediction, in 5
INnuc-os: Som : CuRRETm Issuxs 114-45 (H. Kyburg, Jr., & E. Nagel eds. 1963).2
6 Grunbaum; supra note 25, at 114. 27Id.
TABLE 3
INTERcORRELATION MATRICEs BETWEEN COURT REcoRDs, SELF-REPORTED DELINQUENCY AND
ESTIMATES
or
FUTURE VIOLATIONSVari-able
Num-ber
Court Records Self-Reports Estimates of
Fu-ture Violations
Gamma Somers Coefficients dyx
1 2 3 1 2 3
- 72 69 - 9a 47
- .88 .76
There is, however, a common usage of the con-cept "prediction" which may ignore time alto-gether. This usage is evident in discussing "opera-tionally" the statistical relationship between two variables. For example, prediction is often used to describe how well one might infer one attribute by knowing the presence or absence of a second variable.
This discussion is not meant as a departure into a conceptual analysis; quite the contrary. The point is that for clarity, the intended meanings of terms must be made clear. In the present context, behav-ioral prediction will refer only to forecasts of future behavior, events, etc. Behavioral retrodiction will be utilized to refer to inferences to past behavior, events, etc. Statistical predictions will be used to refer to the relating of one set of events to a second set. Thus, the term "statistical predictions" makes no assertion regarding the time relationships be-tween variables. It is, therefore, appropriate to dis-cuss the accuracy of "statistical predictions" con-cerning behavioral predictions and/or behavioral retrodictions. Viewed in this light, additional com-ments about Table 3 are appropriate.
First, it is not possible to put court records in a time relationship with self-reported delinquency. Therefore, it is only appropriate to report that the accuracy of the statistical predictions of the one from the other is quite high (gamma-72 percent more accurate than random predictions-Somers dyx 58 percent better). It is difficult to say much more about this relationship. However, we might anticipate the question, "Is the relationship high 'enough to warrant the use of official delinquency as the measure of delinquency for research pur-poses?" One can only reply that it depends on how much error one can include in the dependent vari-able and still have a scientifically useful varivari-able.
It ispossible, however, to invoke a time sequence 19721
in discussing the other two correlations in Table 3. The claim for the data in Table 3 is that both official court records and self-reported delinquency precede "estimates of future violations." Therefore, it is appropriate to talk about predicting "esti-mates of future violations" from the other two variables. Thus, it can be concluded that self-reported delinquency predicts "estimates of future violations" considerably better than court records (gamma of .88 as compared to .62-Somers dyx of .76 as compared to .47). A variety of tions of these findings is possible. One
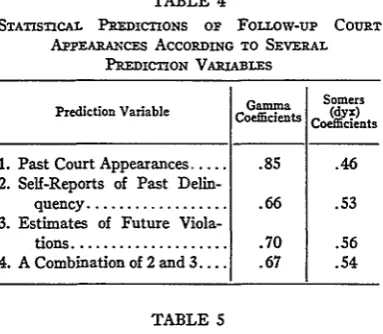
interpreta-TABLE 4
STATISTICAL PREDICTIONS OF FOLLOW-UP COURT
APPEARANCES AccORDING TO SEVERAL PREDICTION VARIABLES
Gaaa
Somers Prediction Variable Coefficients odes CofiinsCoefficients1. Past Court Appearances ... .85 .46 2. Self-Reports of Past
Delin-quency ... .66 .53 3. Estimates of Future
Viola-tions ... .70 .56 4. A Combination of 2 and 3 .... .67 .54
TABLE 5
STATISTICAL PREDICTIONS or ALL COURT APPEARANCES AccoRDniG TO SEIF-REPORTS, ESTIMATES or FUTURE
VIOLATIONS AND A COMBINATION or THE Two
Predictions
Variable Name Gamma Somers
Coefficients Co' nts
1. Self-Reported Delinquency... .95 .78 2. Estimates of Future
Viola-tions ... .86 .64 3. A Combination of 1 and 2 .... .92 .74
tion is simply that behavioral patterns are more influential in determining "covert behavior" (i.e., opinions, attitudes, estimates, etc.) than official reactions to behavior (i.e., arrests, etc.). Of course, the reliability of self-reported behavior as a meas-ure of "behavioral patterns" might be still ques-tioned. Nonetheless, the data raise a number of provocative questions for future exploration.
Only one retrodictive relationship is presented in Table 3; namely, the retrodiction of court records from "estimates of future violations." The correla-tion coefficients are gamma .62 and Somers dyx .47. The correlations in Table 3 represent the rela-tionships between the three variables at one point in time (immediately after initial data collection).
From them a series of questions arise:
1. How well can one "statistically predict" future court appearances from past court ap-pearances?
2. How well can one "statistically predict" future court appearances from self-reported or past delinquent behavior?
A number of additional kinds of data are needed to answer these questions adequately. Further-more, these are not the only questions of interest. If the relationship between official and unofficial criteria of delinquency is to be understood, a whole series of "statistical predictions," both predictive and retrodictive, must be examined.
The Interrelationship Over Time--Follow-up Data
Lack of resources made it impossible to gather all the types of data that might be relevant. However, it was plausible to make a follow-up study of official court appearances. It will be recalled that the origi-nal sample included only sophomores and juniors at a local high school. This fact minimized the diffi-culty in making a follow-up of all cases. As it turned out, the strategy paid dividends. At the end of the first year, only three boys were no longer living within the jurisdictional boundaries of the local
TABLE 6
INTERCORRELATION MATRICES BETWEEN VARIOUS INDICATORS OF COURT APPEARANCES AND OTHER VARIABLES
Past Court Future Court All Court
Variable Appearances Appearances Appearances
gamma dyx gamma dyx gamma dyx
1. Past Court Appearances ... 85 .46
2. Self-Reported Delinquency ... .72 .58 .66 .53 .95 .78
3. Estimates of Delinquency... .62 .47 .70 .56 .86 .64
[image:8.454.44.236.188.355.2]MEASURES OF DFLINQUENCY
juvenile court. An additional four boys were lost during the second year. During the third year, 23 boys were lost, all but two of whom had graduated and left the area for school or work. In summary, a two-year follow-up for the sample is quite com-plete (98 percent of the sample). Comcom-plete follow-up data for 89 percent of the sample are available for a three-year period subsequent to initial data collection.
Once the collection of the follow-up data had been completed, the questions of predictive accu-racy were explored. Table 4 presents the coefficients between follow-up court appearances and the original prediction variables (based on the 3 year follow-up).
Table 4 reveals that past court appearances are the best predictor of future court appearances (gamma .85, Somers dyx .46). "Estimates of future violations" proved to be a better predictor than either self-reports or a combination of estimates and self-reports (gamma .70 as compared to .66 and .67, Somers dyx .56 as compared to .53 and .54 respectively). There were, however, no marked differences in the relationship between the predic-tion variables and follow-up court appearances" and the relationships between the variables and past court appearances reported earlier.20
Together the data presented in Tables 3 and 4 indicate a fairly high relationship between official and unofficial criteria of delinquency.80
However, as the follow-up project proceeded, a series of new questions about the relationships emerged. For ex-ample, it has been suggested that being arrested and appearing in court is a highly improbable event, because of a host of fluctuating probabilities. If this is true, perhaps both retrodictive and pre_
28 See Table 4.
29 See Table 3.
30 The relationships were gamma .72 and .66, and Somers dyx .47 and .46 respectively.
dictive questions miss the crucial point. Perhaps it is the relationship between the variables and the total court appearances over time that is most im-portant.
Perhaps a more appropriate way of posing the question is by asking: "What is the accuracy of 'statistical predictions' of court appearances in toto (both past and future) when based on the other variables being studied?". Table 5 presents these correlations, and Table 6 is a summary table of all the correlations involving the three ways of exam-ining the relationships to measures of court ap-pearances.
The improvement in the "statistical predictions" is strikingn and may make it necessary to reexam-ine long held notions of the "nonutility" of official court records for scientific purposes. In any case,. the high correlations between the variables and court appearances in toto does tend to question the validity of many criticisms regarding the use of official records, especially if self-reports are to be utilized rather than official records.
Needless to say, these findings do not end the controversy nor even the list of questions to be posed. The study does, however, introduce some additional avenues for future explorations of the re-lationship between official and unofficial indicators of delinquency. Obviously, a considerable amount of additional work is needed. But the issues remain fundamental to a scientific approach to delin-quency and criminology. For too long research in crime and delinquency has proceeded with an in-complete knowledge of its dependent variable. In light of our ignorance of the dependent variable, it is not surprising that we have traveled so slowly and that we continue to know so little.
3IThe correlations between self-reported delin-quency and court appearances were found to be gamma .95 and Somers dyx .78.