Research Article
ISSN : 0975-7384
CODEN(USA) : JCPRC5
Development and validation of TLC densitometry method for simultaneous
determination of metformin HCl and glibenclamide in tablets dosage form
Regina Andayani*, Fifi Pitasari and Rusdi
Faculty of Pharmacy, Andalas University, Padang, Indonesia
_____________________________________________________________________________________________
ABSTRACT
Simultaneous determination of two antidiabetic drugs, metformin HCl and glibenclamide in pharmaceutical tablet formulations were investigated. A simple, rapid, precise, and accurate thin layer chromatography-densitometry (TLC-Densitometry) had been developed for the determination of mixed metformin HCl and glibenclamide in tablet
dosage forms. Normal phase thin layer chromatography plate (silica gel 60 F254) was used as stationary phase and
methanol: water: glacial acetic acid (6:4:0.25) as mobile phase. This system gave a good resolution for metformin HCL (Rf value of 0.52) and glibenclamide (Rf value of 0.78). Determination was done by densitometry in the absorbance mode at 237 nm and 300 nm for metformin HCl and glibenclamide respectively. The method was validated for linearity, precision and accuracy. The linear regression data for the calibration plot showed a good relationship with r = 0.999 and 0.996 for metformin HCl and glibenclamide, respectively. Precision of the method were between 0.56-2.02% for metformin HCl and 0.08-1.30% for glibenclamide. Accuracy of the method was found to be 88.43-104.54% for metformin HCl and 97.22-102.88% for glibenclamide. According to the results, this method was in accordance with good validation requirements.
Keywords: TLC-densitometry, antidiabetic drugs, metformin HCl and glibenclamide
_____________________________________________________________________________________________
INTRODUCTION
Metformin HCl (Fig. 1) is chemically N, N-dimethylimidodicarbonimidicdiamide Monohydrochloride is an antidiabetic drug [1]. It is a biguanide derivative that can normalize an elevated blood glucose level, provided that insulin is present. The mechanism underlying this effect is not completely understood. Decreased glucose release from the liver appears to play an essential part [2]. Glibenclamide (Fig.2) is chemically 1[[p-[2-(5-chloro-o-anisamido) ethyl] phenyl] sulfonyl-3-cyclohexylurea. It is an oral antihyperglycemic drug of the sulfonylurea class, which appears to lower blood glucose actually by stimulating the release of insulin from the pancreas [3].
______________________________________________________________________________
Figure 2. Structure of glibenclamide
Various methods had been developed for individual analysis of metformin HCl, including HPLC [4-11] and spectrophotometry [12]. Glibenclamide also had been subjected to different methods of analysis including HPLC and TLC [13-16]. Literature review also reveals that HPTLC methods have been reported for the determination of mixed metformin HCl and glibenclamide in tablet dosage forms [17-18]. Literature survey does not reveal any TLC-Densitometry method for the determination of mixed metformin HCl and glibenclamide in tablet dosage forms. The present developed TLC method is simple, precise, and accurate for determination of both drugs in tablet dosage forms as per the good validation requirements.
EXPERIMENTAL SECTION
Chemicals and reagents
Pure drug samples of metformin HCl and glibenclamide were provided by Auro Laboratories Ltd., India and Cadila Healthcare Ltd., Gujarat, India, respectively. Commercial pharmaceutical tablets Glucovance® (Merck) was procured from local pharmacy. Methanol, water, and glacial acetic acid of p.a grade. Methanol and glacial acetic acid were obtained from Merck and water was obtained from Ikapharmindo.
Instrumentation and chromatographicconditions
The TLC system consisted of a twin trough chamber (20 x 20 cm). Pre-coated silica gel 60 F254 TLC plates (20 x 20
cm, Merck, Darmstadt, Germany) were used as stationary phase. TLC plates were activated at 105 oC for 10 min prior to sample application. The standard and formulation samples of metformin HCl and glibenclamide were spotted manually on pre-coated TLC plates 1 µL and 5 µL for metformin HCl and glibenclamide respectively. The mobile phase consists of Methanol:Water:Glacial Acetic Acid (6:4:0.25). Linear ascending development was carried out in twin trough chamber. The optimized chamber saturation time for mobile phase was 20 min, at room temperature; the length of chromatogram run was 8 cm. Densitometric scanning was performed on CAMAG TLC Scanner 4 in Absorbance mode, operated by winCATS software. The spots were analyzed at wavelength 237 and 300 nm for metformin HCl and glibenclamide respectively. Evaluation was performed using linear regression analysis of peak areas.
Preparation of stock, working standard solutions and calibration curves
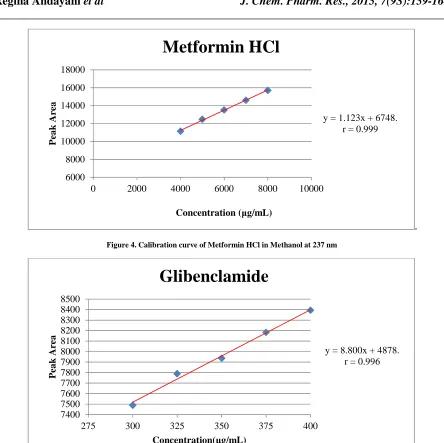
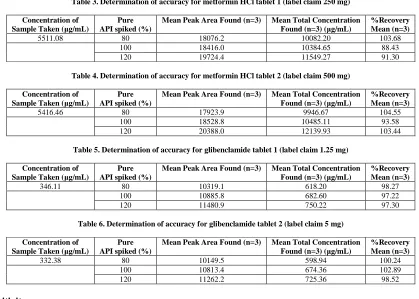
Accurately weighed metformin HCl (500 mg) was transferred to 50 mL volumetric flask, dissolved in and diluted with methanol up to the mark (10000 µg/mL). For preparation of glibenclamide stock solution, accurately weighed glibenclamide (25 mL) was transferred to 25 mL volumetric flask, dissolved and diluted with methanol up to the mark (1000 µg/mL). From metformin HCl stock solution, the standard solutions ranging from 4000-8000 µg/mL were prepared and from glibenclamide stock solution the standard solution ranging from 300-400 µg/mL were also prepared. Calibration was obtained by applying each standard solution on TLC plates. From the developed plates calibration curve was plotted as peak areas versus corresponding concentrations (Fig.4 and 5).
Analysis of metformin HCl and glibenclamidein marketed tablet formulation
To determine the content of metformin HCl and glibenclamide in conventional tablets (label claim 250 mg metformin HCl and 1.25 mg glibenclamide; 500 mg metformin HCl and 5 mg glibenclamide); twenty tablets were accurately weighed, average weight determined and ground to fine powder. A quantity of powder equivalent to 250 mg metformin HCl and 17.5 mg glibenclamide was each transferred into 25 mL volumetric flask containing 20 mL methanol, sonicated for 10 min and diluted to mark with same solvent to obtained 10000 µg/mL metformin HCl and 700 µg/mL glibenclamide. The resulting solution was centrifuged 3000 rpm for 5 min and was filtered using filter paper. From each solutions then was diluted into 10 mL volumetric flasks with methanol and was obtained 6000
Development and Validation of TLC Method Linearity
For the linearity study, the 4000-8000 µg/mL working standard solutions were applied 1 µL on TLC plate followed by development and scanning at 237 nm; and for glibenclamide the 300-400 µg/mL working standard solutions were applied 5 µL on TLC plate followed by development and scanning at 300 nm. The application was repeated for three times.
Precision
Precision of the method was determined in the terms of intra-day and inter-day variation (%RSD). Intra-day precision was assessed by analyzing standard drug solutions within calibration range, three times on the same day. Inter-day precision was assessed by analyzing drug solutions within the calibration range on three different days.
Accuracy
To the pre-analyzed sample a known amount of standard solution of pure drug (metformin HCl and glibenclamide) was spiked at three different levels (80%, 100%, and 120%). These solutions were subjected to re-analysis by the proposal method.
Sensitivity
The sensitivity of measurement of metformin HCl and glibenclamide by the use of proposed method was estimated in terms of limit of detection (LOD) and limit of quantitation (LOQ). The LOD and LOQ were calculated by equation. Based on the standard deviation of the response and the slope, LOD and LOQ were estimated using the formulae:
LOD= 3.3 σ/S (Where σ = the standard deviation of the response, S = the slope of the calibration curve)
LOQ = 10 σ/S (Where, σ = the standard deviation of the response, S = the slope of the calibration curve)
LOD and LOQ were determined from the standard deviations of the responses for three replicate determinations.
RESULTS AND DISCUSSION
[image:3.595.208.404.517.650.2]The TLC procedure was optimized for determination of metformin HCl and CHL. The mobile phase Methanol: Water: Glacial acetic acid (6:4:0.25) resulted in good resolution of Rf 0.52 for metformin HCl and 0.77 for glibenclamide. It was observed that activation of TLC plates and pre-saturation of TLC chamber with mobile phase for 20 min (optimum chamber saturation time) ensured good reproducibility and peak shape of both the drugs (Fig.3).
Figure 3. TLC Chromatogram of standard metformin HCl (a) and glibenclamide (b) in mixture
Linearity
Linear regression data for the calibration plots revealed good linear relationships between area and concentration over the ranges 4000-8000 µg/mL for metformin HCl and 300-400 µg/mL for glibenclamide. The linear equations for the calibration plots were y = 1.123x+6748.9 and y =8.800x+4878.4 with Regression (r) being 0.999 and 0.996 for metformin HCl and glibenclamide respectively (Fig.4 and 5).
(a)
______________________________________________________________________________
[image:4.595.76.520.77.520.2].
Figure 4. Calibration curve of Metformin HCl in Methanol at 237 nm
.
Figure 5. Calibration curve of glibenclamide in Methanol at 300 nm
Precision
[image:4.595.102.492.327.547.2]The precision of the method was expressed as relative standard deviation (% RSD). The % RSD values for intra-day precision study and inter-day study listed in (Table 1 and 2) were ≤ 2.0%, confirming that the method was sufficiently precise.
Table 1. Intra-Day and Inter-day study of metformin HCl
Concentration (µg/mL) Intra-Day Area Mean (n=3) ± SD %RSD Inter-Day Area Mean (n=3) ± SD %RSD
6000 13126.23±73.69 0.56 13378.1±242.22 1.81 7000 14323.20±91.66 0.64 14608.2±296.04 2.03 8000 15643.73±64.31 0.41 15660.0±226.01 1.44
y = 1.123x + 6748. r = 0.999
6000 8000 10000 12000 14000 16000 18000
0 2000 4000 6000 8000 10000
P
ea
k
A
re
a
Concentration (µg/mL)
Metformin HCl
y = 8.800x + 4878. r = 0.996
7400 7500 7600 7700 7800 7900 8000 8100 8200 8300 8400 8500
275 300 325 350 375 400
P
ea
k
A
re
a
Concentration(µg/mL)
Concentration (µg/mL) Intra-Day Area Mean (n=3) ± SD %RSD Inter-Day Area Mean (n=3) ± SD %RSD
325 7781.1±14.01 0.18 7759.1±30.20 0.39 350 7884.3±116.23 1.47 7905.7±103.40 1.31 375 8203.0±45.75 0.56 8169.8±42.76 0.52
Accuracy
[image:5.595.87.506.230.529.2]When the method was used for accuracy and subsequent analysis of both the drugs from the pharmaceutical dosage form, and spiked with 80, 100, and 120% of additional pure drug, the recovery was found to be 88.43-104.54% for metformin HCl (Table 3 and 4) and 97.22-102.88% for glibenclamide(Table 5 and 6).
Table 3. Determination of accuracy for metformin HCl tablet 1 (label claim 250 mg)
Concentration of Sample Taken (µg/mL)
Pure API spiked (%)
Mean Peak Area Found (n=3) Mean Total Concentration Found (n=3) (µg/mL)
%Recovery Mean (n=3)
5511.08 80 18076.2 10082.20 103.68
100 18416.0 10384.65 88.43
120 19724.4 11549.27 91.30
Table 4. Determination of accuracy for metformin HCl tablet 2 (label claim 500 mg)
Concentration of Sample Taken (µg/mL)
Pure API spiked (%)
Mean Peak Area Found (n=3) Mean Total Concentration Found (n=3) (µg/mL)
%Recovery Mean (n=3)
5416.46 80 17923.9 9946.67 104.55
100 18528.8 10485.11 93.58
120 20388.0 12139.93 103.44
Table 5. Determination of accuracy for glibenclamide tablet 1 (label claim 1.25 mg)
Concentration of Sample Taken (µg/mL)
Pure API spiked (%)
Mean Peak Area Found (n=3) Mean Total Concentration Found (n=3) (µg/mL)
%Recovery Mean (n=3)
346.11 80 10319.1 618.20 98.27
100 10885.8 682.60 97.22
120 11480.9 750.22 97.30
Table 6. Determination of accuracy for glibenclamide tablet 2 (label claim 5 mg)
Concentration of Sample Taken (µg/mL)
Pure API spiked (%)
Mean Peak Area Found (n=3) Mean Total Concentration Found (n=3) (µg/mL)
%Recovery Mean (n=3)
332.38 80 10149.5 598.94 100.24
100 10813.4 674.36 102.89
120 11262.2 725.36 98.52
Sensitivity
The LOD and LOQ were calculated by equation. The LOD and LOQ values were 232.277 µg/mL and 774.256
µg/mL for metformin HCl and 12.518 µg/mL and 42.727 µg/mL for glibenclamide.
CONCLUSION
The developed TLC-Densitometry method is simple, precise, and accurate, and can be used for simultaneous determination of metformin HCl and glibenclamide in tablet dosage forms. The method was validated and in accordance with good validation requirements.
REFERENCES
[1]Bertram G.K. Basic and Clinical Pharmacology. 10thedn. San Francisco: McGraw Hills Company; 2007. [2]Heinz L; Klaus M; Lutz H;Detlef B. Color Atlas of Pharmacology. 3rdedn. New York: Thieme; 2005. 264-265. [3]L Luzi; G Pozza. Acta Diabetol, 34 edn, 1997, 239-244.
[4]S Abu Ruz; J Millership;J McElnay. J Chromatogr B, 2003, 798, 203–209.
______________________________________________________________________________
[7]N Koseki; H Kawashita; M Niina; Y Nague; N Masuda. J Pharm Biomed Anal, 2005, 36, 1063–1072. [8]X Chen; Q Gu; F Qiu; D Zhong. J Chromatogr B, 2004, 802, 377–381.
[9]O Vesterqvist; F Nabbie; B Swanson. J Chromatogr B, 1998, 716, 299–304. [10] F Tache; V David; A Farca; A Medvedovici. Microchem J, 2001, 68, 13–19.
[11] M Zhang; GA Moore; M Lever; SJ Gardiner; CMJ Kirkpatrick; E.J Begg. J Chromatogr B, 2001, 766, 175– 179.
[12] S Ashour; R Kabbani. Anal Let, 2003, 36(2), 361–370.
[13] Z Wang; Z Zhang; Z Fu; W Luo; X Zhang. Anal Let, 2003, 36(12), 2683–2697.
[14] J Khatri; S Qassim; O Abed; B Abraham; A Al-Lami; S Masoo. J Pharm Sc.i, 2001, 4, 201–206. [15] P Tiller; AP Land; I Jardine; DM Murphy; A Ayrton; WH Schaefer. J Chromatogr A., 1998, 794, 15–25 [16] S Satoh; K Doi; T Kojima; K Kumasuka. J Pharmaceut Soc Jap., 2003, 123, 1049– 1054